EdgeGuard — Daily Summary
What was refused each day, who it came from and what they were reaching for: the record of handled traffic that the bell deliberately does not keep.
What was refused each day, who it came from and what they were reaching for. Everything on this page was already handled — this is the record of it.
The rest of the console answers what is happening now. The bell tells you about conditions that need fixing and goes quiet when they clear, which is correct: an agent that came back does not deserve a row for ever. But it means a day of traffic leaves no trace anywhere a person will look.
That gap is real and was measured: twenty-four hours in which one site took three coordinated floods from a single /24 — nine thousand refused requests in under a minute of traffic each, twenty minutes apart, the source rotating between them — and the operator's account of that day was "I had no alerts". Nothing had failed. The WAF refused all of it. The events were all in the table. Nobody reads the table.
This page is the missing summary.
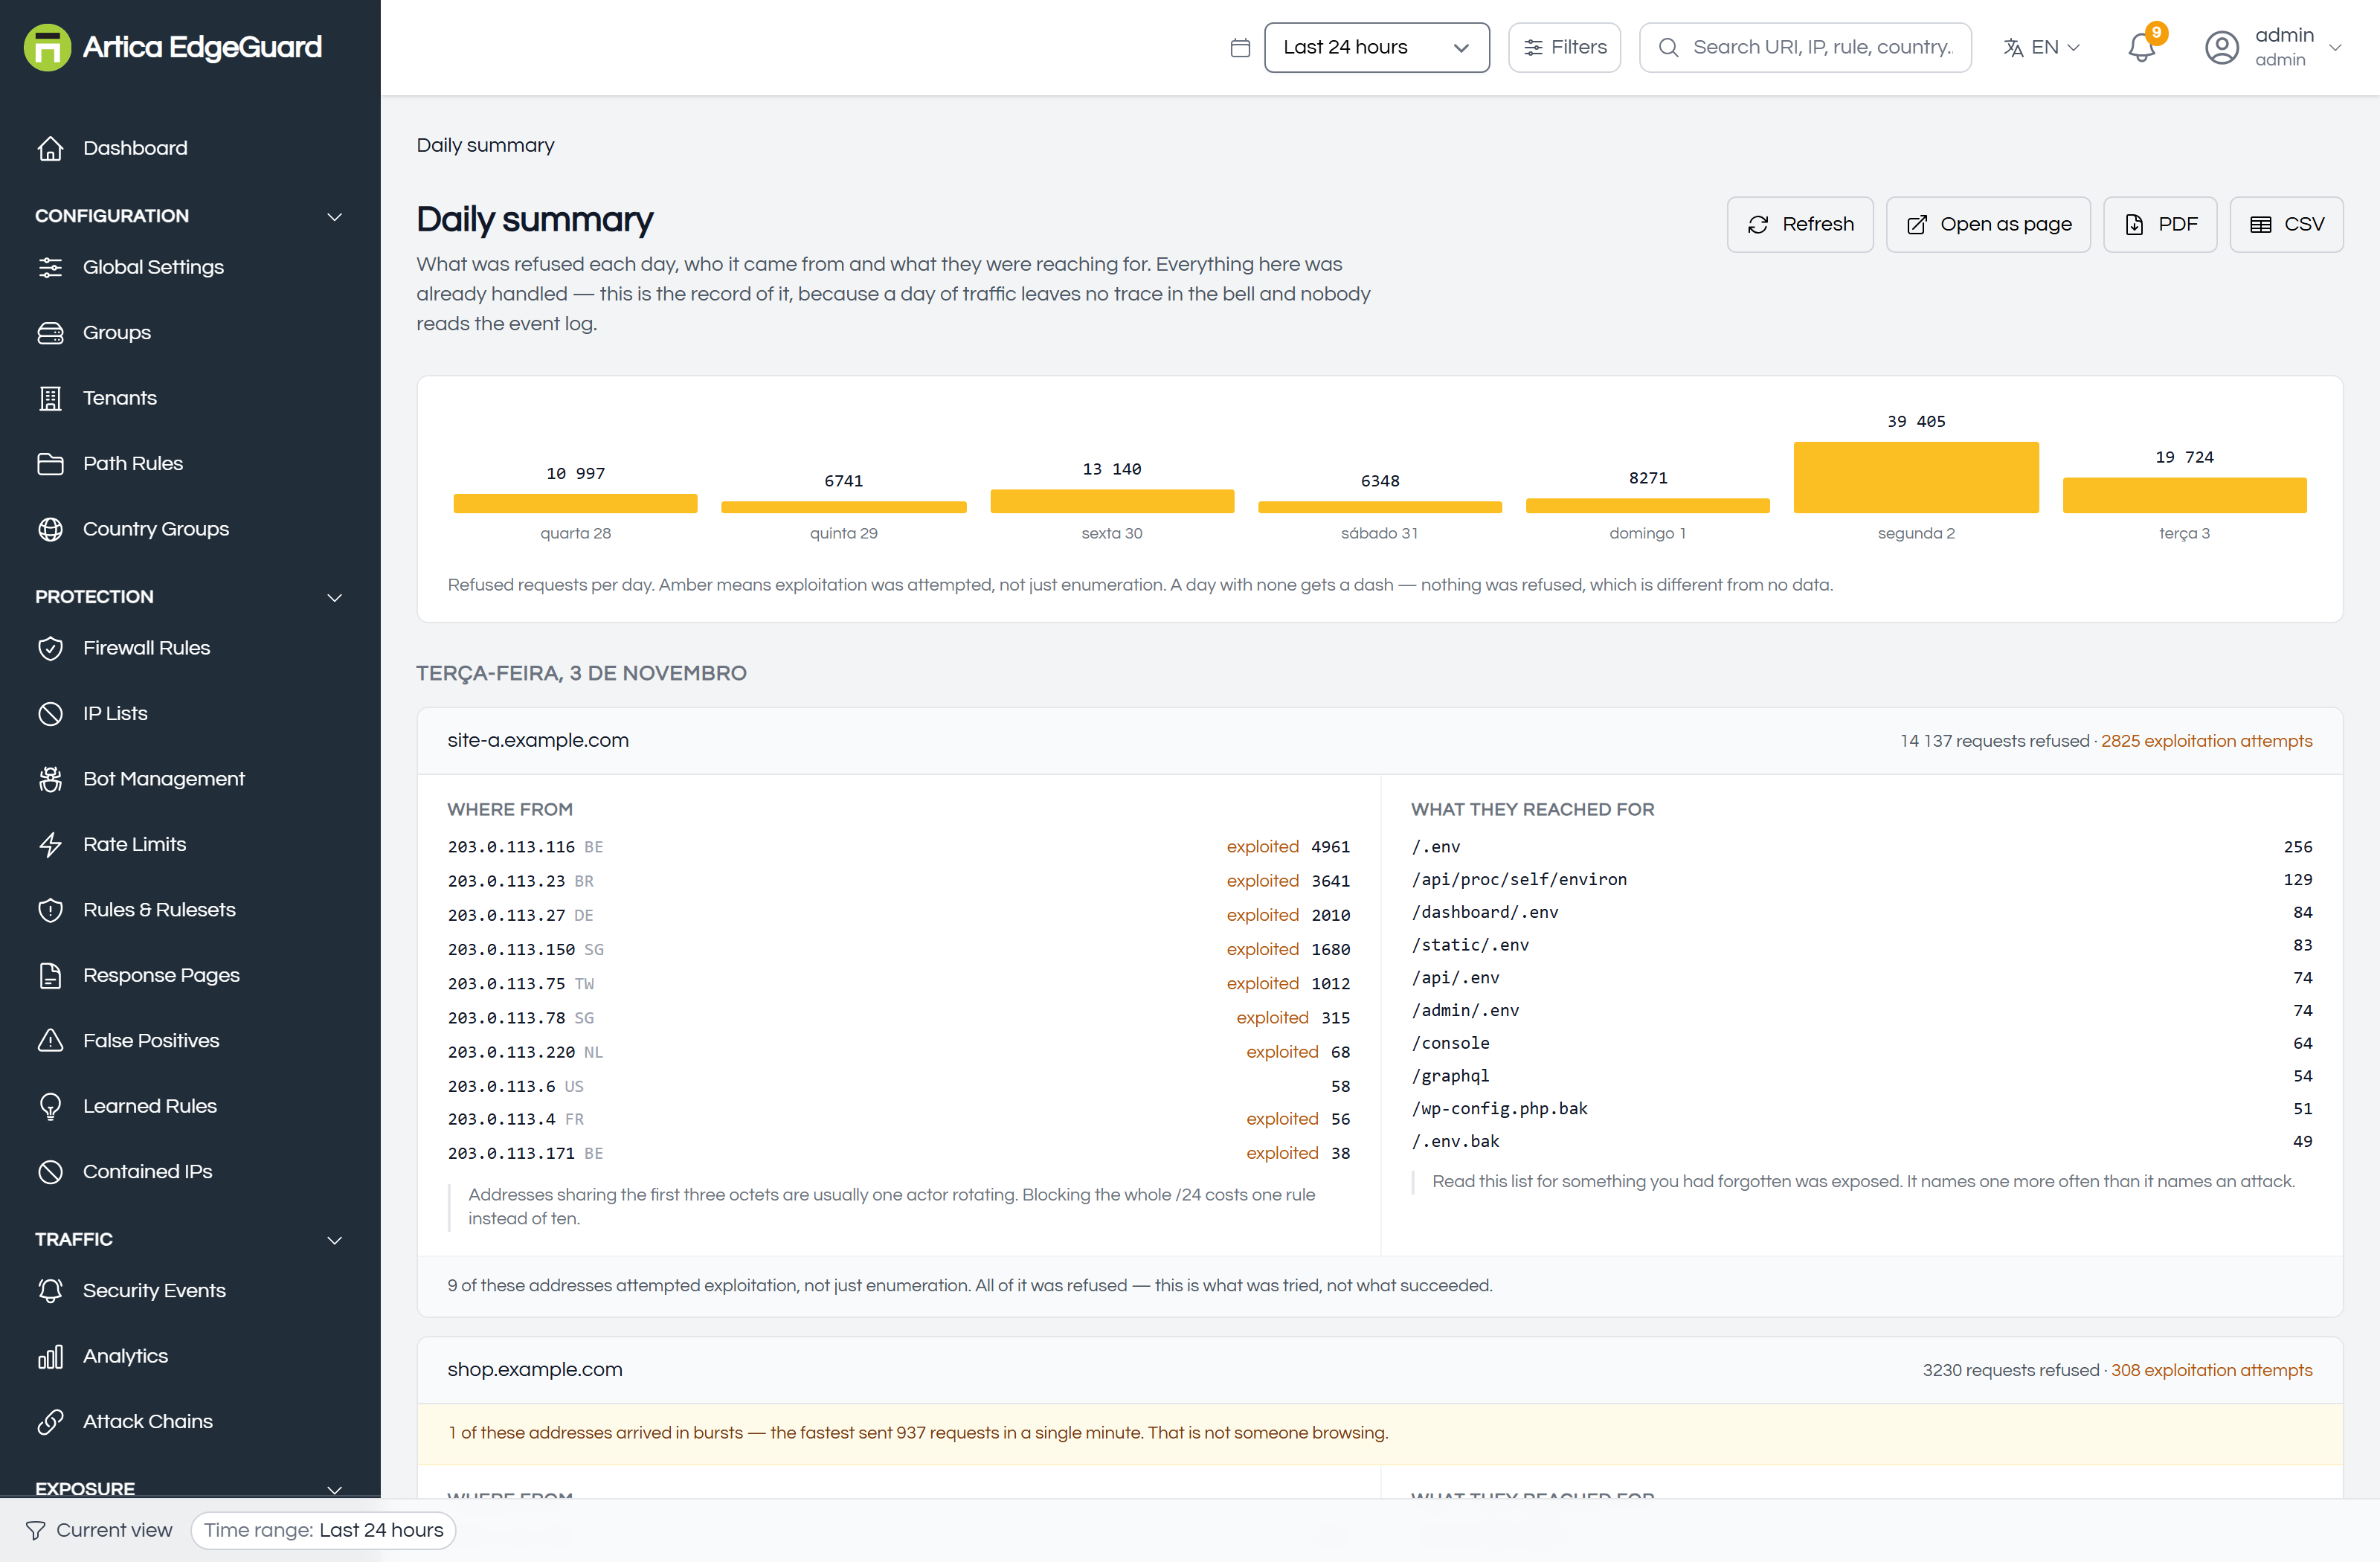
The week at the top
One bar per day: how many requests were refused across every site you can see. Amber means exploitation was attempted, not just enumeration — the same count means something different when somebody was trying to get in rather than knocking on doors.
A day with nothing refused gets a dash, not a zero bar. Nothing refused and no data are different facts and the page says which.
Click a day to read only that day; click it again for the whole week.
A site's day
Each site that saw a refusal gets a card, with the totals and two lists.
Where from — up to ten addresses, with country, how many requests, and exploited against the ones that went past probing. Underneath, the sentence that matters most on this page:
Addresses sharing the first three octets are usually one actor rotating. Blocking the whole /24 costs one rule instead of ten.
That is the page's whole purpose in one line: five addresses at 258 requests each, all in 203.0.113.x, is not five attackers.
What they reached for — up to ten paths. Read this list for something you had forgotten was exposed. It names a forgotten file more often than it names an attack: /.env, /.git/config, /wp-config.php.bak. The refusals are not the finding; the fact that somebody is systematically asking for those on your site, and that they exist to be asked for, is.
Below the lists, one line puts it in proportion: how many of those addresses attempted exploitation, and that all of it was refused — this is what was tried, not what succeeded.
How it is computed
- Hourly, recomputing today and yesterday every time. A day is not finished when it is first summarised: agents ship events on a heartbeat, and an agent that was offline ships its backlog when it returns. A digest written once at midnight would be a summary of whatever had arrived by midnight.
- Idempotent. The same day computed twice gives the same row.
- Only sites with a refusal get a row. A site with nothing refused is absent, and that absence is the answer — a row of zeroes reads as a report that failed to gather anything.
- Bursts are noticed. An address's peak-per-minute is recorded separately from its total, because three thousand refusals spread over a day and three thousand in nineteen seconds are the same number and not the same event.
The morning notification
One notification, for the whole fleet, about yesterday — the only thing in the bell that is about the past, and it earns the exception. Everything else there clears when its condition clears; a flood that was refused is not a condition to fix, it is something that happened, and an operator who was asleep has no other way to learn that it did.
It summarises the fleet and names only the few sites that stand out. It was one notification per site once, which is defensible with three sites and absurd with a hundred: a bell with a hundred rows in it is a red number nobody opens — the exact failure this page exists to avoid, reintroduced by the feature meant to serve it.
Nothing is said about a quiet day. A bell that reports "yesterday was fine" every morning is one people stop opening, and then the morning it is not fine looks like all the others.
Dismissing it is per day: reading it makes it go away, and tomorrow's is new.
Exporting
Three formats, all of the week rather than the day selected — an export of one day sent to somebody else answers fewer questions than it raises:
- Open as page — the same summary as a web page, for pasting into a ticket or sending to a colleague.
- PDF — for a report or a meeting.
- CSV — for a spreadsheet.
# The same week, over the API
curl -H "X-API-Key: $EDGEGUARD_KEY" \
  "https://central.example.com:8082/api/v2/digests/export?format=csv" -o week.csv
Reading it well
Look at the amber, not the height. A tall grey day is a scanner being refused. A short amber day is somebody trying to exploit something.
Read the paths before the addresses. The addresses change; what they are asking for tells you what to go and check.
Group by subnet. If the top five addresses share three octets, that is one rule.
Compare days, not totals. The bar chart exists so that Tuesday against last Tuesday is one glance.
Where the daily summary is the wrong tool
- What is happening now → the Dashboard and Security Events.
- One request → Security Events, by its EdgeGuard ID.
- Trends over months → Analytics.
- A case file per attacker → Incidents.
- Evidence for an auditor → Compliance Reports.