This procedure explains how to forward the access-event stream to the Log-Sink server exclusively for statistical analysis.
Artica Proxy transmits the metrics over a Syslog stream, while the Log-Sink server ingests the data and formats it in its database for reporting.This feature is available on Artica v4.50 Service Pack 5 or Artica v4.50 Service Pack 4 Hotfix 20250613-13
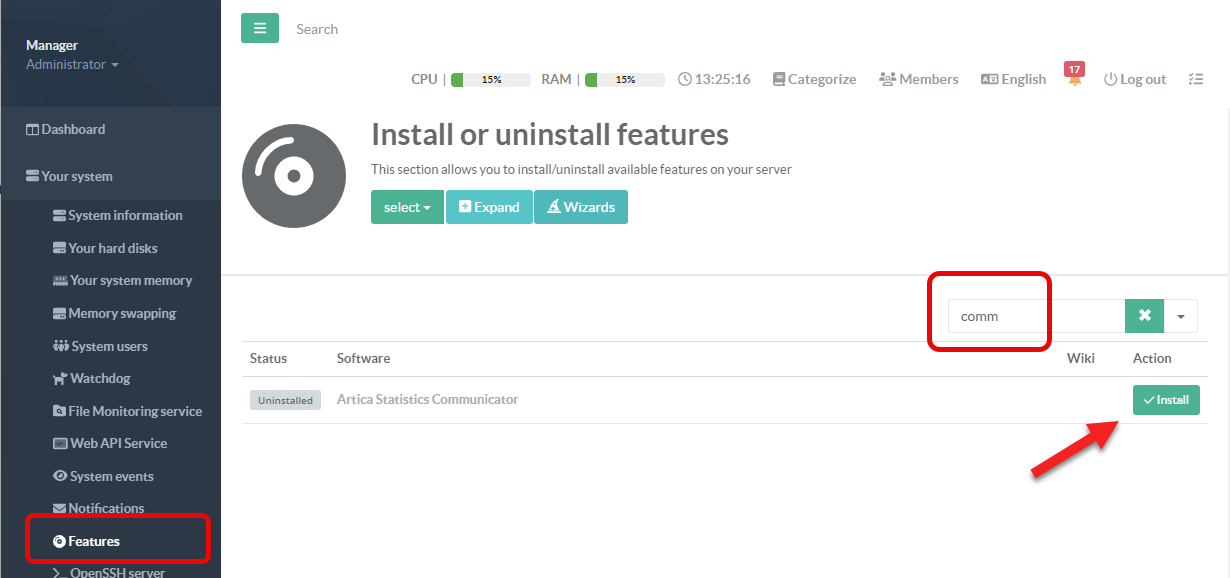
¶ Activate the Proxy statistics receiver on the Log-Sink server
- On the left menu, go to
Your system > Feature - Search then entry “Artica Statistics communicator”
- Click on Install button
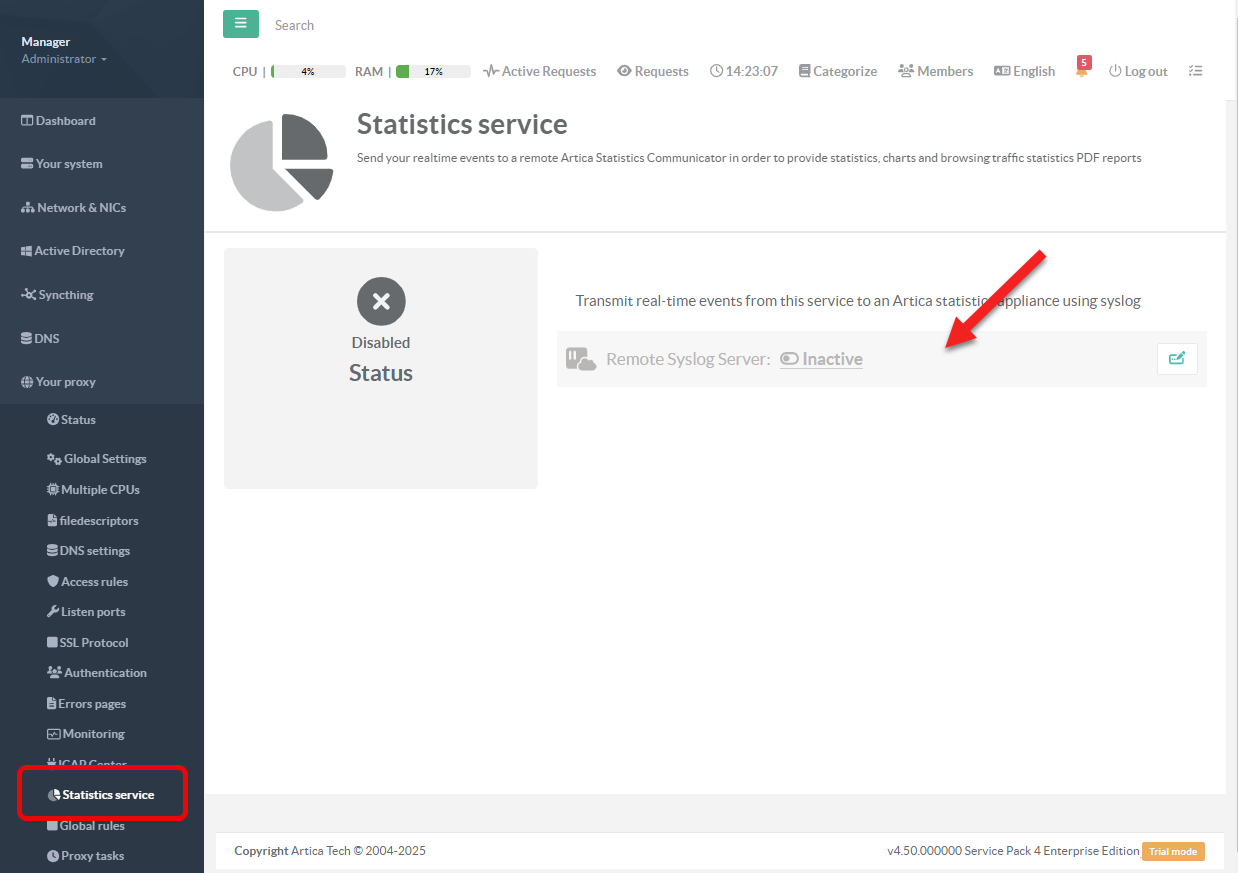
¶ Streaming Artica Proxy statistics to the log-sink server
This procedure configures Artica Proxy to push its real-time statistics stream to the log-sink server over the Syslog protocol.
On the left-menu, choose Your Proxy > Statistics service
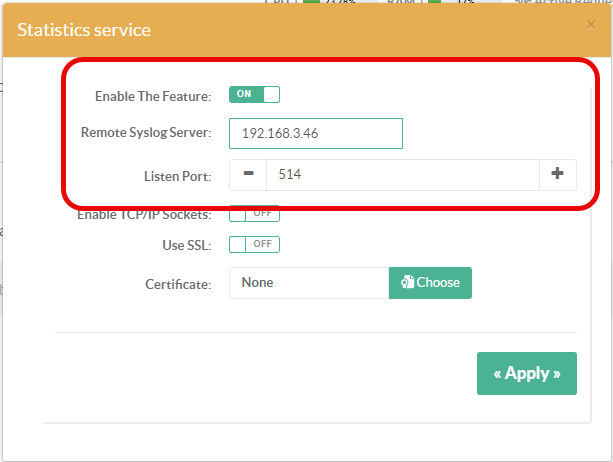
- Activate the feature
- set the Syslog server address and port ( default 514 )
- Click on Apply button
¶ Verify the connectivity on the Artica Proxy client server
Artica sends pre-formatted events over syslog, which the log-sink server must ingest in order to populate the database.
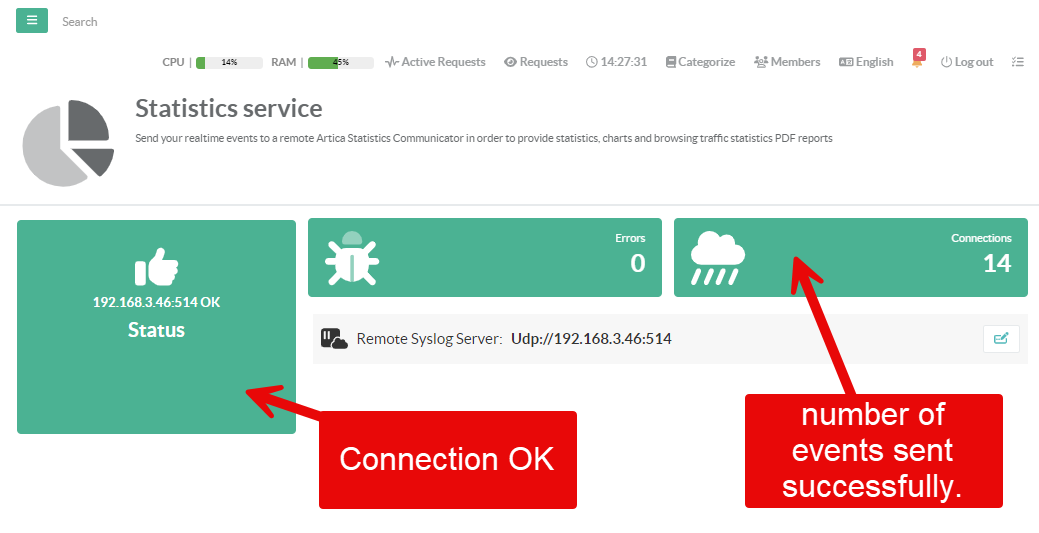
The Artica Proxy dashboard provides three widgets:
- Left-hand widget
Confirms connectivity to the Syslog server address you configured. - Top-left widget
Indicates events that failed to reach the statistics server. In normal operation this widget will be green and show “0.” - Top-right widget – Counts the events successfully forwarded to the Log-Sink server.
If the counter stays at zero, the proxy has not yet sent any requests.
Generate traffic by browsing a few websites through the proxy, and the numbers should start to rise.
¶ Verify the connectivity on the Log-Sink server
- On the Artica log-sink, go to
Statistics > Artica Statistics communicator - You will see 2 important widgets.
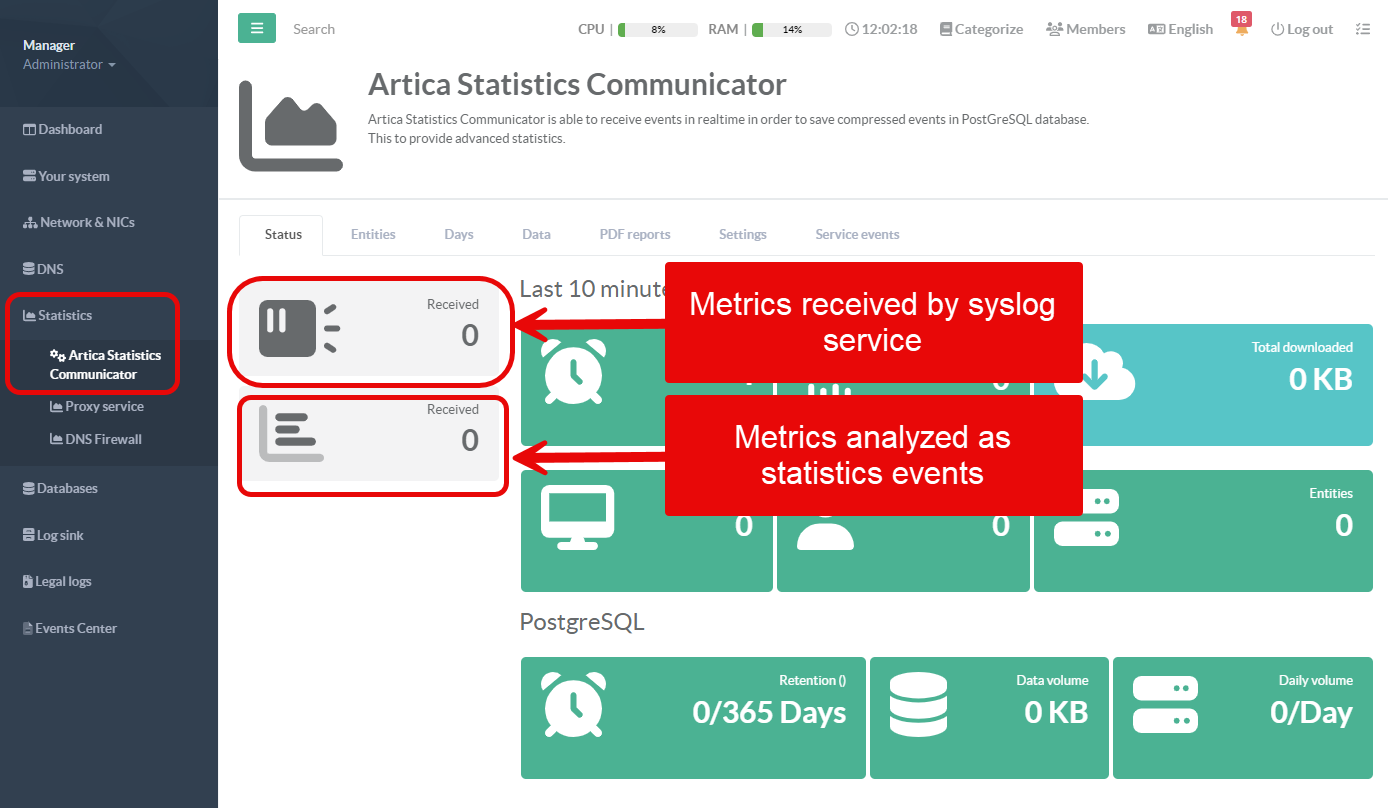
- The first widget represents the receiver.
When the proxy sends the syslog stream and the log-sink’s syslog server receives it, the syslog service forwards that stream to the receiver’s local Unix socket.
The receiver then counts the incoming events.
If you see “0,” or the counter never increases, either the local syslog service cannot talk to the local Unix socket, or no events are being received at all.
- The second widget represents the event-translation engine.
It breaks each event into key–value pairs so they can be matched against the database.
If it shows “0,” either no relevant events have been found, or the events being received are incompatible with the parsing process.
¶ What Received / Processed / Queued means ?
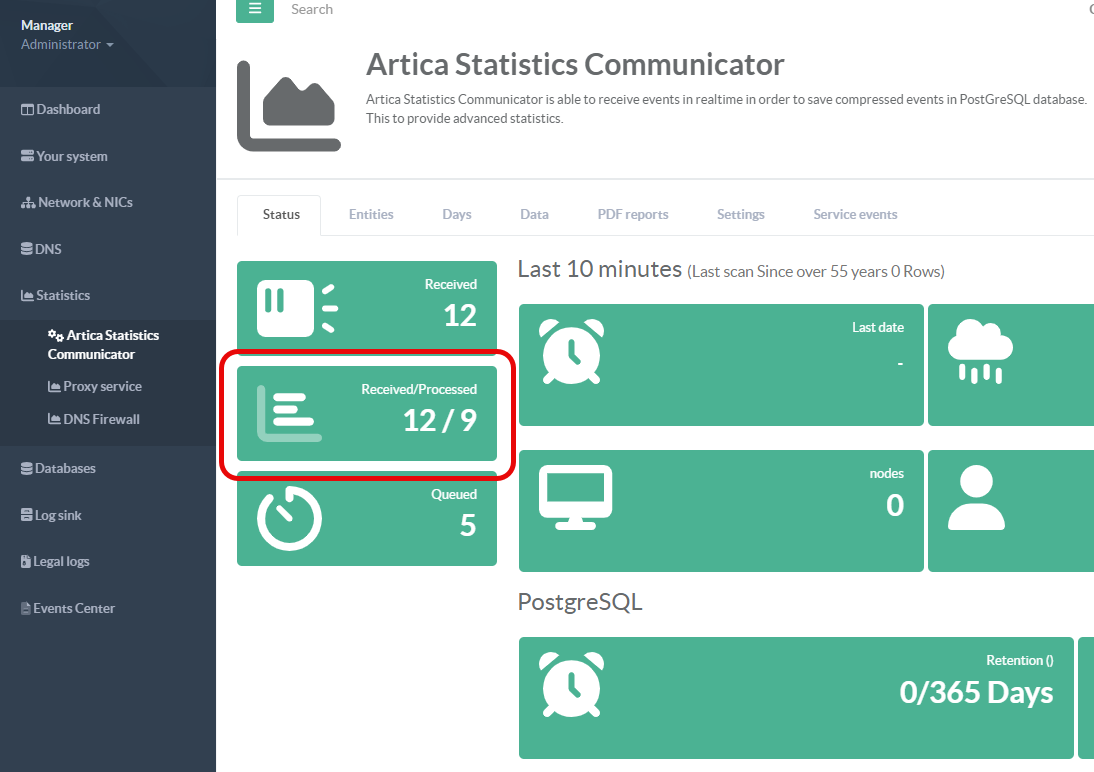
- “Received” metric – shows how many events have been handed off to the statistics engine.
- “Processed” metric – shows how many of those events have been compressed.
The statistics engine stores data in 10-minute windows.
If successive events are identical, they are aggregated during that window.
Example: Suppose user Jhon makes two 12 kB requests to google.com one second apart.
Instead of keeping two separate rows, Artica keeps a single in-memory record: 2 requests, 24 kB, user = Jhon, host = google.com—valid for that ten-minute slice.
The Queued widget shows how many such aggregated records are currently held in memory for the active ten-minute window.
When a record’s ten-minute lifetime expires, it is flushed to the PostgreSQL database.
So, continuing the example, after ten minutes you would see just one database row saying “user Jhon makes 1500 requests to google.com, 17 MB” (if that was the total aggregated during the window).