Artica gives you deep visibility into proxy traffic—showing who browses what, when, and where, and exactly how much bandwidth each activity consumes.
- Overview and Deployment Guide
Artica Proxy includes a Statistics module that captures and displays detailed Internet-usage metrics for all traffic flowing through the proxy.
- Activate Statistics on Your Artica Proxy
To enable statistics on your proxy, simply install the Artica Statistics Communicator.
¶ Centralised, Multi-Proxy Reporting
Deploy a single Statistics Communicator server to collect events from all your Artica proxies.
The logs are merged automatically and exposed through one clean web interface.
- Send proxy statistics to the Log-Sink
Forwarding Artica Proxy traffic logs to a log-sink service for member-level surfing analytics
¶ Automated PDF Reports
Schedule polished PDF summaries to be delivered by e-mail:
Frequency Options
- Daily “Today”, “Yesterday”
- Weekly Current or previous week
- Monthly Current or previous month
¶ Fine-Grained Access Control
Grant read-only or full statistics access to selected users or groups drawn from:
Artica’s internal user database
- LDAP directories
- Microsoft Active Directory
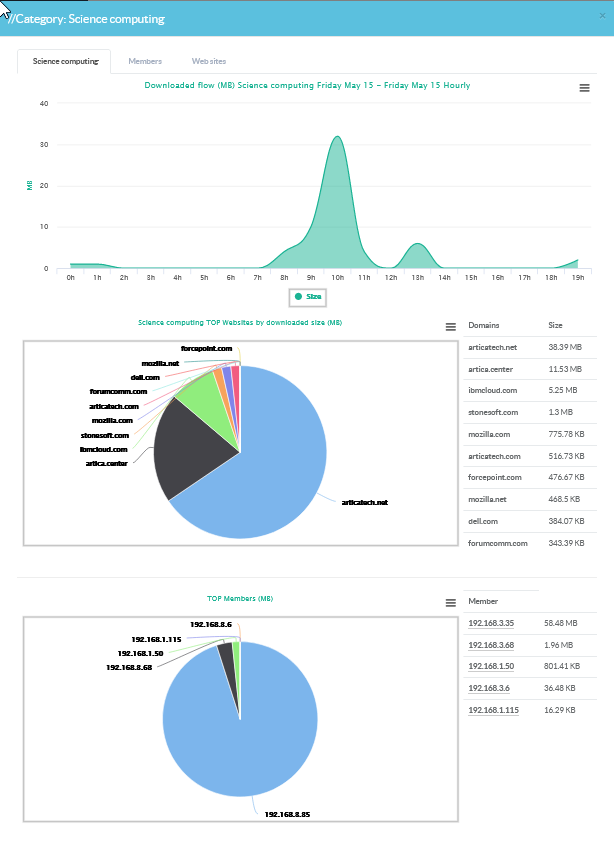
¶ Category-Based Insights
Thanks to Artica’s built-in URL categorisation, you can slice usage by topic—News, Pets, Social Media, Cars, and dozens more—making it easy to spot trends at a glance.
¶ Interactive “What / Where / When / Who” Queries
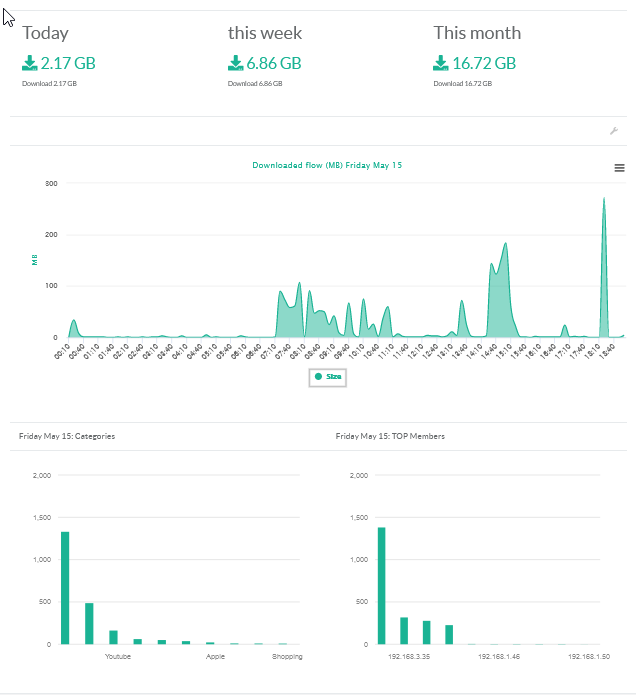
Generate on-demand graphs, charts, and tables that answer key questions such as:
- Which users are consuming the most bandwidth?
- At what times does streaming traffic peak?
- Which sites dominate each category?