Artica SIEM for FortiGate: clients
The internal devices seen by your FortiGate firewalls, with their MAC address, name, operating system, data received and sent, and their details.
Back to Artica SIEM for FortiGate
The Clients page is an inventory of the internal devices your FortiGate firewalls see, built from their logs alone. For each device it shows its address, MAC address, name, operating system and how much data it received and sent over the last three weeks.
Why use it
- You get a list of what is on the network without installing anything on the devices.
- The heaviest users of the Internet connection are one click away, with the destinations they reached.
- An unknown MAC address or an unexpected operating system stands out in the list.
What counts as a client
A client is a source address in the private ranges: 10.0.0.0/8, 172.16.0.0/12 and 192.168.0.0/16 (RFC 1918), and fc00::/7 for IPv6. A client is identified by the FortiGate that sees it, its MAC address and its IP address. Two sites that use the same addressing are therefore kept apart, and so are the machines behind an internal router, which the FortiGate sees with the router's MAC address.
The name is the address's DNS name when it resolves, otherwise the name the FortiGate learned through device detection. A device that stays silent for more than three weeks is removed with its history.
Statistics tab
Statistics/SIEM > Fortigate > Clients. The header filters by tenant and FortiGate.
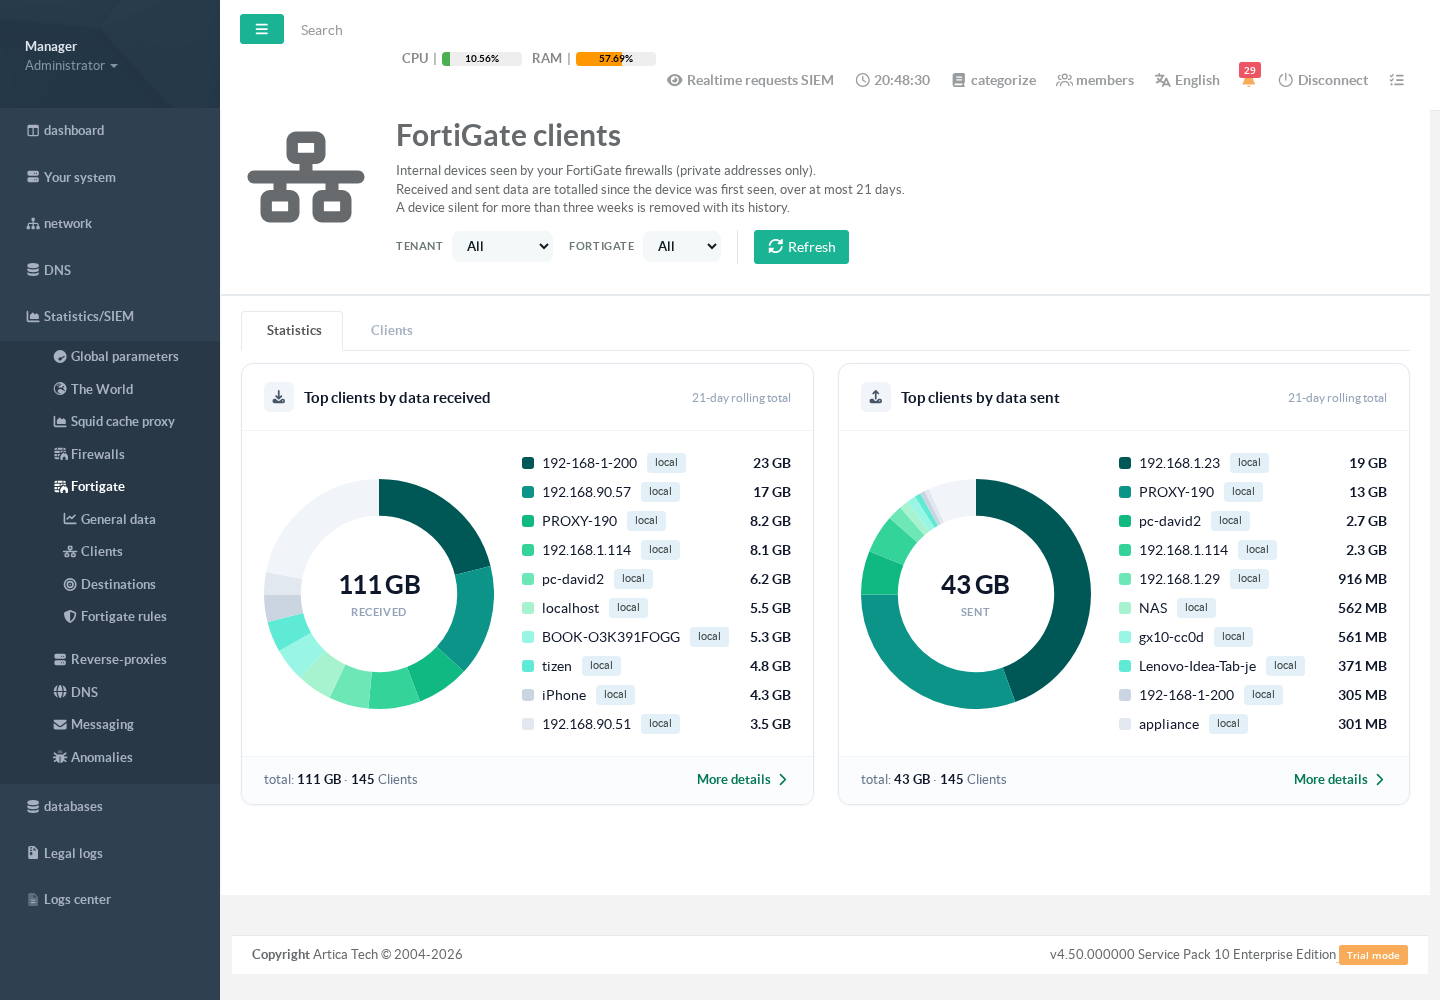
Top clients by data received and by data sent.
Two rings rank the clients by data received and by data sent, over a rolling 21 days. Click a name to open its details. More details opens the top 100.
Clients tab
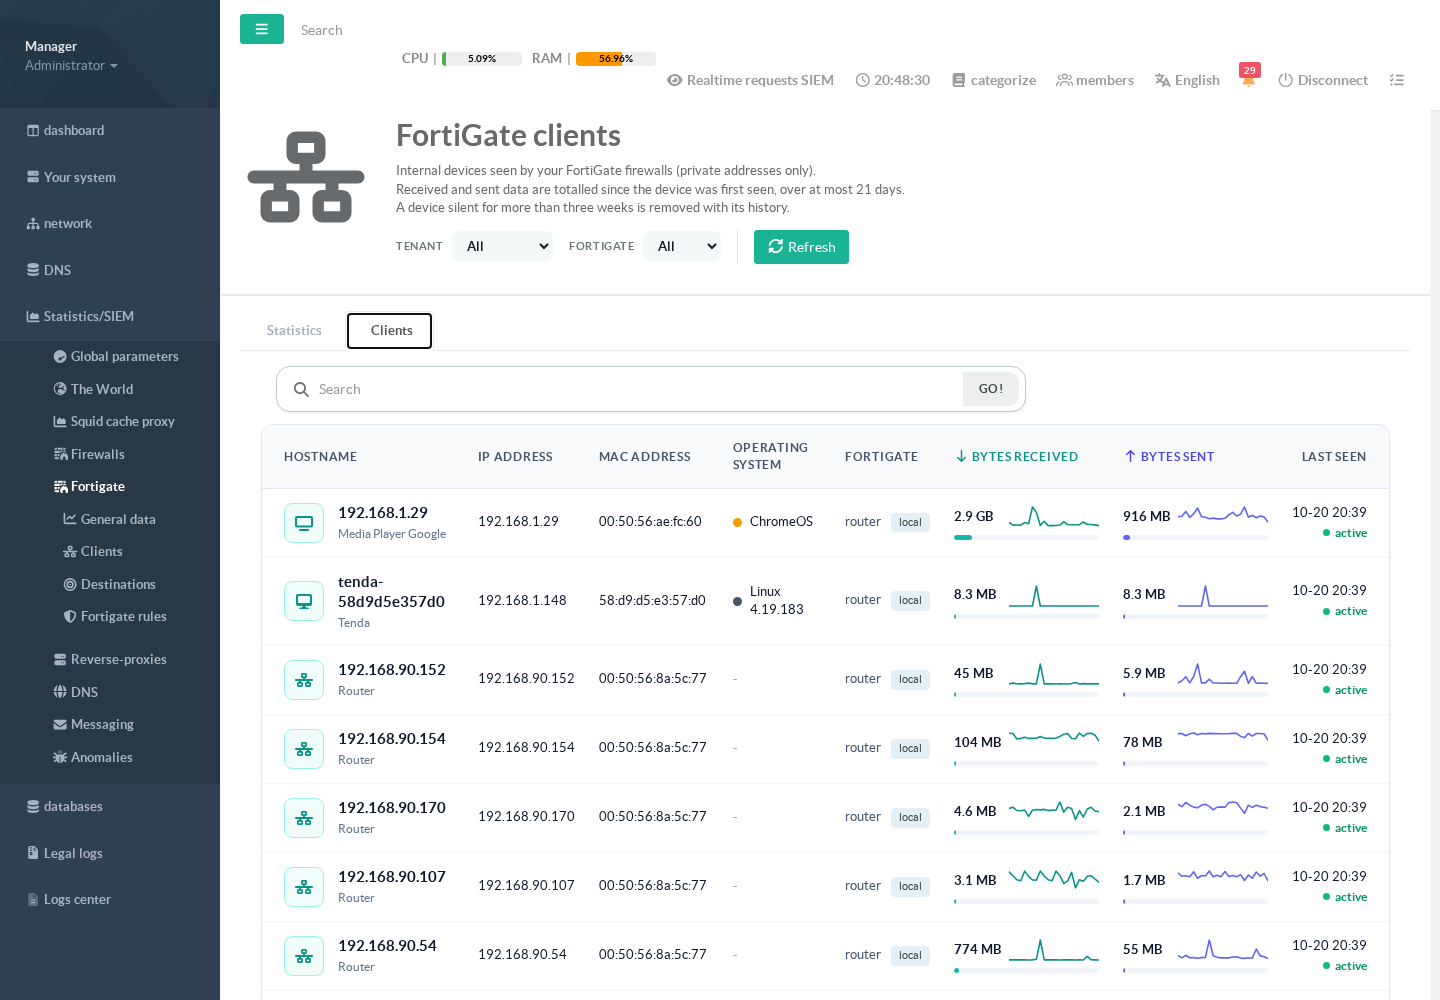
The client list with its trend lines.
The list shows, for each client: its name with the device type and vendor, its address, its MAC address, its operating system, the FortiGate that sees it, the data received and sent with a 24-hour trend line and a bar relative to the largest client, and when it was last seen. active marks a client seen in the last 15 minutes. The search box matches the name, the address, the operating system, the vendor and the FortiGate.
MAC addresses are shown to administrators and to accounts with access to raw data only. For other accounts the column is hidden, and a MAC address cannot be searched.
Client details
Click a client's name. The window shows the client's identity and a period selector (1 hour to 21 days).
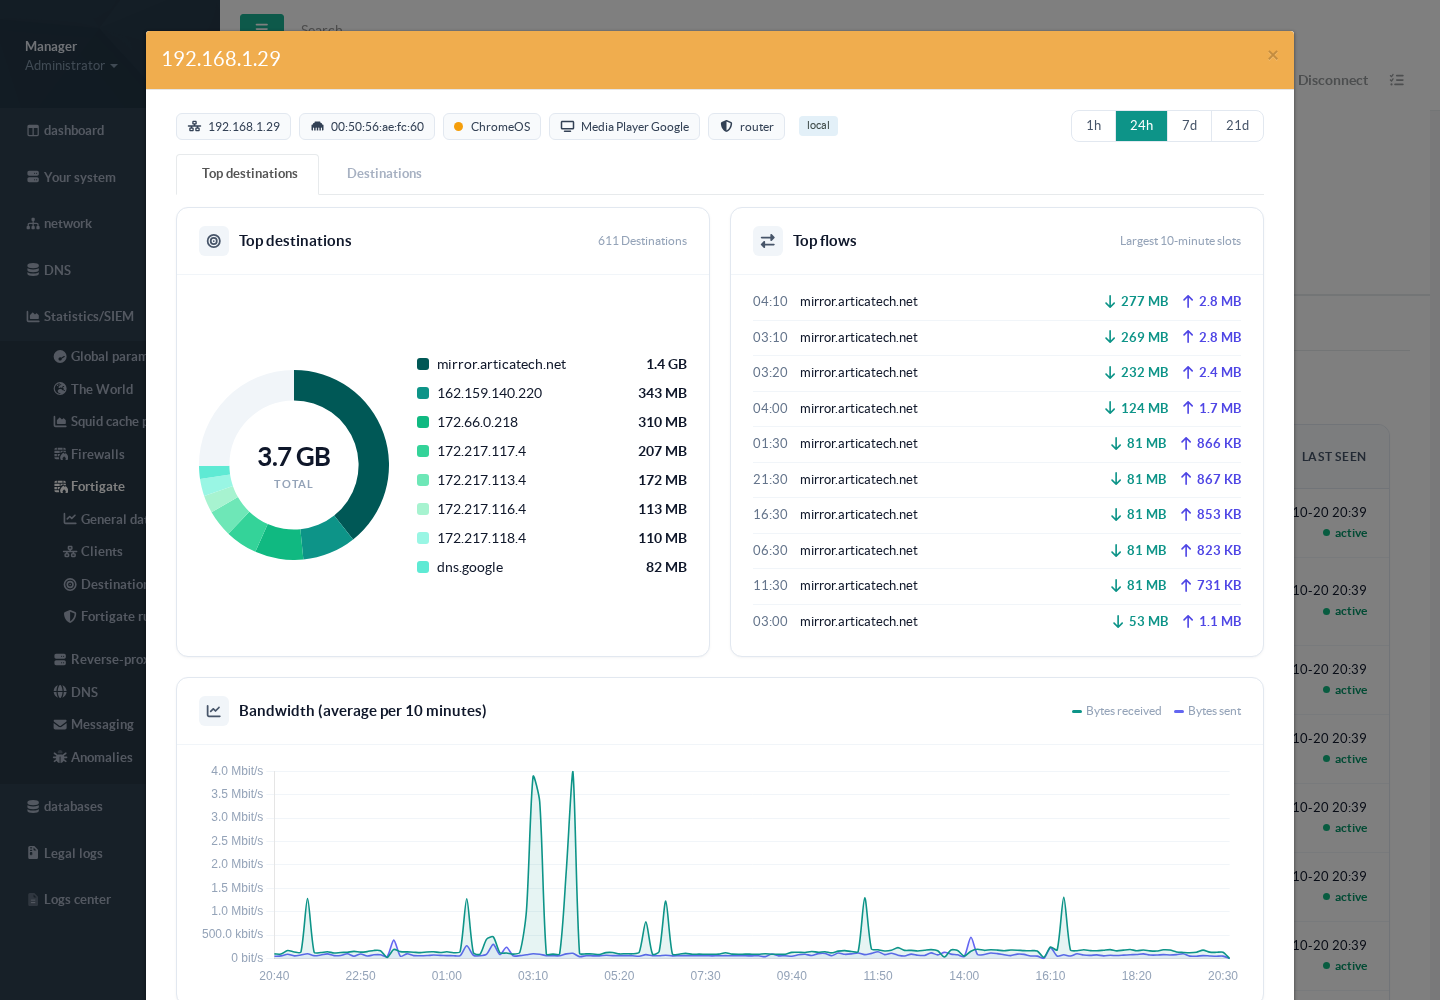
Client details: top destinations, largest flows and bandwidth.
The first tab shows the top destinations, the largest 10-minute transfers and the bandwidth curve in bit/s (the average over each 10-minute slice). The second tab lists every destination with the data received and sent, the share and the first and last time seen.
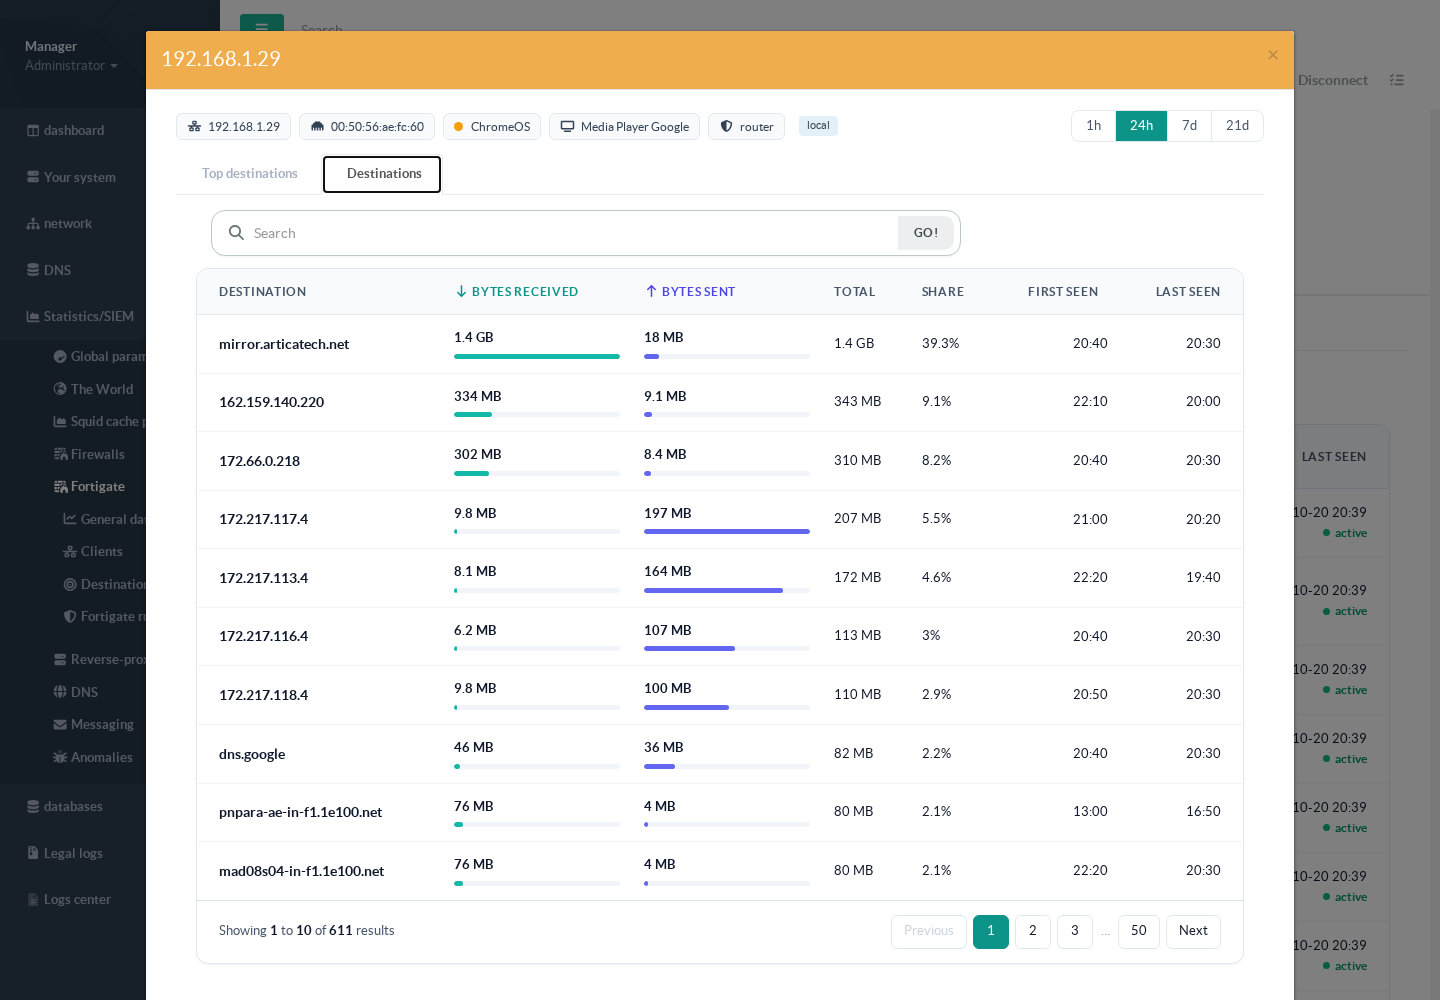
Every destination of a client.