« Back to the Reverse-proxy section
HotLogs is a targeted search & diagnostics engine that runs directly over the reverse-proxy’s per-site access logs.
Instead of grepping raw log files on the server, an administrator builds a filtered search from the WebConsole, and the daemon scans a rolling “hot” buffer of the recent traffic, then returns an interactive report (charts + the matching requests) plus a CSV export.
HotLogs never touches the live request path.
Every access-log line is streamed, hour by hour, into a compressed buffer kept for a configurable number of days (7 by default).
Searches run asynchronously against that buffer, so even a busy production site is never slowed down by a diagnostic query.This feature is available on Artica v4.50 Service Pack 7 or Artica v4.50 Service Pack 6 Hotfix 20260709-00
¶ Why use it
- No SSH, no grep.
Investigate incidents from the WebConsole — no shell access to the proxy, no need to know where the log files live or how they rotate.
- Zero impact on production.
The buffer is written asynchronously off the request hot path, and searches run in a background worker.
A heavy query cannot degrade live traffic.
- Fast, scoped scans.
Logs are partitioned per site, per day, per hour.
Filtering by site and time range means the engine opens only the handful of files that matter instead of scanning everything.
- Exact statistics, even on huge result sets.
Charts are computed over every matching request; only the first rows are materialised for the on-screen table, so the numbers are never truncated.
- Reusable, shareable investigations.
Each search is saved with its filters, progress and a full report. Re-open it later, re-run it, or hand it to a colleague — no need to reconstruct the query.
- One-click export.
The matching requests download as CSV for a spreadsheet, a ticket attachment, or further offline analysis.
- Powerful filtering.
Combine site, HTTP status code, URL path, source IP and time range — with wildcards (*), CIDR ranges, and full regular expressions.
¶ Typical use cases
- “Who is hitting
/wp-admin?” —
filter one site by URL path to surface probing or brute-force attempts, then read the Top source IPs chart to identify the offenders.
- Triage a spike of 5xx errors.
Filter by500,502,503over the last hour to see which paths and backends are failing and how the error rate evolves on the timeline.
- Investigate a single client’s complaint.
Filter by the customer’s source IP (or CIDR) to reconstruct exactly what they requested, with per-request status, size and backend latency.
- Find slow endpoints.
The Average upstream latency chart highlights when a backend started responding slowly;
Cross-reference with Top paths to pinpoint the endpoint.
- Bandwidth / abuse analysis.
The Bandwidth chart and the per-request byte column reveal which paths or clients consume the most traffic.
- Post-incident evidence.
Save the search and export the matching requests to CSV as an audit trail attached to the incident ticket.
¶ How it works
- Hourly buffer.
As each request is logged, the line is copied into a per-site, per-hour gzip file under the backup directory . Files older than the retention window are purged automatically. - Search. When you create a search, it is queued and processed by a single background worker: the engine selects only the files covering the requested sites and time range, scans them, applies your filters, and records progress from 0 to 100 %.
- Report. While scanning, the engine builds the chart aggregates over all matches and materialises the first matching requests for the on-screen table. Both are stored so the report opens instantly afterwards.
¶ Creating a search
- Open
Web Services > Monitoring > HotLogs, then click New search. - Give the search a name and set any combination of the filters below (leave a field empty to ignore it), then click Add.
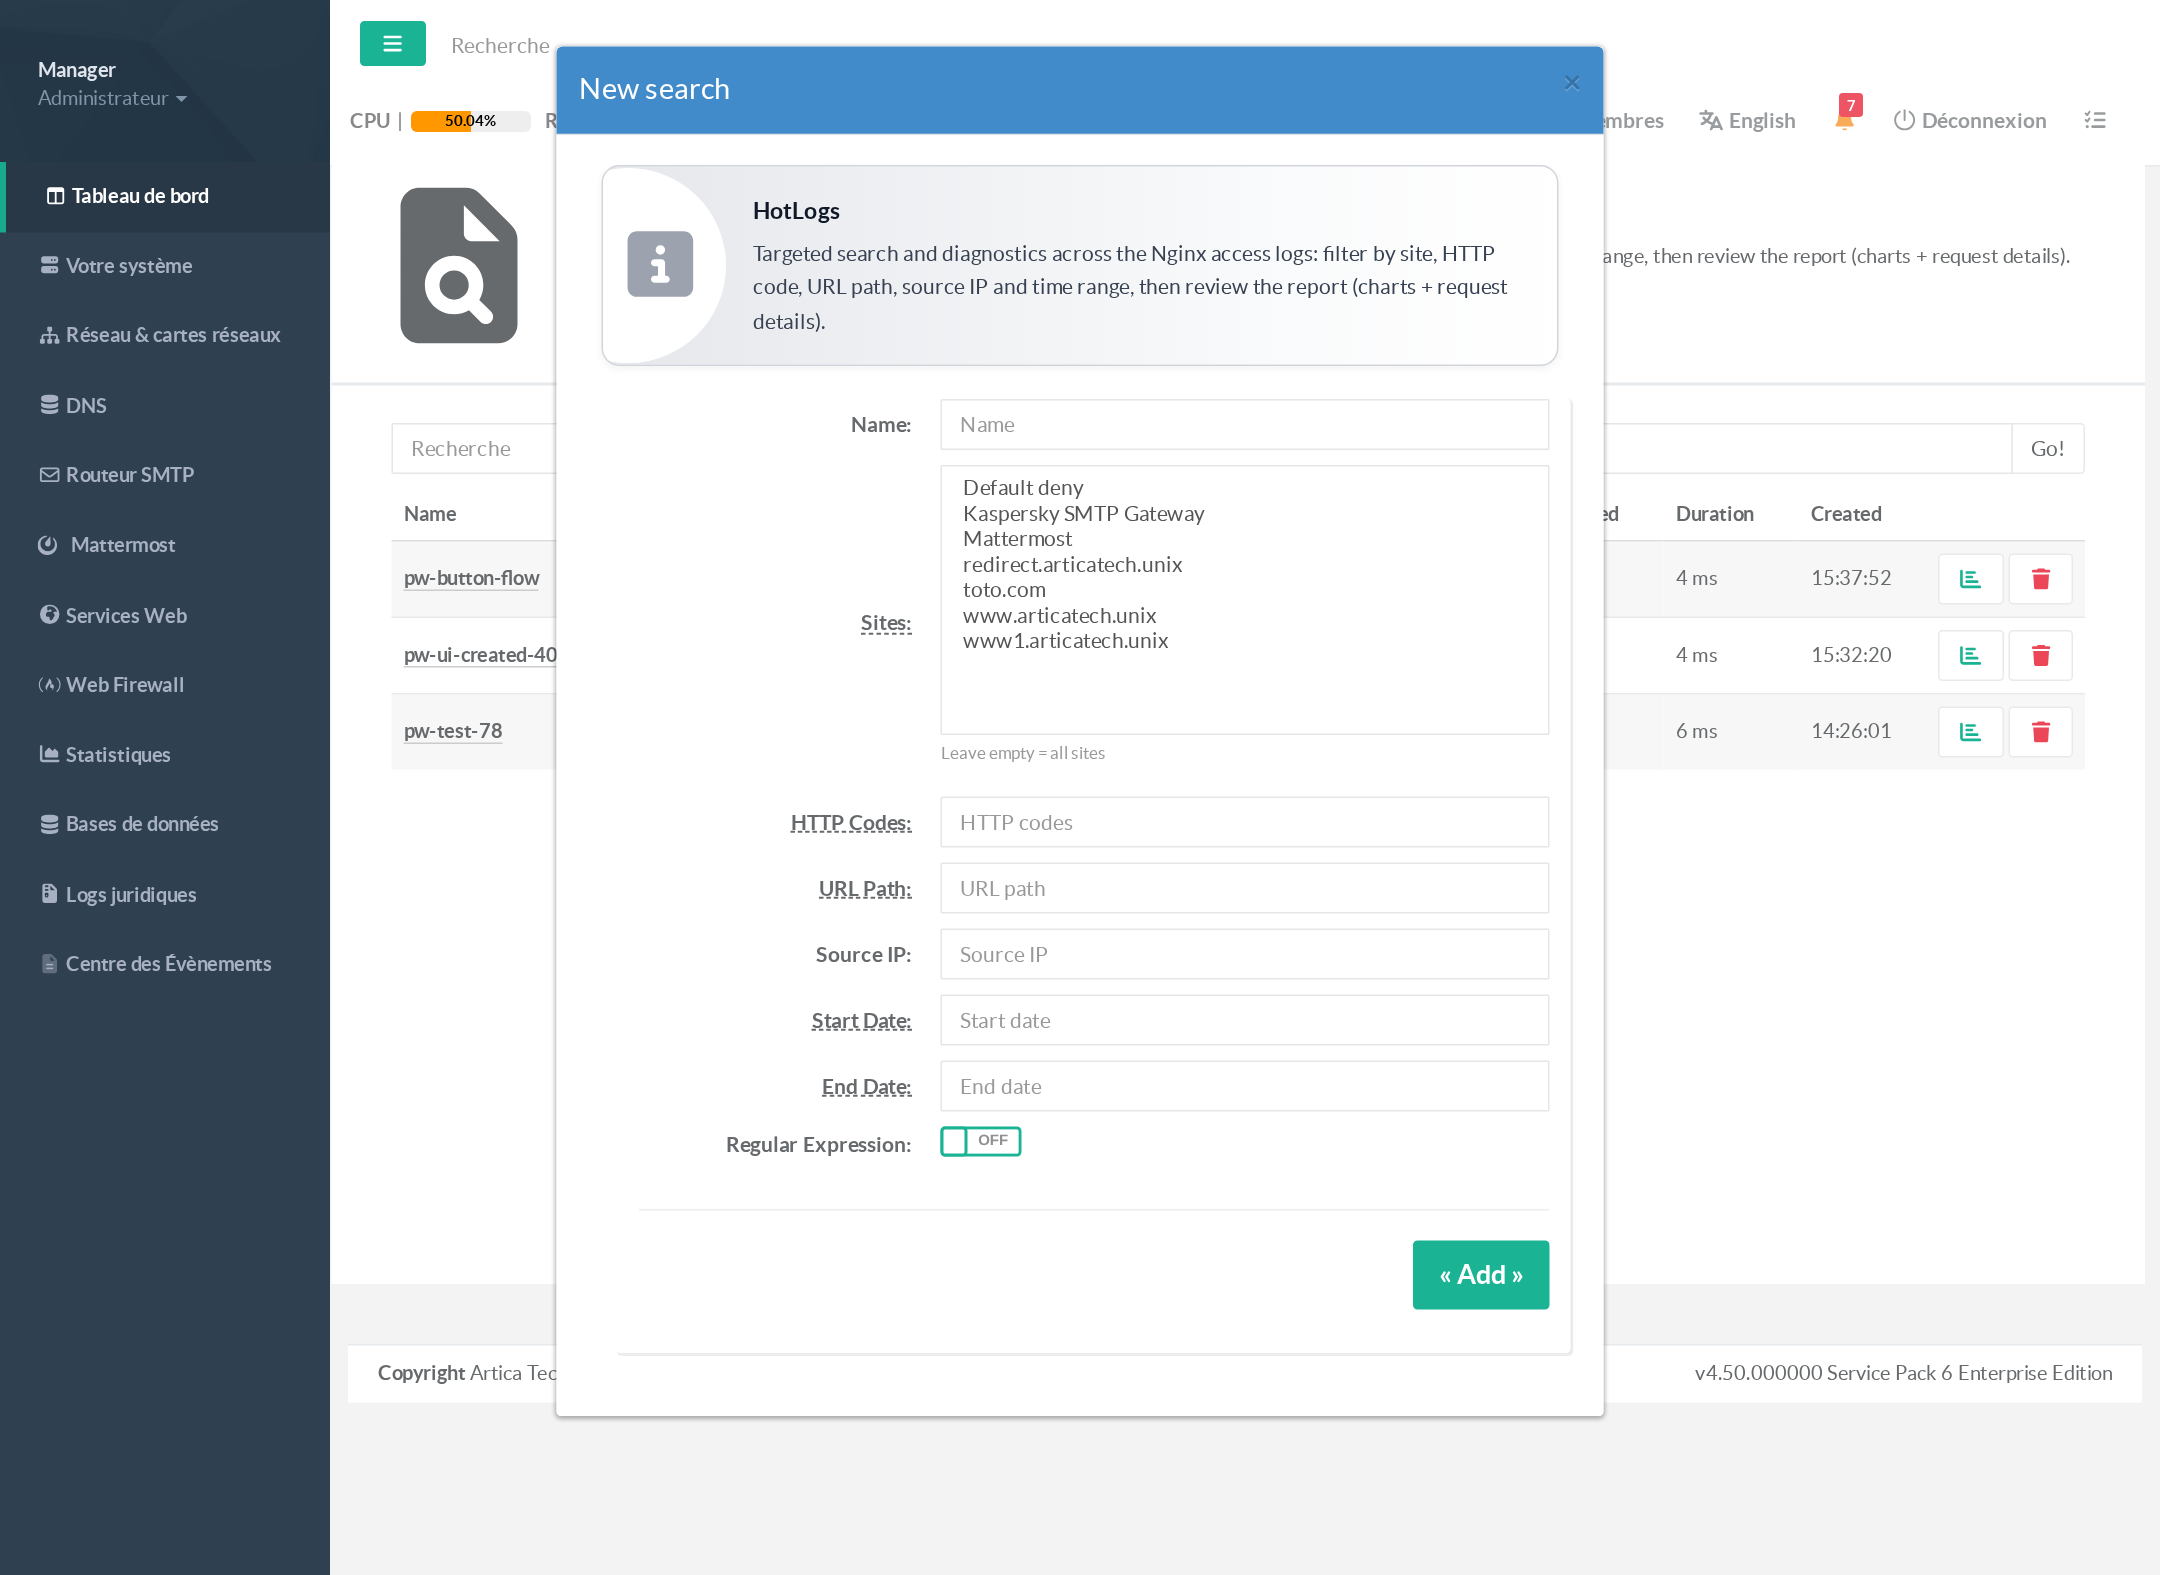
| Filter | Accepts | Examples |
|---|---|---|
| Sites | One or more sites. Empty = all sites. | — |
| HTTP Codes | Exact codes and/or classes, comma-separated. * = all. |
404,500 5xx * |
| URL Path | Substring, a * wildcard, or a full regular expression. |
/wp-admin /img/*.png |
| Source IP | An exact IP, a CIDR range, a * wildcard, or a regular expression. |
203.0.113.7 10.0.0.0/8 |
| Start / End Date | Time range. Leave empty to search the entire retention window. | 2026-07-09 |
| Regular Expression | When ON, URL Path and Source IP are treated as regular expressions. | — |
Tip: leaving the date fields empty searches the whole retention window (the default). Narrowing the site and time range makes a search dramatically faster on high-traffic proxies.
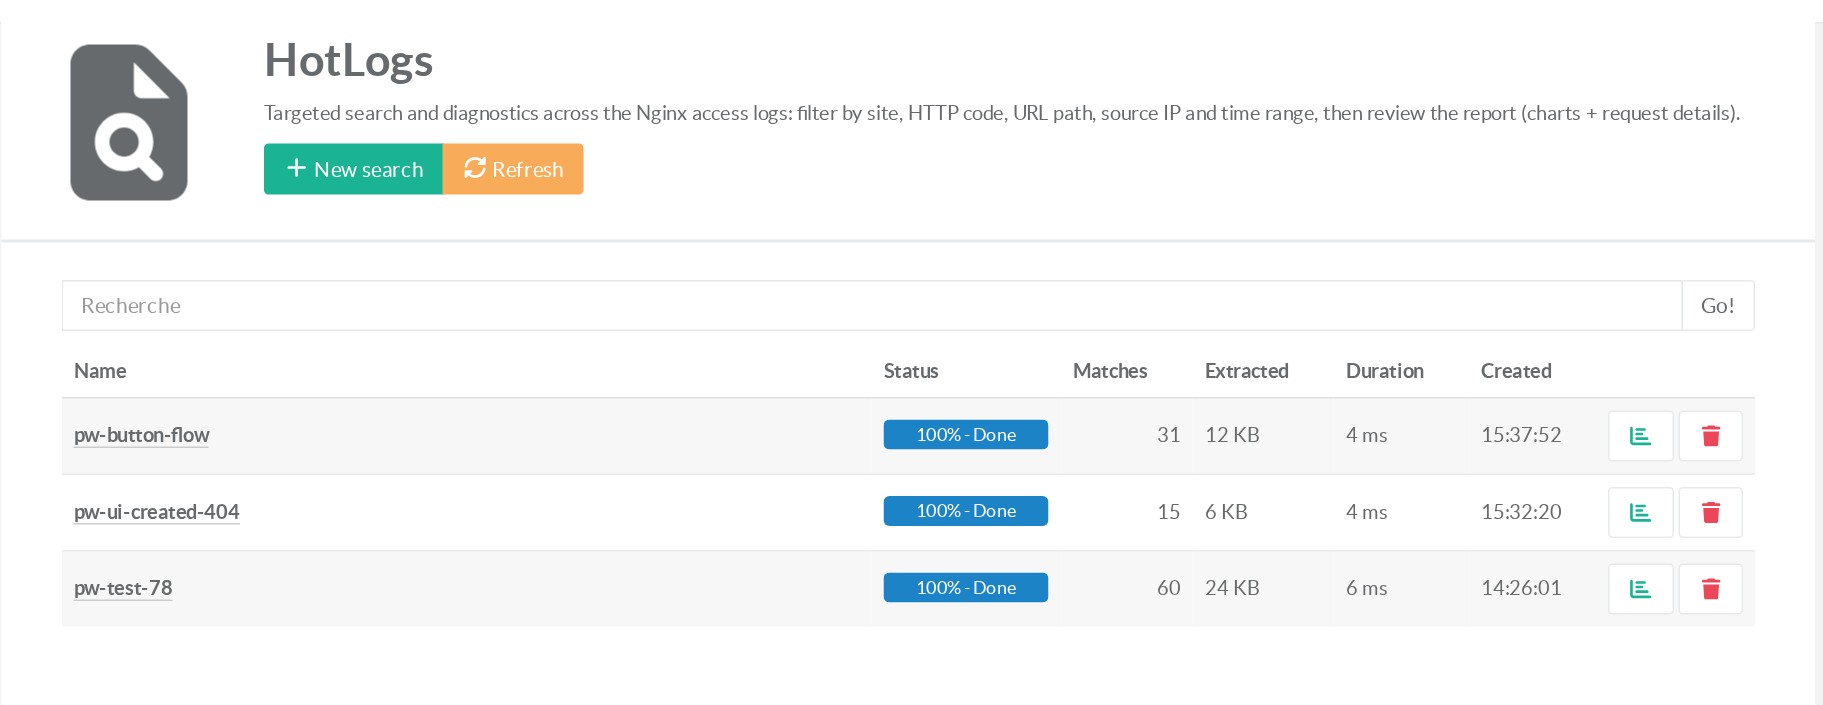
The new search appears in the list with a live progress bar. When it reaches 100 % — Done, the columns show how many requests matched (Matches), how much data was extracted, and how long the scan took. Click the report icon at the end of the row to open the report.
¶ Reading the report
The report opens in a modal with two tabs.
¶ Statistics
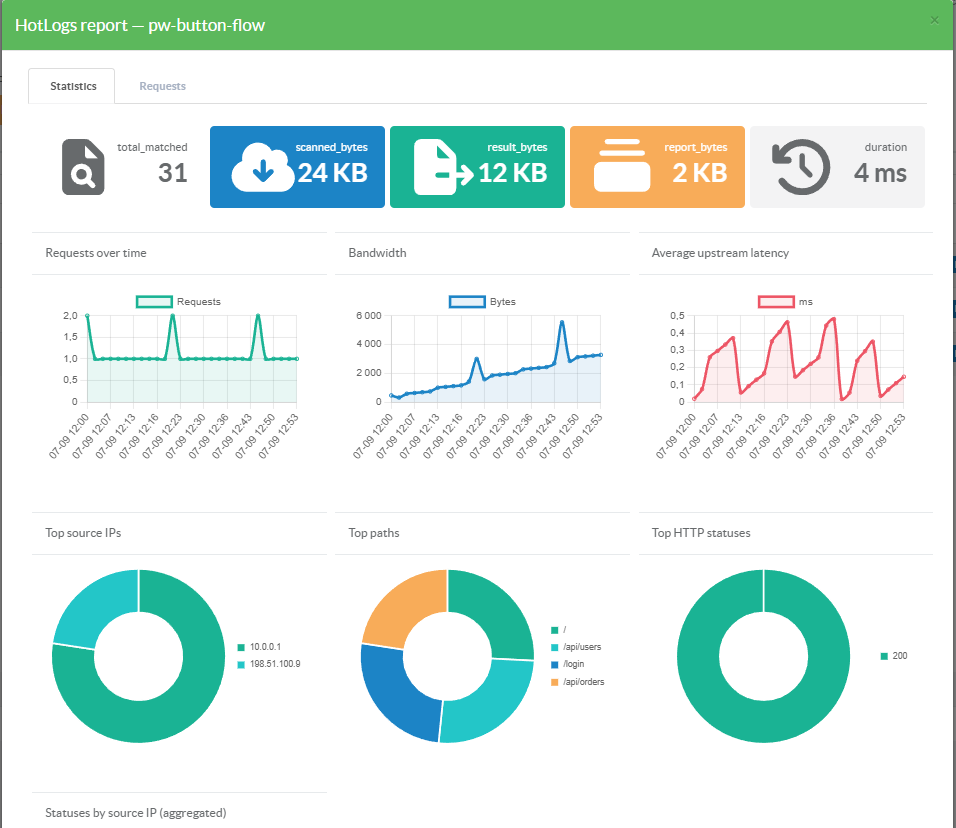
A summary row (total matches, bytes scanned, bytes extracted, report size, duration) followed by seven charts computed over all matching requests: requests over time, bandwidth, average upstream latency, top source IPs, top paths, top HTTP statuses, and statuses aggregated by source IP.
¶ Requests
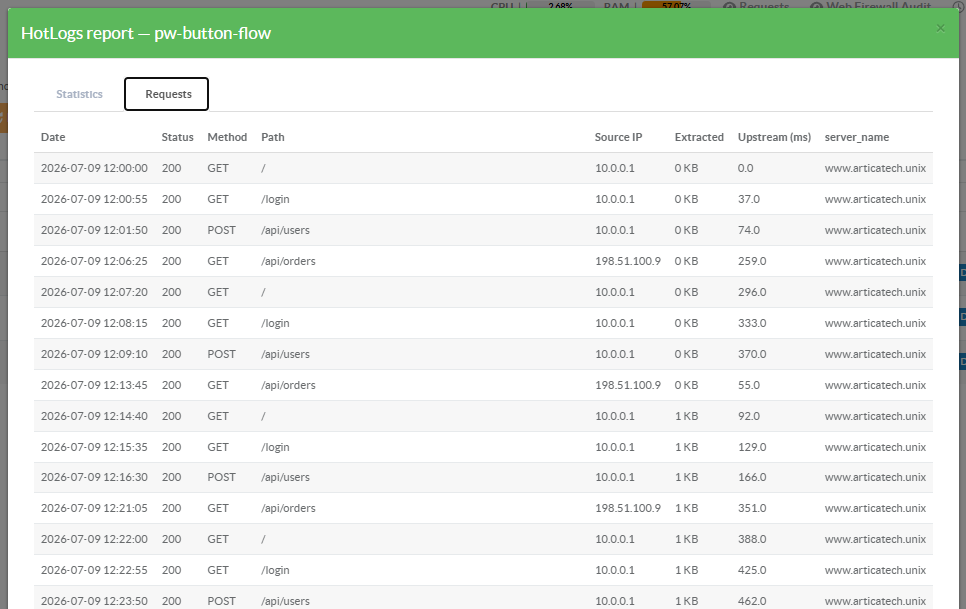
The matching requests, paginated, with date, status, method, path, source IP, bytes and backend latency. If the result set is larger than the storage cap, a banner shows how many of the total matches are displayed. Use Export CSV to download the full stored set.
¶ Behind a front proxy or load balancer
When the reverse proxy receives its traffic through another proxy (load balancer, CDN, cloud WAF, or a front Nginx that terminates IPv6), every request comes from that proxy's address and HotLogs shows it on every line.
Enable Client address from X-Forwarded-For (Parameters button of the HotLogs page) to search and chart the real client addresses instead.
¶ Retention & settings
HotLogs is controlled by a few settings.
Defaults are sensible for most deployments.
| Setting | Default | Purpose |
|---|---|---|
ReverseSearchLogsEnabled |
1 (on) | Enables the hourly buffer capture. |
ReverseSearchLogsMaxDay |
7 | How many days of logs are kept in the hot buffer. |
ReverseSearchLogsMaxRows |
100000 | Maximum matching requests materialised per search (charts still count all matches). |
BackupMaxDaysDir |
/home/logrotate_backup | Root directory; the buffer lives under <dir>/HotLogs. |
ReverseSearchLogsTrustXFF |
0 (off) | Use the client address from X-Forwarded-For — see Client address from X-Forwarded-For. |
Retention is the size guardrail: older day-folders are pruned automatically every hour, so the buffer never grows without bound. A search over the default 7-day window with no date filter therefore covers everything currently retained.