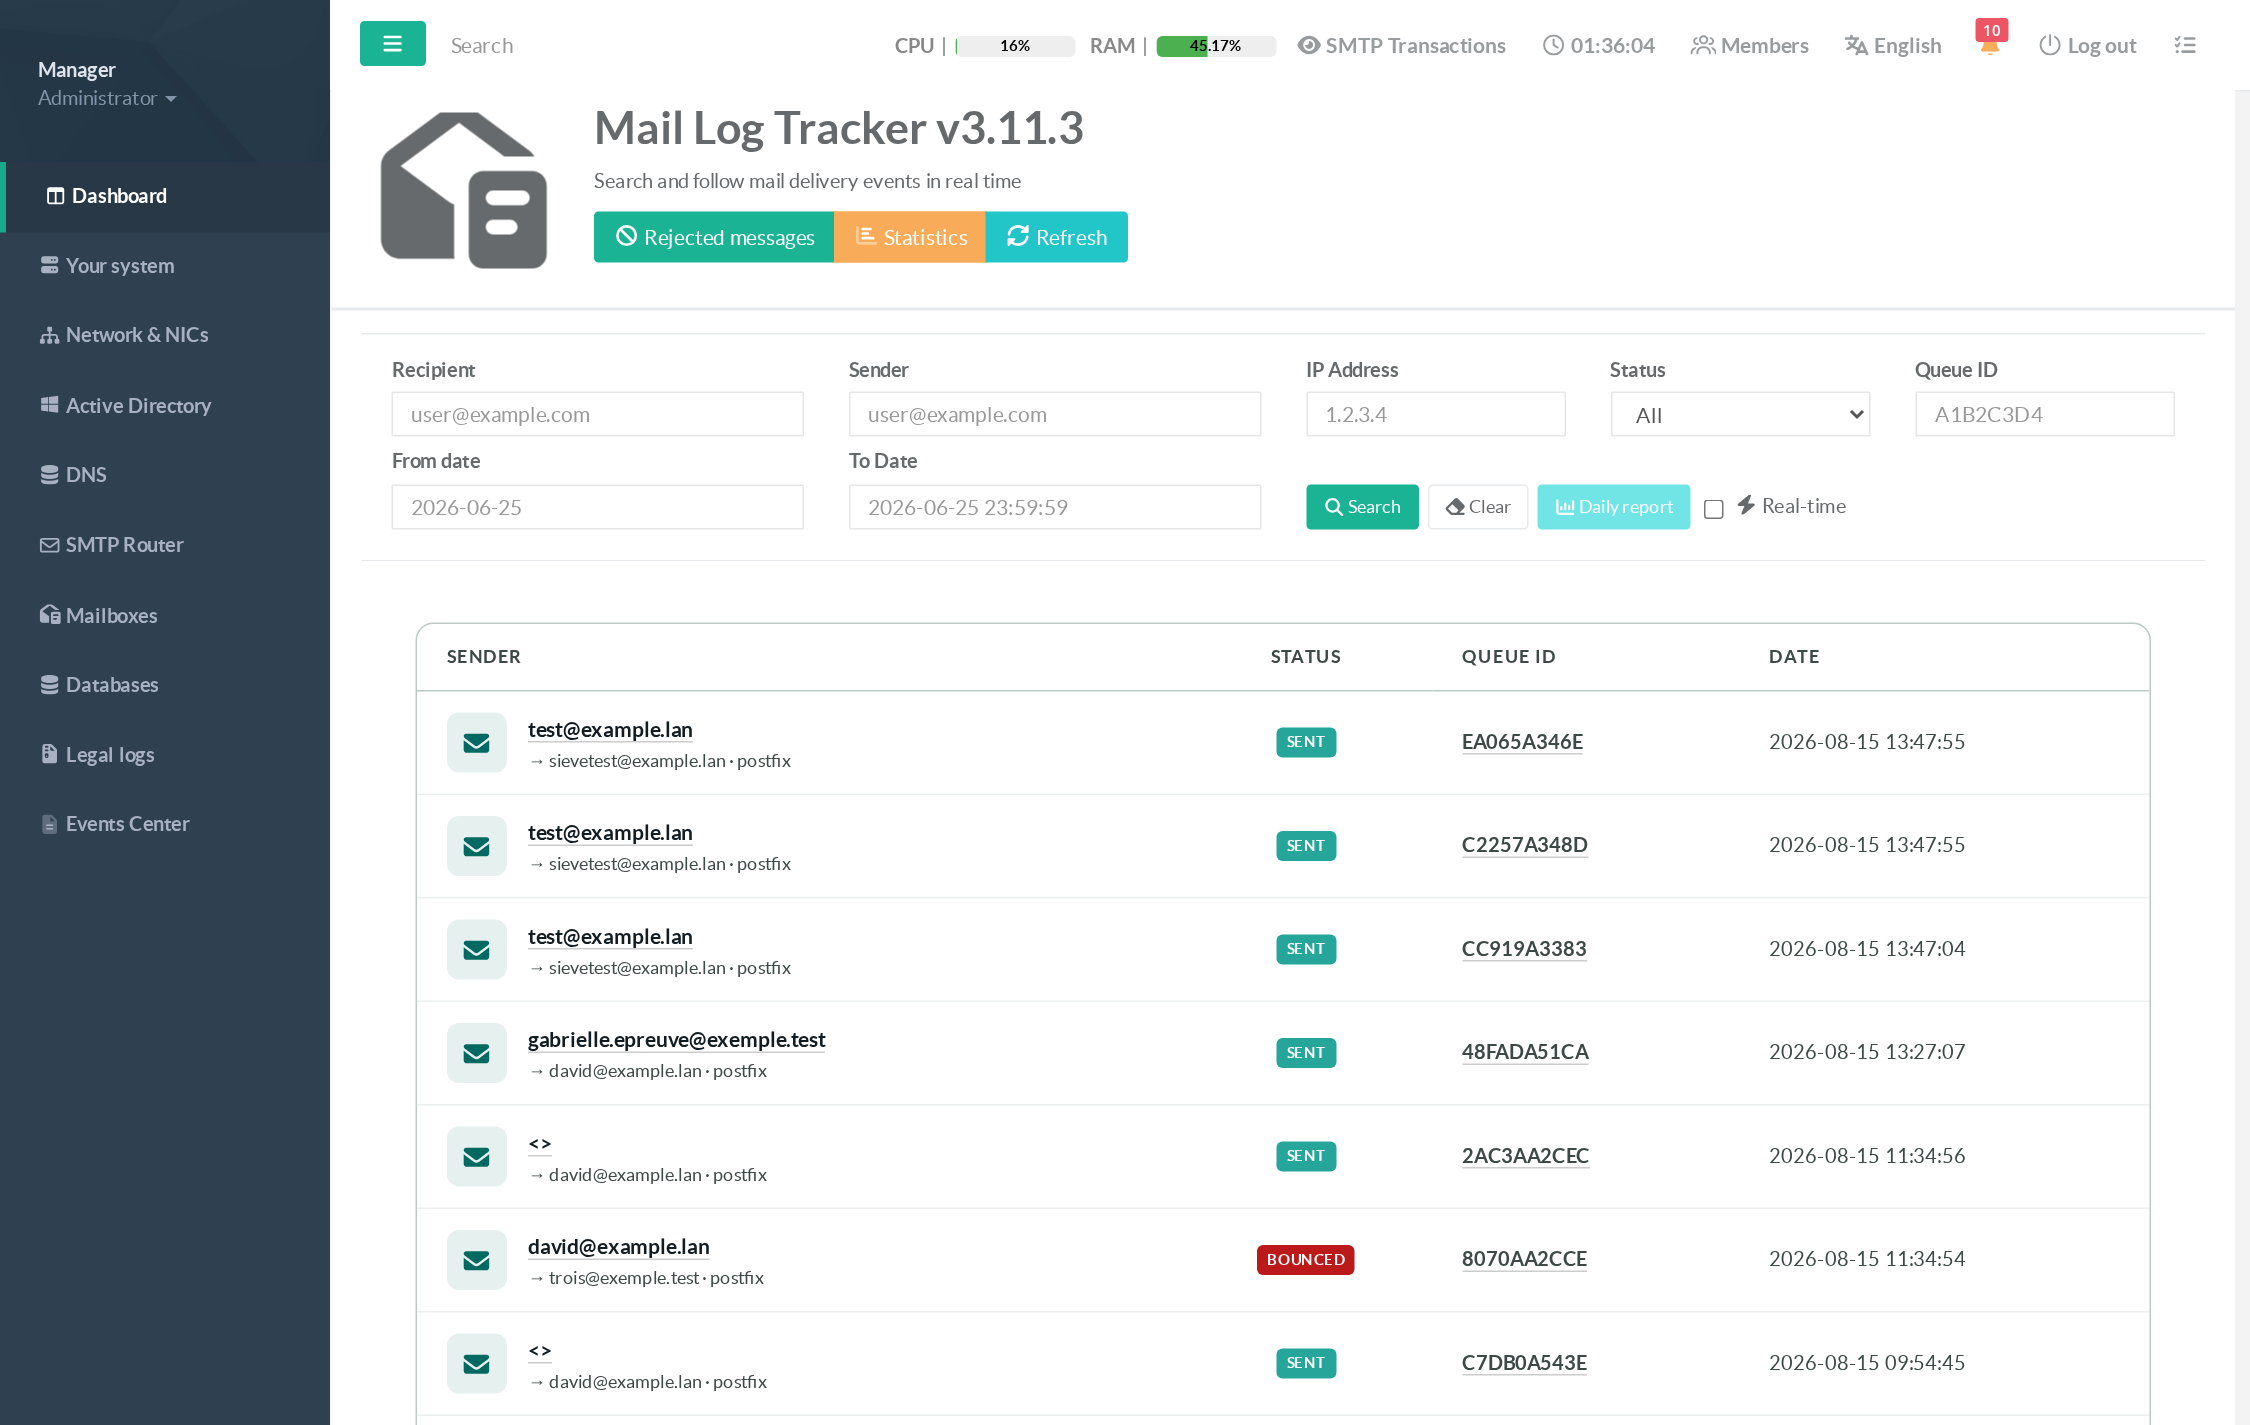
The Mail Log Tracker answers the question an administrator is asked several times a week: « what happened to that message? ».
It turns the Postfix mail log into a searchable database of mail transactions, so a delivery can be found by recipient, sender, client IP, queue ID or date — and its complete story displayed in one click.
¶ Why it matters
Postfix does not write one line per message.
It writes one line per event, scattered across the log by several processes (smtpd, cleanup, qmgr, smtp, lmtp, bounce…), interleaved with every other message being processed at the same instant.
Reconstructing a single delivery by hand means grepping a queue ID you do not know yet, then reading dozens of unrelated lines around it.
- One message = one record.
Events are correlated by queue ID into a single transaction with a status, a sender, its recipients and a timeline.
You search for what you know (an address, an IP, a date) instead of for a queue ID you have to find first.
- Rejected mail is visible too.
A message refused during the SMTP session never gets a queue ID and never reaches the queue — it is logged asNOQUEUE.
Grep-based tooling routinely misses it, which is exactly why « I sent it and nothing happened » investigations stall.
The tracker surfaces those rejections next to the delivered mail.
- No shell access required.
The investigation can be delegated to a helpdesk operator or an auditor through the web console, with no login on the mail server and no read access to the raw logs.
- It reads a database, not a file.
Searching six weeks of history does not mean decompressing rotated log files; and the log is consumed as it is written, so the answer is available immediately.
- Multi-instance aware.
When a message is re-injected from one Postfix instance into another, both legs are linked and shown as one chain instead of two unrelated transactions.
¶ Where to find it
In the left menu: SMTP Router > your SMTP instance > Mail Log Tracker.
Each instance has its own entry; the page always works on the instance it was opened for.
¶ Searching

All filters are combined with a logical AND: filling several of them narrows the result, it never widens it.
| Recipient | Full recipient address. Matches the envelope recipient, not the To: header. |
| Sender | Full envelope sender address. |
| IP Address | The IP address of the client that submitted the message. |
| Status | All, Sent, Deferred or Bounced. |
| Queue ID | The Postfix queue identifier, when you already have it (from a bounce message, for instance). |
| From date / To Date | YYYY-MM-DD or YYYY-MM-DD HH:MM:SS. Leaving both empty searches the whole retained history. |
Search runs the query, Clear empties every field, and Daily report aggregates the current filters into a report with charts — see The Daily report.
¶ Reading the results
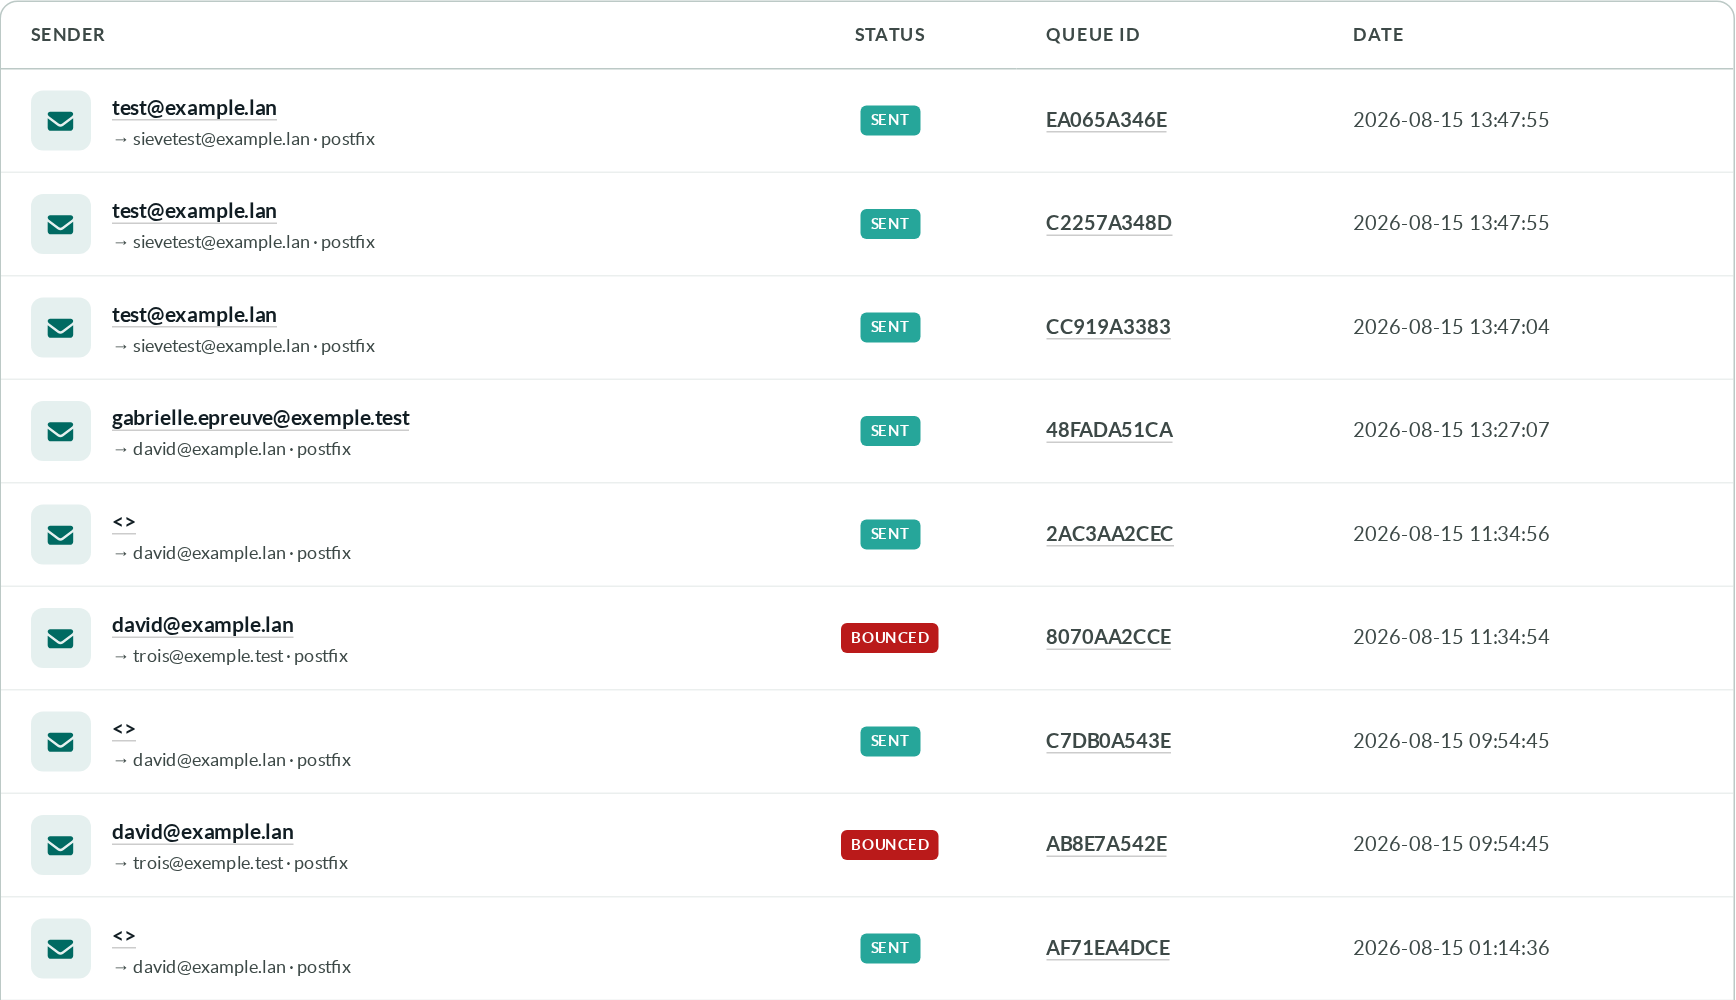
Each row is one message.
The sender is the identity line; the recipient, the instance name and the client IP appear underneath.
When a message has several recipients, the first one is shown followed by a +n tag.
- SENT
The remote server accepted the message.
This is a delivery receipt from the next hop, not a guarantee that the user saw it in their inbox.
- DEFERRED
Delivery failed temporarily and Postfix will retry.
Normal for a few hours; a concern if it lasts.
- BOUNCED
Delivery failed permanently and a non-delivery report was returned to the sender.
- EXPIRED
The message stayed in the queue past the maximal lifetime and was returned.
A sender shown as
<>is not a missing value.
It is the null sender defined by RFC 5321, the envelope sender that every bounce and delivery-status notification carries by design — precisely so that a failed notification cannot bounce in turn and start a loop. Rows with<>are the notifications your own server generated.
¶ The message card
Clicking the sender or the queue ID opens the full record.
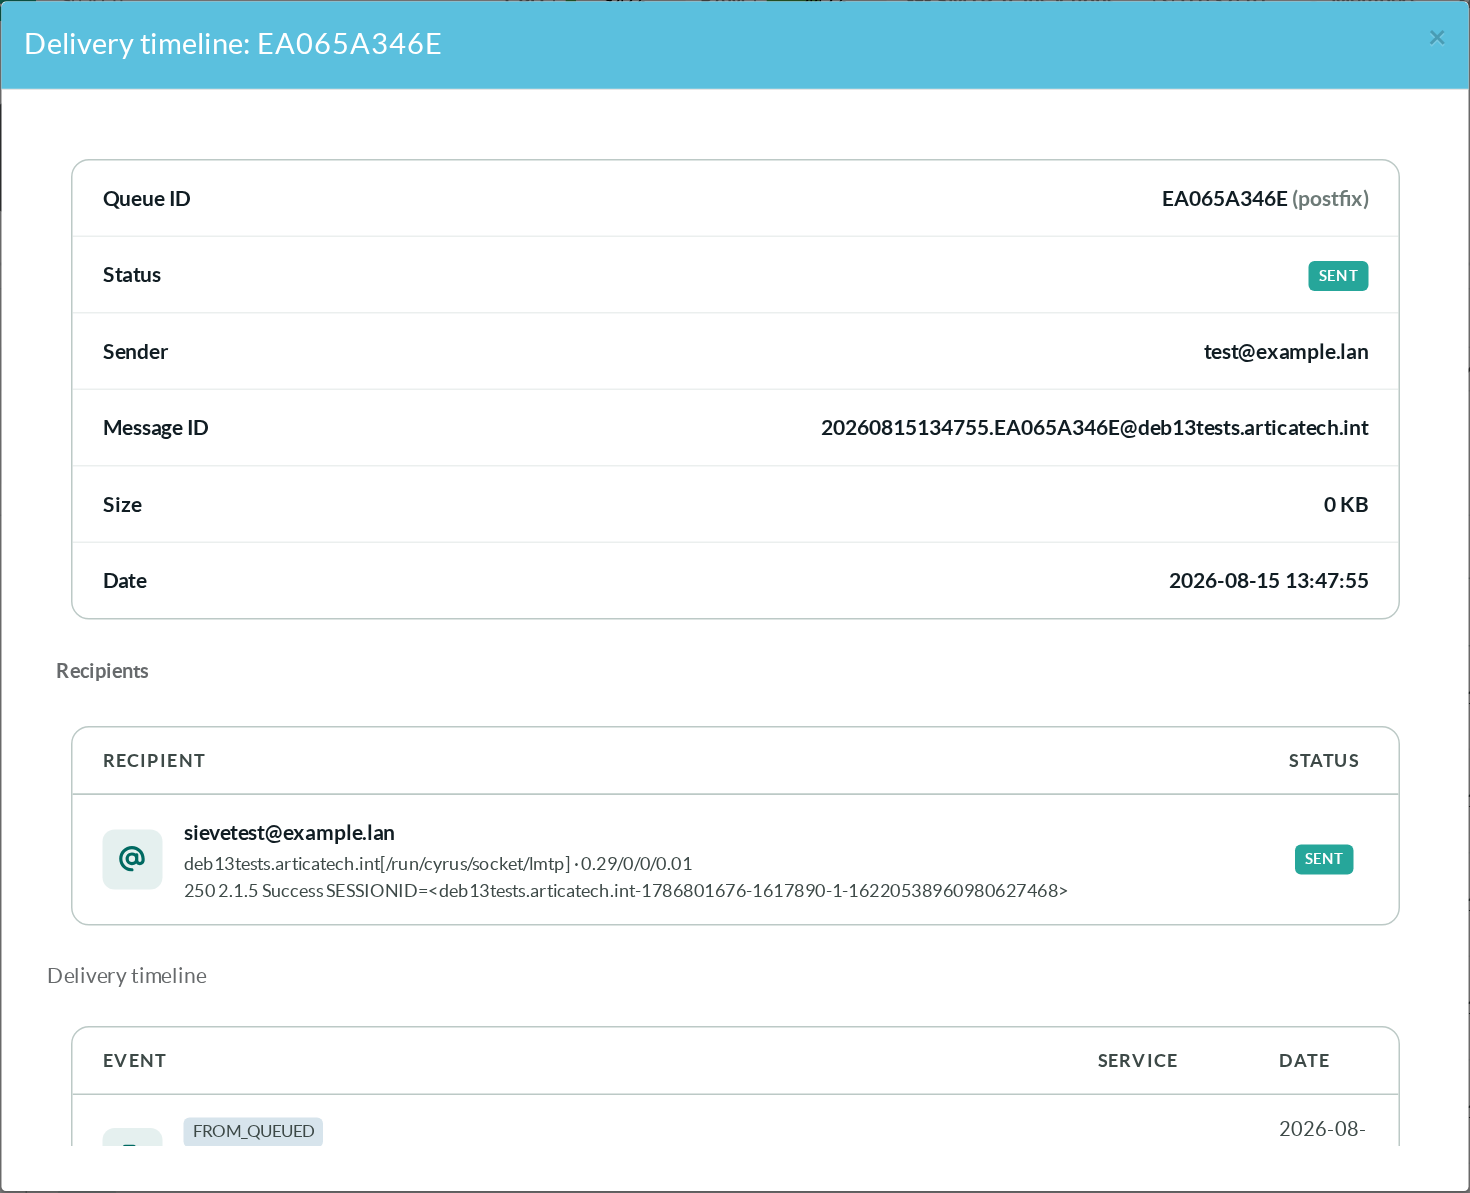
- Identity
Queue ID and instance, status, sender,Message-ID, size, authenticated user when the client used SMTP AUTH, and client IP with its reverse name.
- Recipients
One line per recipient with its own status, the relay that accepted or refused it, the delay breakdown, and the remote server's own answer.
That last field is the one that ends most discussions: it is the destination's wording, not ours.
- Re-injection chain
Shown when the message travelled through more than one instance, with the direction and the linked queue ID.
- Delivery timeline
Every event in order, with the process that emitted it and the raw log line.
Nothing is hidden or reworded: what Postfix wrote is what you read.
¶ Rejected messages
The Rejected messages button lists the NOQUEUE events matching the same filters — connections refused during the SMTP session, before the message was ever queued.
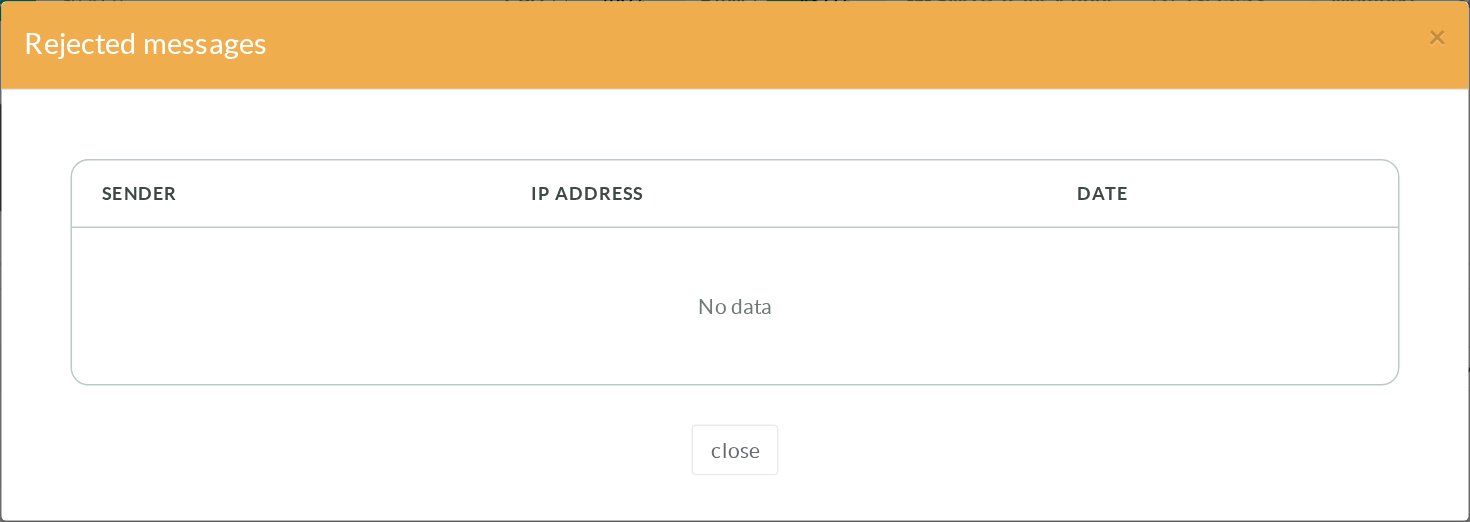
Each line gives the sender, the intended recipient, the client IP and, in red, the reason Postfix returned to the client:
- a blocklist hit
- a failed recipient check
- a milter verdict
- a rate limit.
This is where you confirm whether a sender who claims to have written to you was in fact turned away at the door, and by which rule.
Rejections matching the current search are also shown directly under the result table, so a recipient search is never silently empty when all of that recipient's mail is being refused.
¶ Real-time mode
Ticking Real-time refreshes the result list every three seconds with the current filters.
Set a filter first — on a busy relay the unfiltered feed scrolls faster than it can be read.
It is the mode to use while asking a user to send a test message, or while watching a newly changed rule take effect.
¶ Tracker health
The Statistics button reports the state of the collector itself.
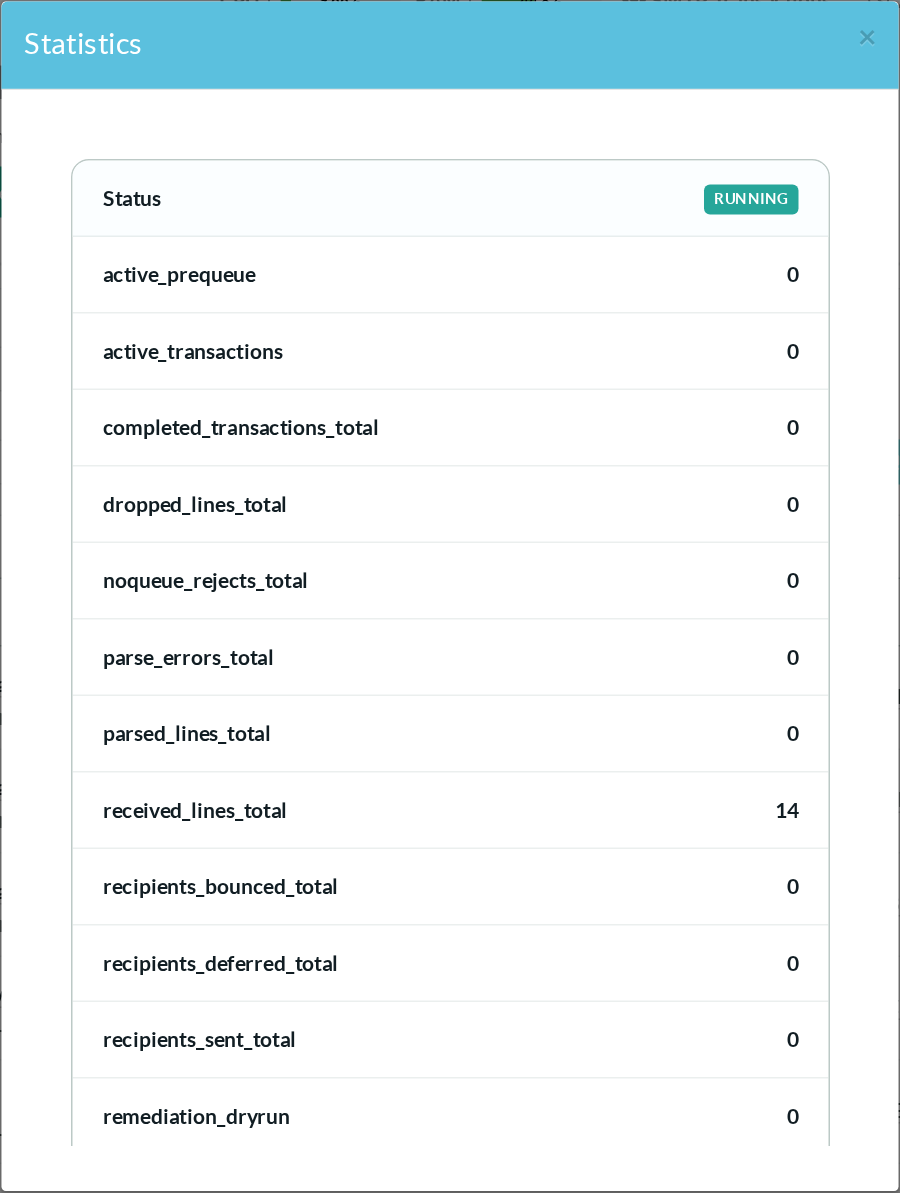
It tells you whether the tracker is running and how many lines it has parsed, correlated, stored — and dropped.
Ingestion never blocks mail delivery: under an extreme burst the tracker discards events rather than slow Postfix down, and counts what it discarded.
A non-zero drop counter therefore means the view of that period is incomplete, and it is worth knowing before drawing conclusions from it.
¶ Typical use cases
- « I never received the invoice. » Search the recipient over the day in question.
Either the message is there with the remote server's acceptance — and the problem is on their side, with the exact wording to quote — or it never arrived, and the sender must be asked to check their own outbound path.
- « My mail to that customer bounces. »
Search the recipient, open the card, read the destination's answer.
Greylisting, a full mailbox, an SPF failure and a blocklist hit all read differently — and call for different actions.
- A compromised account sending spam.
Filter on the client IP or the sender: the volume, the destinations and the authenticated user appear at once.
The messages already queued can then be dealt with from the queue manager.
- Checking a rule you just changed.
Turn on real-time mode with a filter on the test address, send a message, watch it flow — or watch it be refused, with the reason.
- Answering an audit.
Prove that a given message was accepted, at what time, from which IP, by which relay, with the raw log lines as evidence.
- Investigating an outage after the fact.
Filter on the time window and the status Deferred to see what could not go out, and towards which relays.
¶ Requirements and notes
- The tracker is enabled by default.
It receives Postfix log lines through a dedicated rsyslog rule installed and repaired automatically by the Artica daemon, and stores transactions in the appliance statistics database. - It reads mail metadata only
Envelope, status, timing, log lines. Message bodies, subjects and attachments are never read, stored or displayed. - Only what was logged after the tracker was enabled is searchable:
it is a collector, not a log importer. - The result table shows the most recent 200 matching messages.
When the answer to your question is a volume rather than a list,
use the Daily report, which aggregates the whole period in the database instead of counting displayed rows.