When Artica is in charge of a service (Reverse-Proxy, Proxy, databases..) , it monitors the entire health (CPU, memory, file descriptors, I/O flows, network).
The Service Wep API lets you publish all this information via a json.
This JSON can then be used by the Nagios server.
This API is added on Artica v4.50 Service Pack 1 and Hotfix 20250226-22
- Open the Web API service to your Nagios server
By default, the Web API service only listens to a local Unix socket, so you need to open it on a network card and secure access to your Nagios server. - Understand the /system/monit/json API
This API allows you to retrieve information from all the services monitored by Artica.
¶ Example: Monitor the Proxy service CPU percentage
According to /system/monit/json API the main key of the proxy service is APP_SQUID.
the root for the CPU value ( in percentage ) is Services > APP_SQUID > Memory > Percent for the memory usage and Services > APP_SQUID > CPU > Percent for the CPU percentage
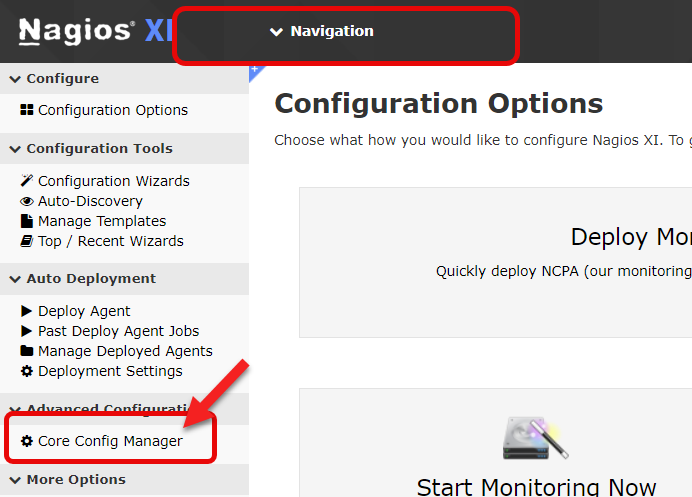
On the nagios server go to Configure and on the left menu, go to Advanced configuration > Core Config Manager
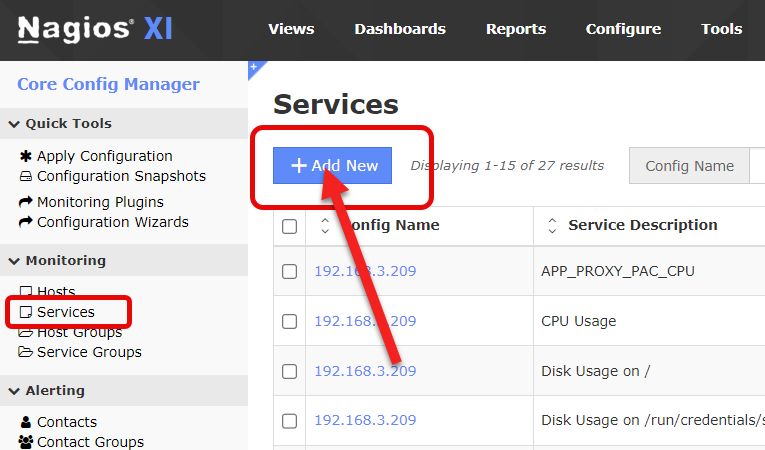
- On the left menu, under “
Monitoring”, click on “Services” sub-menu and click on Add New
- On the right pan, under check command, choose “
check_json”
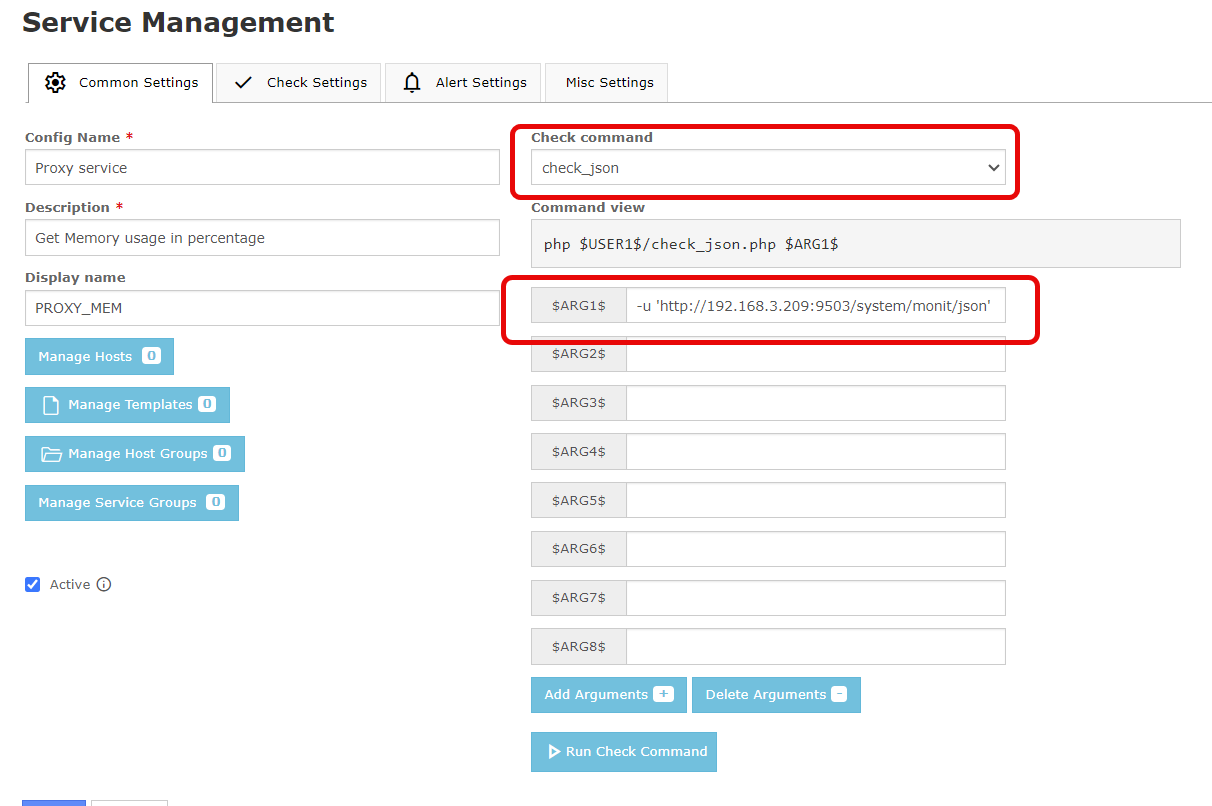
- on the
$ARG1$, type
-u 'http://1.2.3.4:9503/system/monit/json' -k 'Services.APP_SQUID.Memory.Percent' -w 90 -c 95
- Where 1.2.3.4 is the IP of your Artica server, 9503 is the listen port of the Web API service.
- The
-kset the full root to the final key - the
-w 90is the lower alert value ( 90% of CPU ) and the-c 95is the max value for alert ( 95% )
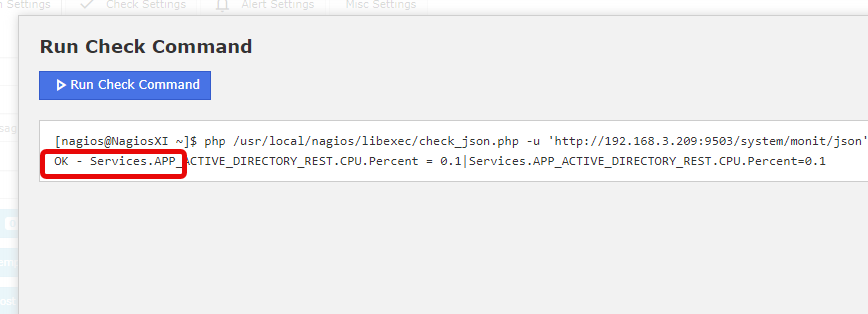
- use the Run Check command button to validate your query