Artica watches the Postfix mail queues of every instance and warns you — with evidence — when a queue stops draining.
It also repairs, on its own, the two things an appliance can repair, and keeps a history so you can tell a backlog that is growing from one that is merely large.
Everything described here lives on one page: SMTP Router > Queue
¶ The concept
A mail queue is not a problem in itself.
Postfix queues mail all the time: a remote server is busy, a DNS answer is slow, a greylist asks you to come back in five minutes.
The queue drains and nobody needs to know.
A queue becomes an incident when it stops draining — and there are two very different ways that happens:
- Saturation.
Mail arrives faster than the appliance can process it.
Theincomingqueue grows. - Delivery failure.
Mail cannot leave.
Thedeferredqueue grows, or it does not grow at all and simply holds the same few messages for days.
That second case is the one a simple counter misses.
A relay with a deferred limit of 500 will never alert on ten messages stuck for four days — and that is exactly the failure worth knowing about.
So the watchdog applies two independent rules.
| Rule | Applies to | Default | What it catches |
|---|---|---|---|
| Message count | every queue | 20 — and 500 for deferred |
saturation |
| Age of the oldest message | deferred only |
24 hours | delivery failure |
The two thresholds are deliberately separate.
A deferred backlog is normal on a relay and an incoming backlog never is; one value cannot serve both.
The age rule is restricted to deferred because the other queues drain in seconds, where an age would be noise rather than signal.
When both rules trip at the same moment you get one alert naming both causes, never two.
¶ What you actually receive
The alert is an Artica administration notification — not an e-mail. On an appliance whose mail queue is precisely the thing that is stuck, an e-mail alert has every chance of never leaving.
The body carries what you need to decide, without opening anything else:
Instance : master (0)Queue : deferredMessages : 48 (threshold 10)Oldest : 3h 12m (limit 1d 0h)Cause : countOther queues : incoming=0 active=0 hold=0 maildrop=0 corrupt=0Top senders (10 max) 30 billing@example.lan 18 monitoring@example.lanTop destination domains (10 max) 30 [10.255.255.2] 18 [10.255.255.3]Top delay reasons (10 max) 48 connect to 10.255.255.2:25: Connection timed outActions taken this pass corrupt recovered : 0 flush requested : no
Three properties of that report are worth knowing:
- Senders appear as full addresses.
The sender is normally a local account of your appliance, and knowing which account is filling a queue is the single most actionable fact in the report. - Recipients appear as domains only.
No recipient address is ever written to a notification, to a log, to the statistics store or to the metrics endpoint.
Message subjects, headers and bodies are never read. - Every breakdown is capped at 10 entries, and the report says when it truncated
With the real number of distinct values it saw.
A bounded report that does not admit it is bounded reads as a complete one.
¶ How often you are told
Two independent settings govern this, and confusing them is the usual source of alert fatigue:
- The surveillance interval decides how fast an incident is detected: 3, 5, 10 (default), 30 minutes, 1, 2 or 6 hours.
- The re-notification delay (30 minutes, not configurable) decides how often an ongoing incident is repeated.
Because they are independent, running at 3 minutes does not give you twenty times more alerts than running hourly for the same incident.
A queue that returns under both its threshold and its age limit clears its alert, so the next exceedance tells you immediately instead of waiting out the delay.
¶ The page
¶ Queue — the messages themselves
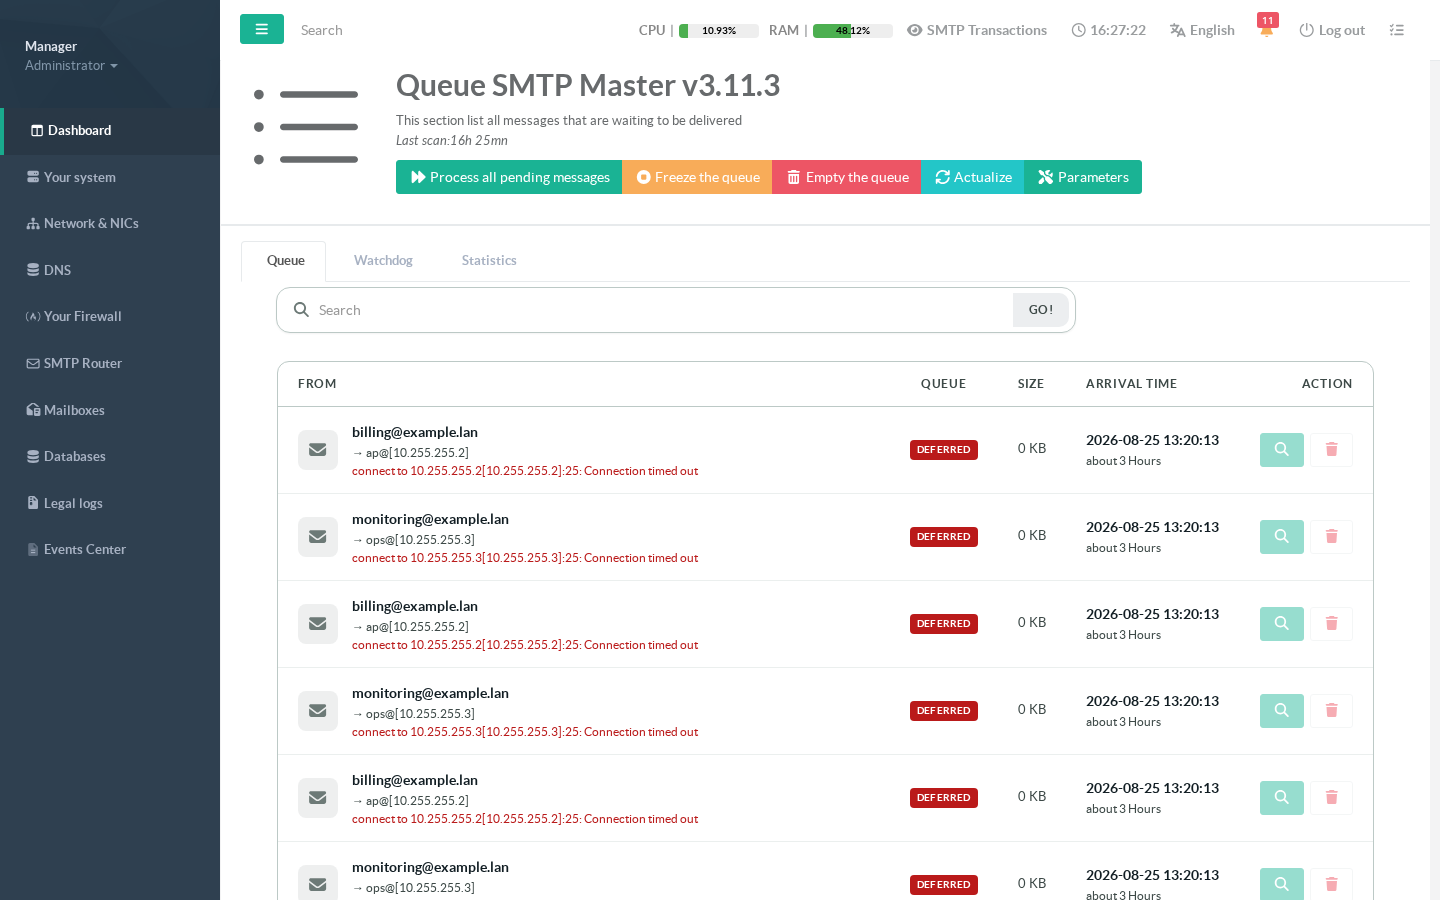
The first tab lists what is actually waiting, with the sender, the destination, the queue it sits in, its arrival time and the reason Postfix last gave for not delivering it.
You can inspect or delete an individual message from here.
¶ Watchdog — is it running, and is anything wrong
The widget on the left answers the first question anyone opens this page for.
It is green while the surveillance runs and no queue is in alert, and red the moment one is.
The card on the right carries the settings in force and the last measurement, queue by queue; a queue in alert is shown in red with its cause.
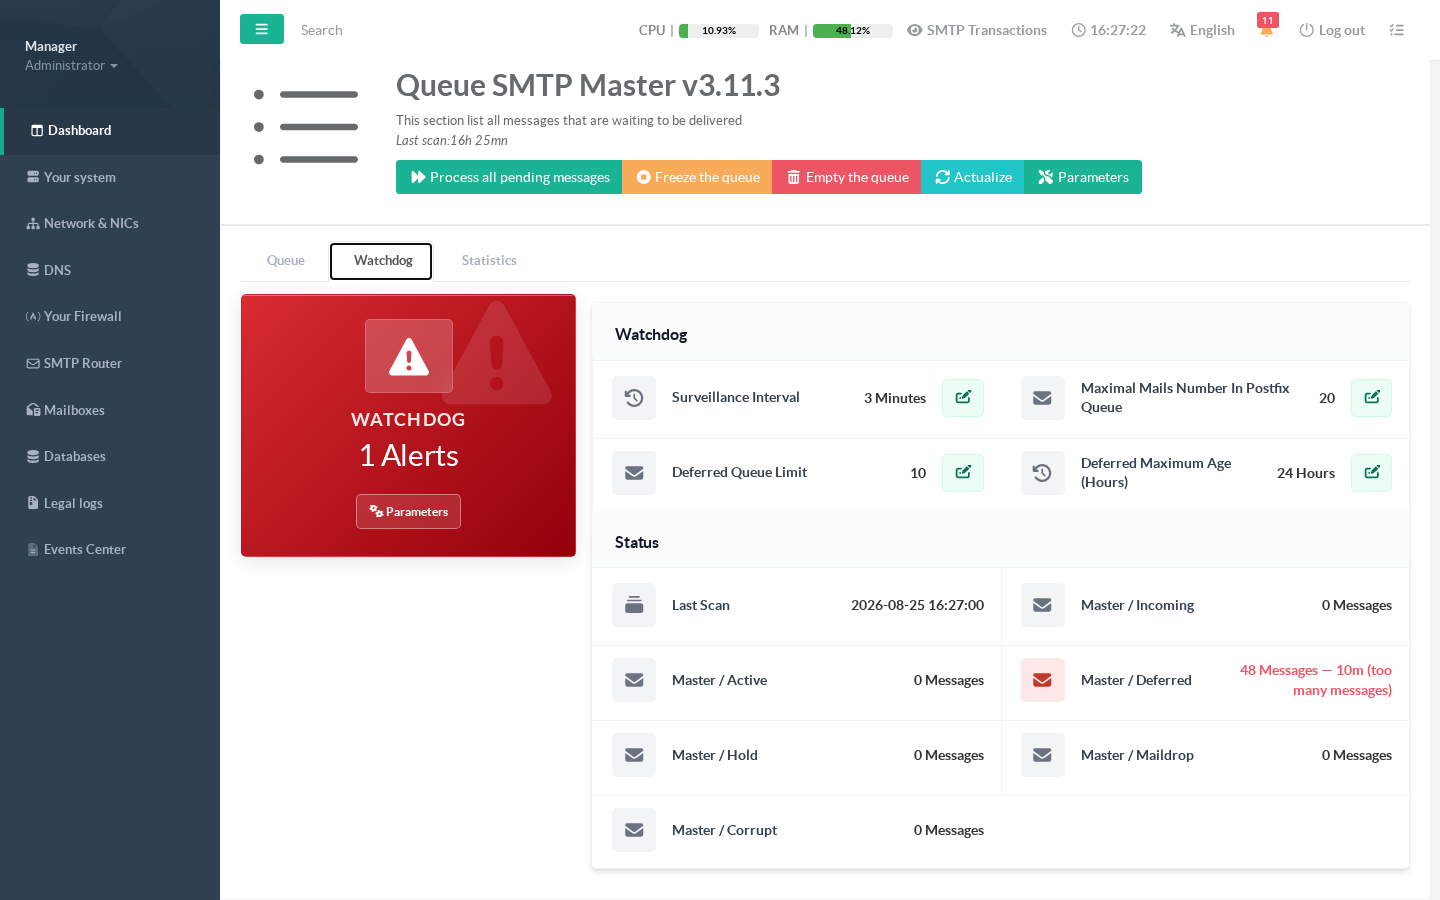
Two states this panel reports explicitly rather than hiding behind zeroes:
- « The surveillance has never run yet »
not a row of zeroes, which would read as « all queues empty ». - An instance that could not be measured (its mail system is stopped)
is reported as unmeasurable and raises no queue alert. A stopped Postfix is the business of service supervision, not of this feature.
¶ Statistics — is the backlog growing or draining
This is the fact a point-in-time count cannot give you, and the one that decides whether an alert needs action now.
Every measurement is kept for 48 hours; older points are folded into one aggregate per hour — carrying the hour's peak as well as its average — and kept for 30 days.
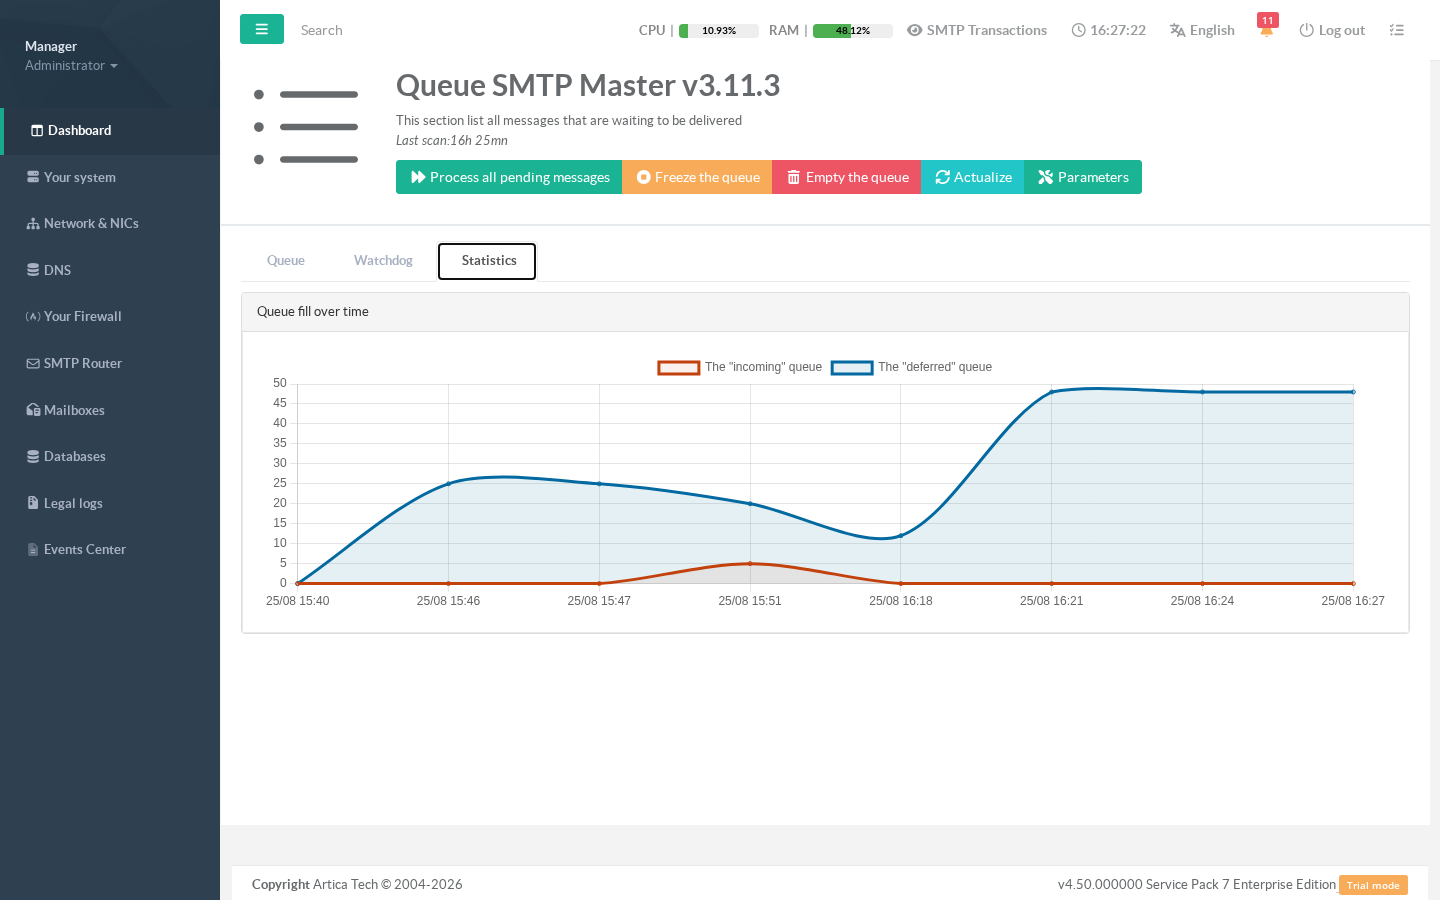
A period with no measurement at all is drawn as a gap, never as zero: joining the line across it would invent a backlog nobody measured. Below two points the page says so instead of drawing an empty chart.
¶ Settings
Everything is edited from the Parameters button in the page header.
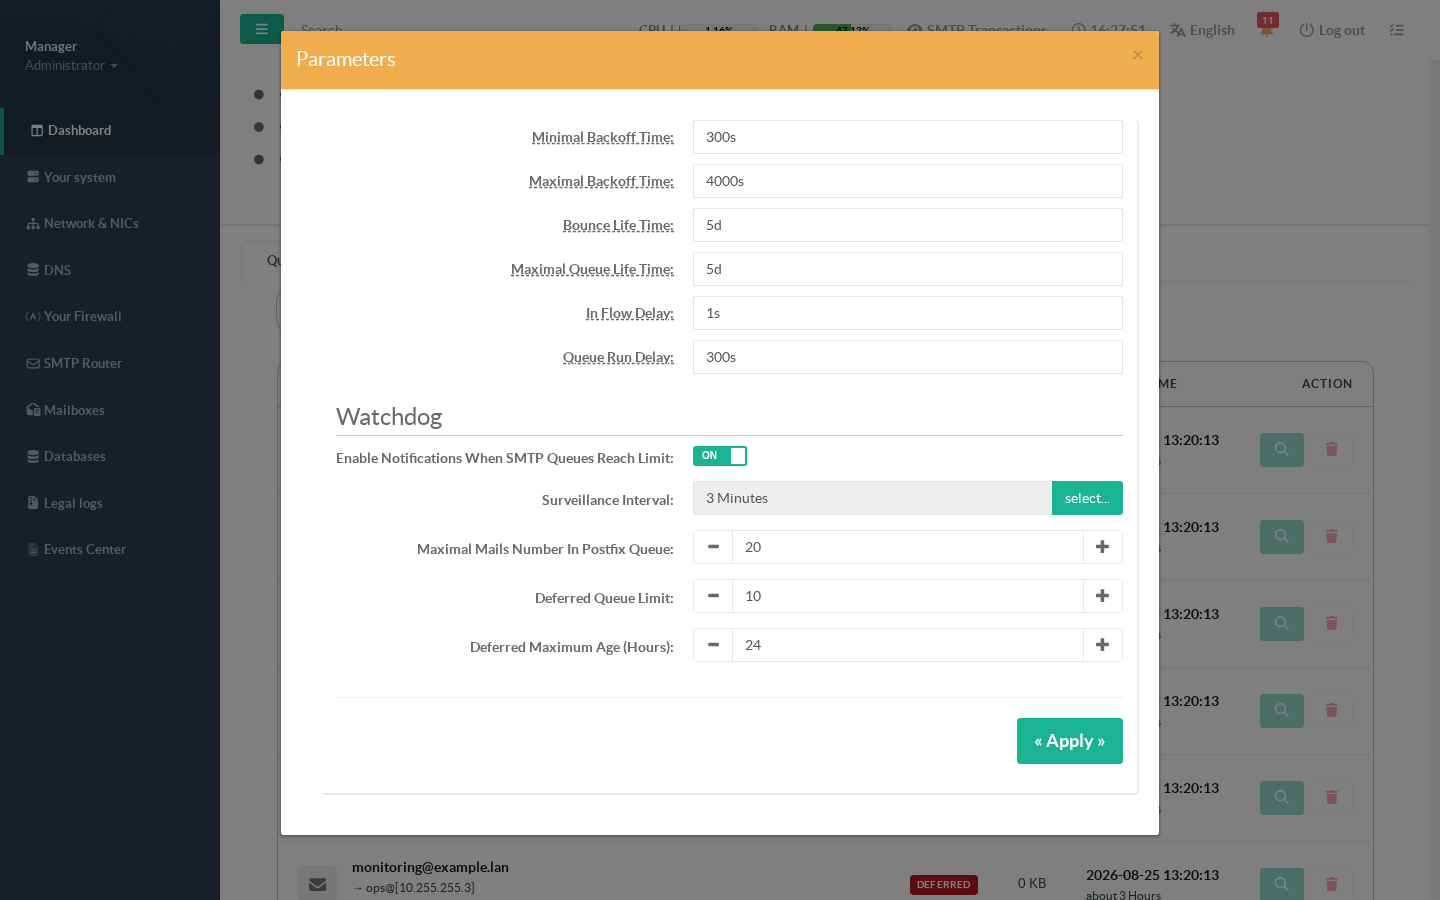
| Setting | Default | Meaning |
|---|---|---|
| Enable notifications when SMTP queues reach limit | off | the master switch; when off, nothing is measured, nothing is repaired and nothing is notified |
| Surveillance interval | 10 minutes | how often the queues are measured; takes effect on the next pass, with no restart |
| Maximal mails number in postfix queue | 20 | threshold for the fast-draining queues ( incoming, active, hold, maildrop, corrupt) |
| Deferred queue limit | 500 | threshold for deferred alone |
| Deferred maximum age (hours) | 24 | age of the oldest deferred message above which the queue alerts, whatever its count |
The interval is chosen from a closed list rather than typed.
An arbitrary period invites values that either flood the appliance or make the alert slower than the incident it reports.
¶ What the appliance repairs by itself
Two gestures, performed on every pass while the surveillance is enabled, and always reported in the alert — including when they did nothing:
- Corrupt queue recovery.
Postfix sets aside incorrupt/the queue files it could not read; nobody ever looks in that directory.
Each pass moves them back intomaildrop/for reprocessing.
A file whose name already exists inmaildrop/is left untouched and reported as a collision: an unrecovered message is a nuisance, an overwritten one is a loss.
- Flush on a swollen
activequeue.
A delivery attempt is requested once per pass
Never retried in a loop, because ifactiveis full precisely because delivery is saturated, insisting does not help.
¶ Benefits
- You learn about a stalled queue before your users do.
The classic support call is « my mail from this morning has not arrived »; by then the backlog is hours old. - The alert is actionable, not merely alarming.
Which instance, which queue, how many, since when, from whom, towards which domain, and the reason Postfix itself recorded — in the notification, without opening a console. - A small permanent failure is caught.
Ten messages stuck for four days never cross a count threshold, and are exactly the kind of quiet breakage that survives for months. - One alert per incident, not one per pass.
You can run the surveillance every three minutes without paying for it in noise. - Every instance is watched separately and the alert names the one concerned, so a multi-instance appliance does not send you to the wrong machine.
- Trend, not just level.
The history tells a growing backlog from a stable one — the difference between « act now » and « this is normal for this relay ». - Privacy by construction.
No recipient address, subject, header or body exists anywhere in the chain — not as a column, not as a field, not as a metric label. - It supervises itself.
An instance it cannot measure is reported as such, never as an empty queue.
¶ Use cases
Outbound relay in front of an application server
Your application bursts thousands of notifications.
Set the surveillance to 3 or 5 minutes, keep the deferred limit generous (a relay legitimately carries a backlog), and rely on the age rule: it is the one that will tell you a destination has stopped accepting mail, while the count keeps looking normal.
A remote domain stops accepting your mail
One partner's mail server changes its filtering and starts refusing you.
Deferred grows steadily.
The alert names the destination domain and quotes the exact delay reason Postfix recorded, which is usually enough to open the right conversation with the right party.
A compromised or misbehaving internal account
An account starts sending in volume and the queue swells.
Top senders names the account in the alert body — the fastest possible answer to « where is this coming from ? ». Pair this with SMTP AutoBlock for the inbound side.
Capacity planning on a busy gateway
The 30-day history, which keeps each hour's peak and not just its average, shows whether your queues drain fully every night or accumulate week over week.
A ten-minute spike three weeks ago is still visible.
Multi-instance appliance
Every enabled instance is measured independently, and the alert names it.
Each instance has its own thresholds through its own Parameters window.
Quiet appliance, low noise
On a server that normally holds nothing, leave the defaults and set the interval to one hour.
Any queue at all becomes notable, and a full day without incident produces zero notifications.
¶ Command line and API
The same information is available outside the console.
# print the stored state — never measuresartica-postfix -queue-watchdog-status# run one surveillance pass nowartica-postfix -queue-watchdog-run
-queue-watchdog-run exits 2 when a pass was already running and 3 when the surveillance is disabled, so a declined run stays distinguishable from a run that simply found nothing.
Over the management socket (/run/artica-postfix.sock):
GET /postfix/queue/watchdog/statusGET /postfix/queue/watchdog/runGET /postfix/queue/watchdog/history?instance=0&hours=168GET /postfix/queue/watchdog/metrics
The metrics endpoint speaks the Prometheus text format and exposes queue fill, the age of the oldest deferred message and the alert state, labelled by instance and queue only — never by an address or a domain, which would create unbounded permanent time series. artica_queue_watchdog_last_pass_age_seconds is -1 when no pass has ever run; a 0 would read as « measured just now », the healthiest possible value, for a watchdog that has measured nothing.
¶ Things that look like faults and are not
- A healthy appliance produces nothing at all. No notification, no trace. That is the intended behaviour, not a broken watchdog.
- An alert did not repeat. While a queue stays in alert you are told once per 30 minutes, whatever the surveillance interval.
- The chart says there is not enough history. It needs at least two measurements; after a reset or a fresh install, come back in a few passes.
- A statistics reset empties the chart but not the alerts. Deliberate: erasing the alert state would re-notify an incident you already know about.
¶ Where the data lives
| What | Erased by a statistics reset? |
|---|---|
| Settings | no |
| Alert state (which queue is alerting, when it was last notified) | no |
| Queue fill history | yes |
The split is deliberate. Erasing the alert state would re-notify an ongoing incident; keeping the history would leave the page charting data you believe you deleted.