Every 60 seconds, the Artica Scanner probes each backend of every published website, measures HTTP response time to the millisecond, records the result, and feeds it into interactive charts you can access in one click.
This feature is available on Artica v4.50 Service Pack 7 or Artica v4.50 Service Pack 6 Hotfix 20260217-00
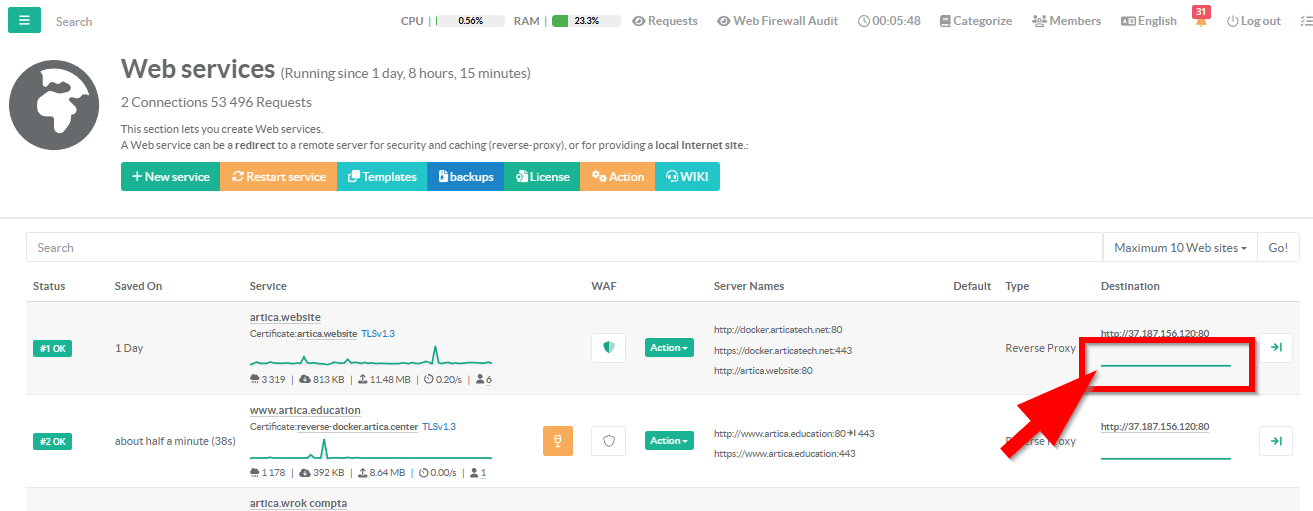
- On the main web services click on the latency graph in the destination column
¶ The Realtime tab
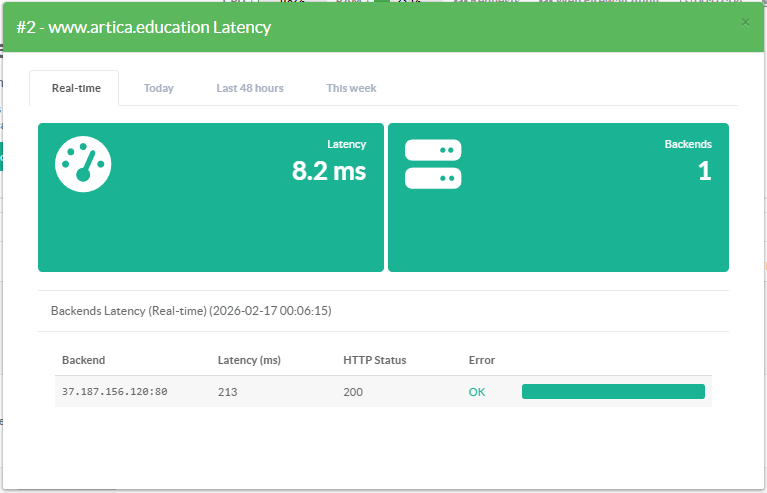
2 KPI Widgets:
- Latency — Overall mean response time across all stored probes. Turns amber when above 500 ms, signaling degradation before users notice.
- Backends — Number of backend servers probed. Turns amber if any backend returned an error.
Per-Backend Detail Table — Every backend listed with:
- Hostname and port in monospace for quick identification
- Latency in milliseconds — bold, sortable, immediately comparable
- HTTP status code — color-coded badge (green for 2xx, amber for 4xx, red for 5xx or connection failure)
- Error message — displayed in red when a backend fails, or a reassuring green "OK" when healthy
- Proportional latency bar — visual comparison across backends without reading numbers. The slowest backend fills the bar; others are proportional.
¶ Historical Latency Trends
The Today, Last 48 Hours, and This Week tabs display aggregated latency metrics over time
- Today: 10-minute windows since midnight
How has latency evolved today? - Last 48h: 10-minute windows, rolling 48 hours
Compare today vs. yesterday - This Week: 1-hour windows, rolling 10 days
Spot day-over-day patterns and trends
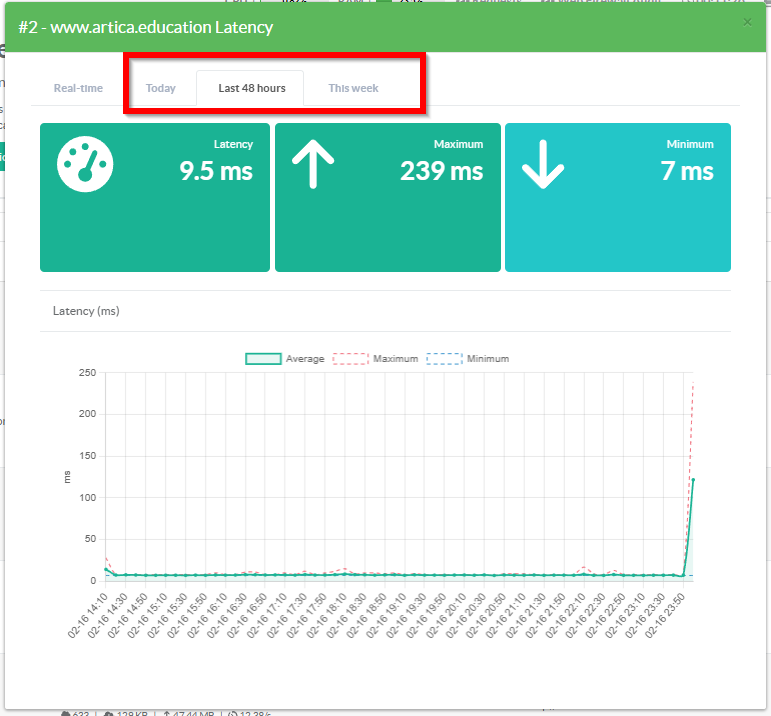
3 Summary Widgets
- Latency: Green < 500 ms, amber >= 500 ms
- Maximum Latency
- Minimum Latency