This feature delivers real-time, per-client visibility within Artica Reverse Proxy.
Every request is monitored by source IP address, target service, and response status — providing operators and security teams with immediate insight into traffic behavior.
Questions that once required log analysis, external tools, or manual investigation can now be answered instantly from the interface.This feature is available on Artica v4.50 Service Pack 7 or Artica v4.50 Service Pack 6 Hotfix 20260211-12
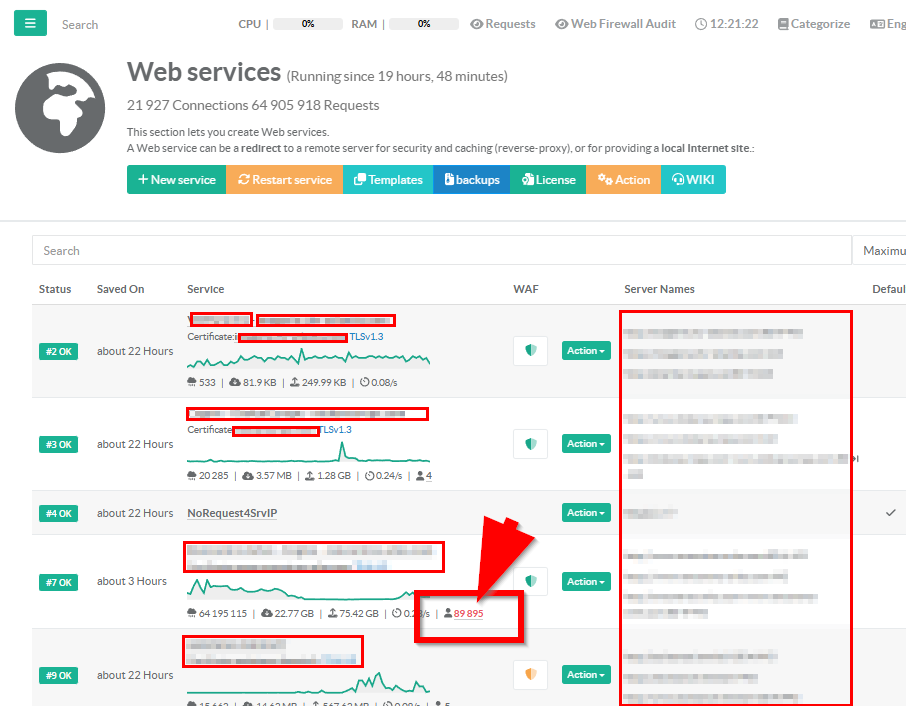
- On the web service section, you can see an user icon followed by a number.
- The number represents the number of unique IP addresses that connected during a 10-minute period.
- Two status colors are used:
- Yellow – more than 5,000 clients detected.
- Red – more than 50,000 clients detected.
- Click on the link of this number.
- It opens as a dialog window titled with the service name and delivers three layers of insight:
- Summary widgets, interactive charts, and a detailed client table.
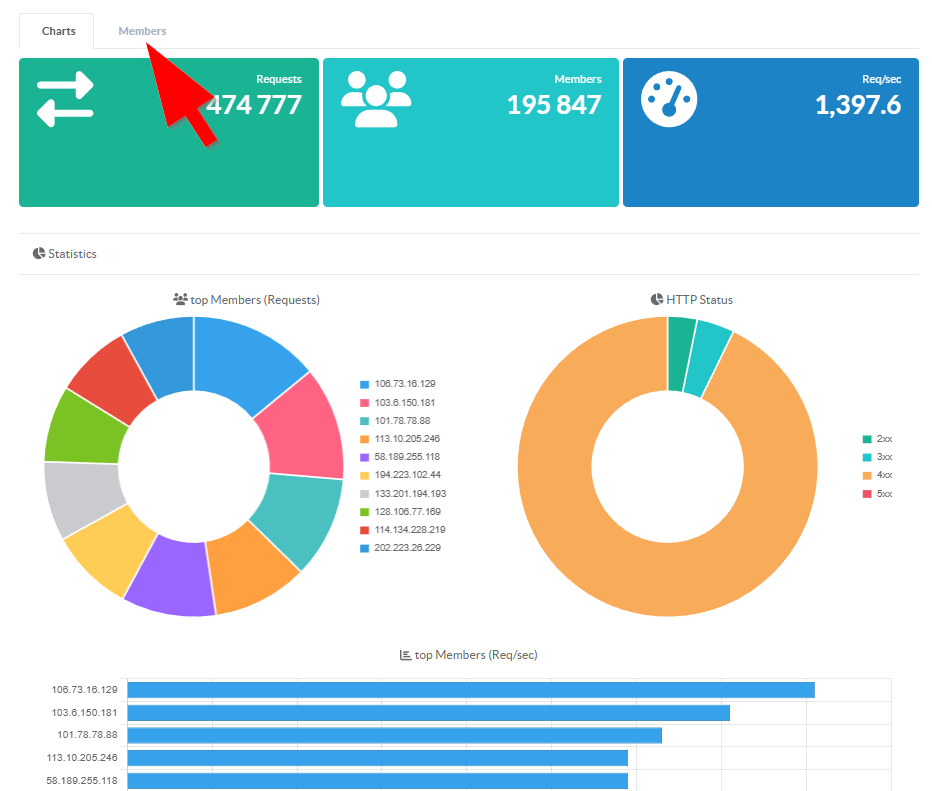
Four widgets across the top of the dashboard provide instant situational awareness, auto-refreshing every 10 seconds:
- Requests: Total requests in the current observation window
- Unique Clients: Count of distinct client IPs currently active
- Req/sec: Aggregate request rate across all clients
These 3 numbers answer the most common questions during an incident: how much traffic, how many sources, how fast, and how fresh is this data.
The Charts tab presents three interactive visualizations:
Top 10 Clients by Requests (Doughnut Chart) Instantly see which IPs are generating the most traffic.
During a DDoS, the attacker IPs dominate the chart.
During normal operations, it reveals your heaviest consumers.
- HTTP Status Distribution (Doughnut Chart) A color-coded breakdown of response categories across all clients:
- Green (2xx) — Successful responses
- Teal (3xx) — Redirects
- Orange (4xx) — Client errors (blocked requests, missing pages)
- Red (5xx) — Server errors
A healthy service shows mostly green.
A sudden shift to orange or red is immediately visible without reading a single number.
- Top 10 Clients by Req/sec (Horizontal Bar Chart) Sorted by request rate, this chart highlights the fastest-hitting clients.
An IP at 40 req/s stands out against a cluster of clients at 1-2 req/s — making rate anomalies obvious at a glance.
- Members Tab — Client-Level Detail
The Members tab presents a sortable, filterable, paginated table of every client IP in the current window (up to 500 rows).
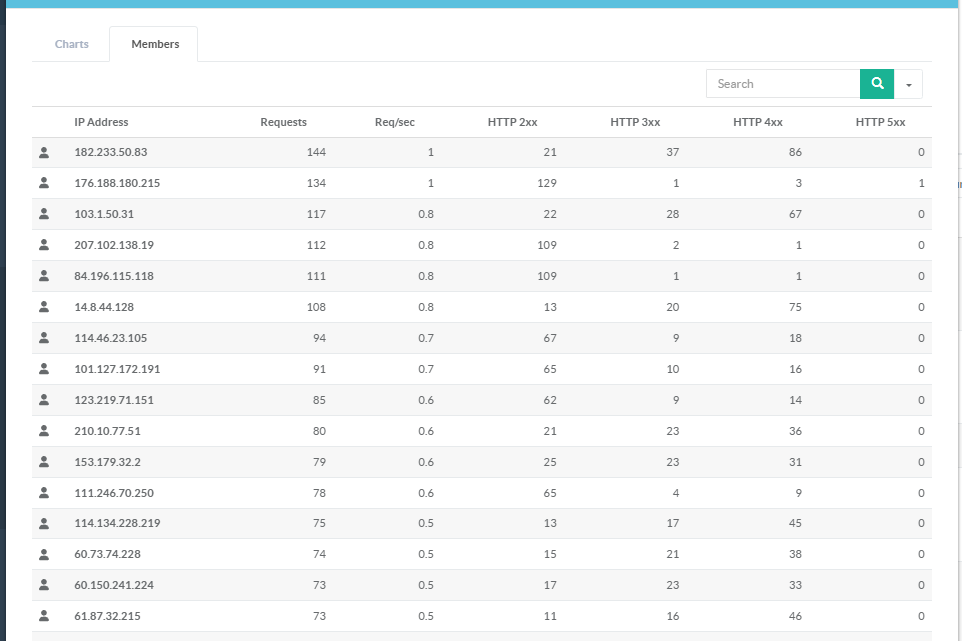
- Each row includes:
- IP Client IP address
- Requests Total request count
- Req/sec Per-client request rate
- HTTP 2xx Successful responses (green badge)
- HTTP 3xx Redirects (teal badge)
- HTTP 4xx Client errors / blocked (orange badge)
- HTTP 5xx Server errors (red badge)
Color-coded badges make it easy to scan hundreds of clients and spot anomalies.
A client with 12,000 requests and an orange "403" badge of 11,998 is immediately suspicious.
A client with a red "500" badge on every request points to a backend bug triggered by a specific request pattern.
¶ Historical Tracking
Operational Log File A human-readable log at /var/log/client-metrics.log records per-IP summaries every 10 minutes.
Useful for quick terminal-based investigation:
[2026-02-10 14:20:00] [203.0.113.50] ServiceID:7 [42.8 req/s] [12847 total] [200:2 403:12845]