The Prometheus Exporter is a Prometheus exporter that scrapes metrics from the reverse-proxy service and exposes them in a format that Prometheus can ingest.
It runs as a separate service.
A Prometheus exporter is a software component that collects metrics from a target system (e.g., a web server, database, or application) and exposes them in a format that Prometheus can scrape.
Prometheus then stores these metrics in its time-series database for querying, alerting, and visualization.This feature is available in Artica v4.50 Service Pack 1 or Artica v4.50 Hotfix 20250204-01
¶ Enable Prometheus Exporter
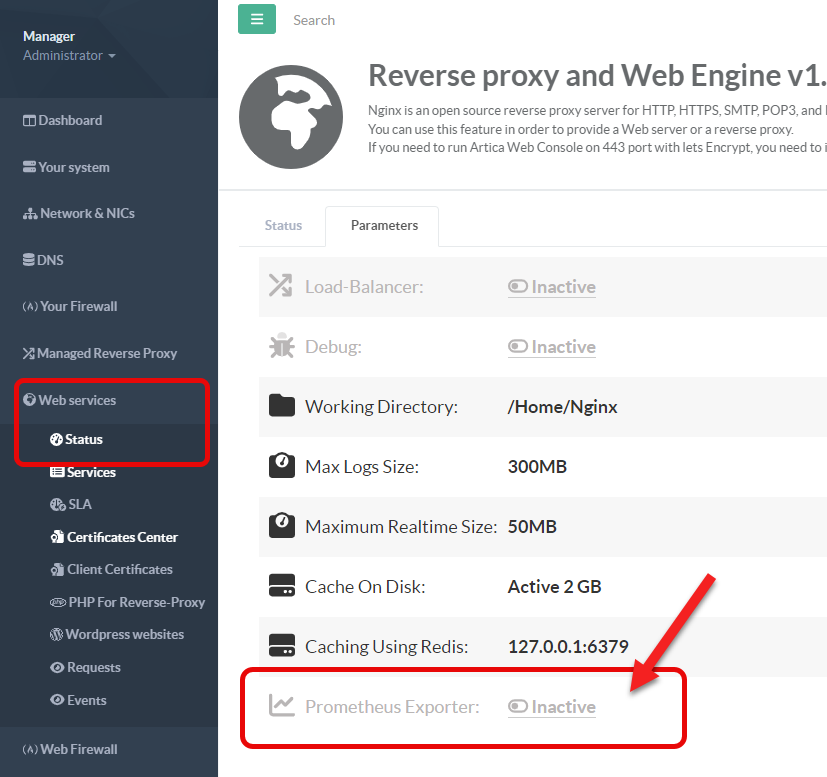
- On the left menu, go to
Web services > Status - Select “Parameters” tab
- Click on the Prometheus Exporter link
- Turn on the feature
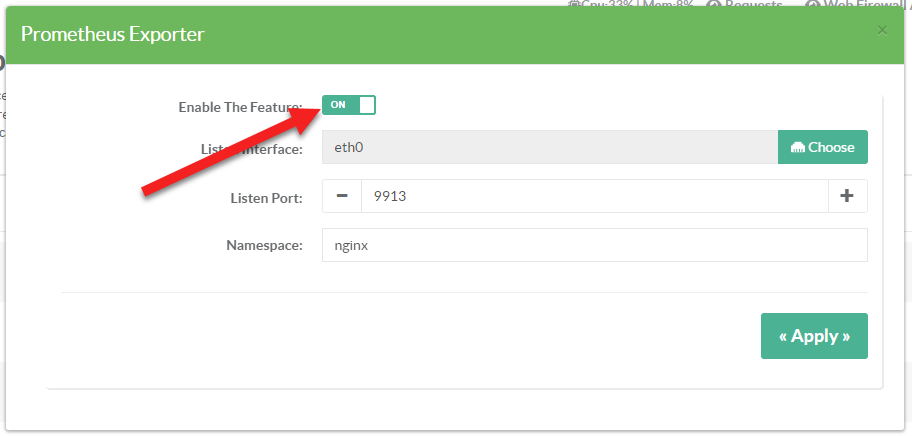
- Give the listen interface and listen port for the Exporter:
The exporter exposes the formatted metrics on an HTTP endpoint (/metrics).
- Give the Namespace for the exporter:
The namespace refers to a prefix that is added to all metrics exposed by the exporter.
This prefix helps to group related metrics together and avoid naming conflicts between metrics from different exporters or applications.
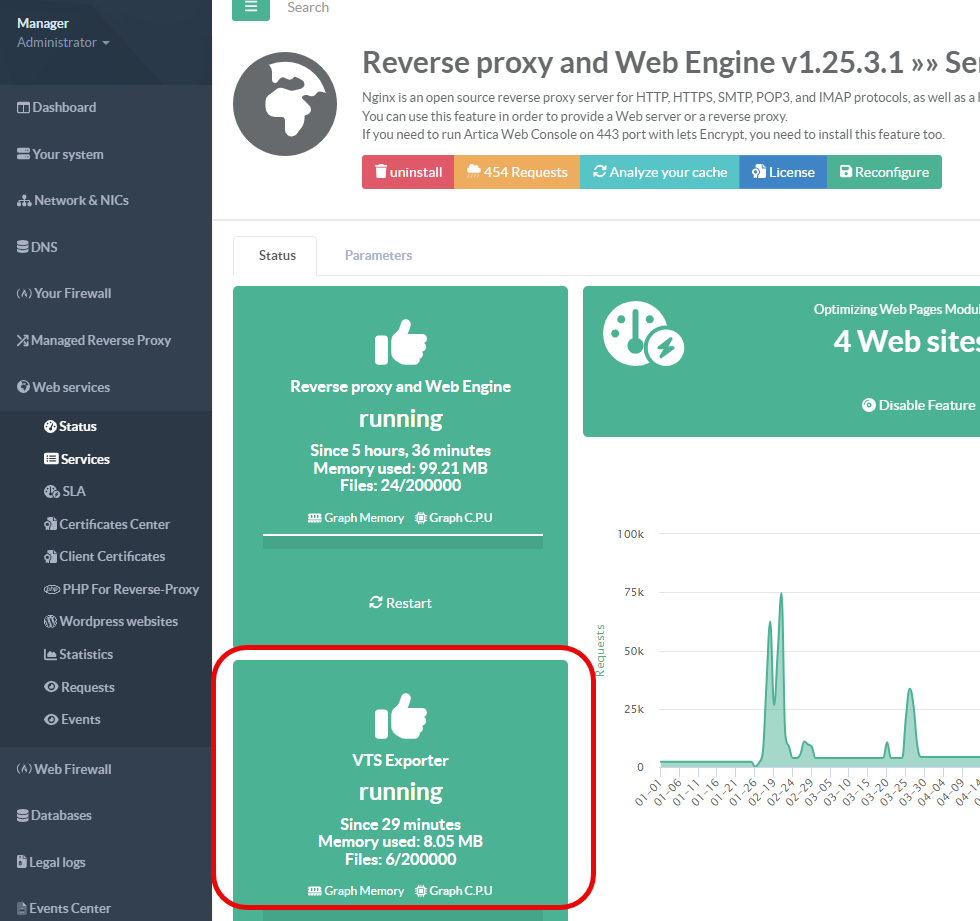
- If you return back to the Status, you will see the “VTS Exporter” status
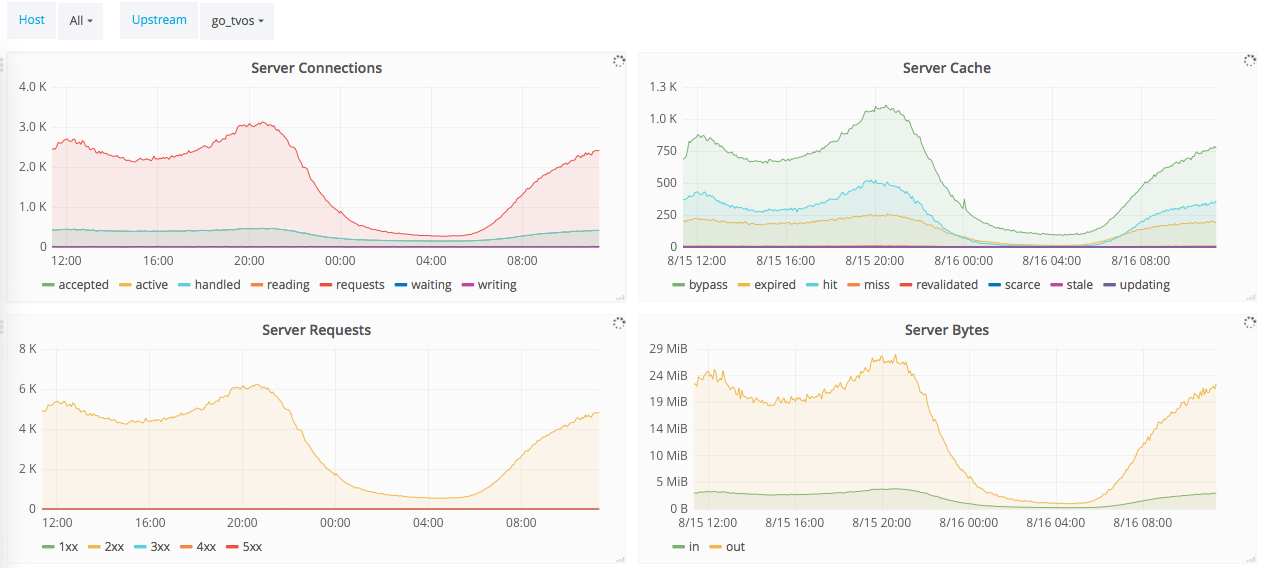
¶ Insert the template inside grafana
Inside your Grafana, import this dashboard configuration - /2949_rev2.json -