Global Request Statistics gives the messaging/reverse-proxy administrator a long-term, per-site view of how much traffic each published web service handles — day by day over the current month, and month by month over the current year — together with a one-click PDF report for the whole estate.
¶ Overview
Every request the reverse-proxy serves is counted per web service in short (3-minute) windows and rolled up into a compact per-day, per-service database.
From that data the console builds one things:
- a dedicated Global Statistics page that lists every service with its cumulative yearly total and, on demand, two trend charts per service.
¶ Where to find it
Open Web Services > Statistics > Global metrics .
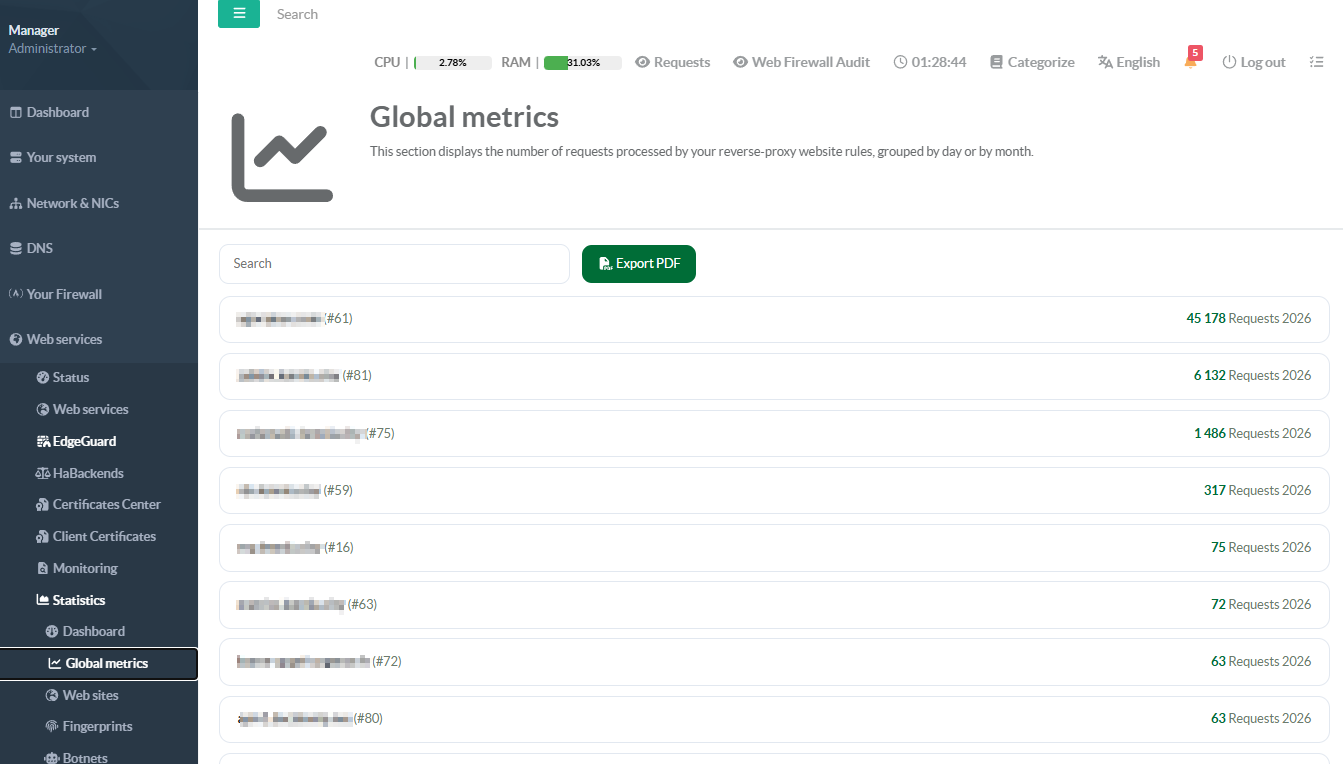
The Global Statistics page opens with a search box, an Export PDF button, and the list of all services ranked by yearly request volume.
¶ Per-service trends
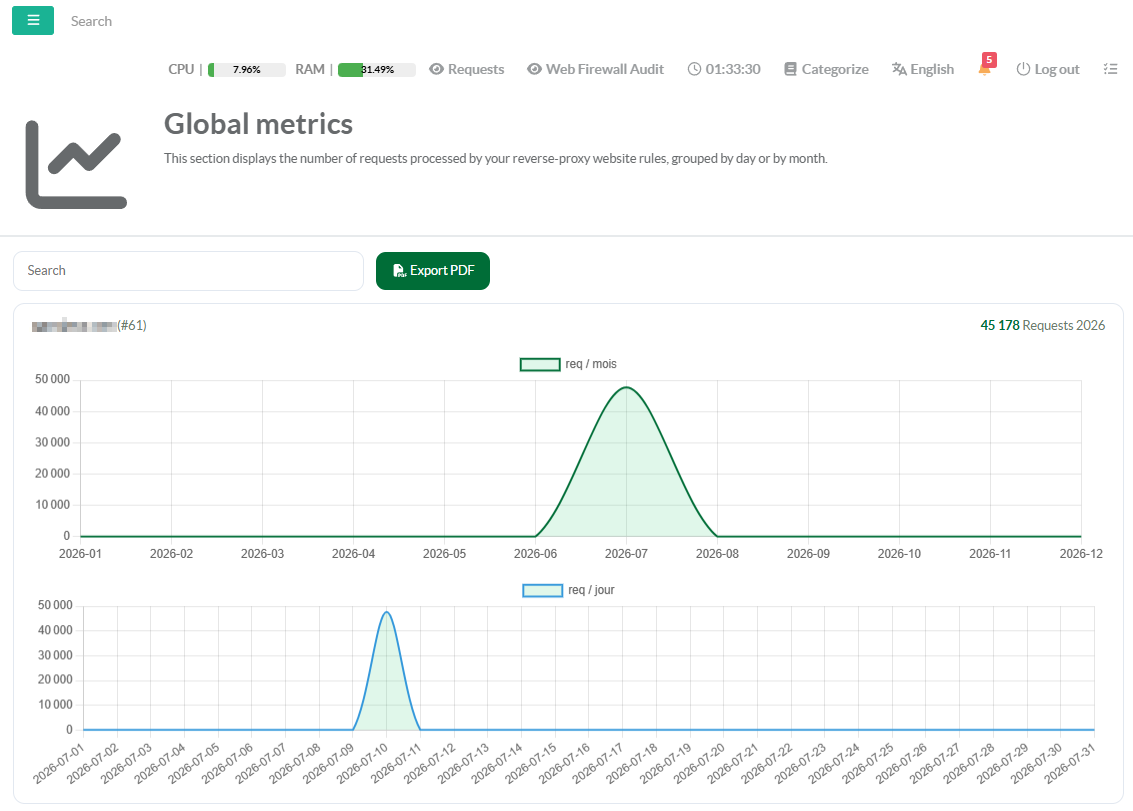
Click any service row to expand it. Two line charts load on demand:
- Requests per month — the twelve months of the current year;
- Requests per day — every day of the current month.
¶ PDF report
The Export PDF button produces a single, multi-page report — one page per service that has traffic — with the yearly total and both trend charts rendered server-side. It is ideal for periodic reporting, audits, or attaching to a ticket.
¶ How it works
- Requests are counted per service in 3-minute windows, off the logging hot path.
- At each window a per-service daily total is added to a compact on-disk database.
- The console reads that database through the daemon API to build the yearly list, the monthly/daily charts, and the PDF.
- The live requests per minute figure is computed from the most recent window and refreshed automatically.
¶ Data availability & retention
Statistics accumulate from the moment the feature is deployed — months before deployment show no data.
Totals and the per-minute rate start at 0 and populate as traffic flows (the first values appear within a few minutes).
Data from previous years is purged automatically at the start of each calendar year, keeping the store small.