After installing the Zabbix agent in Artica, you must define the required configuration parameters to ensure proper communication with your Zabbix server.
If these parameters are not configured, the service status widget will remain red, and Artica will prevent the agent service from starting to avoid misconfiguration or connection failures.
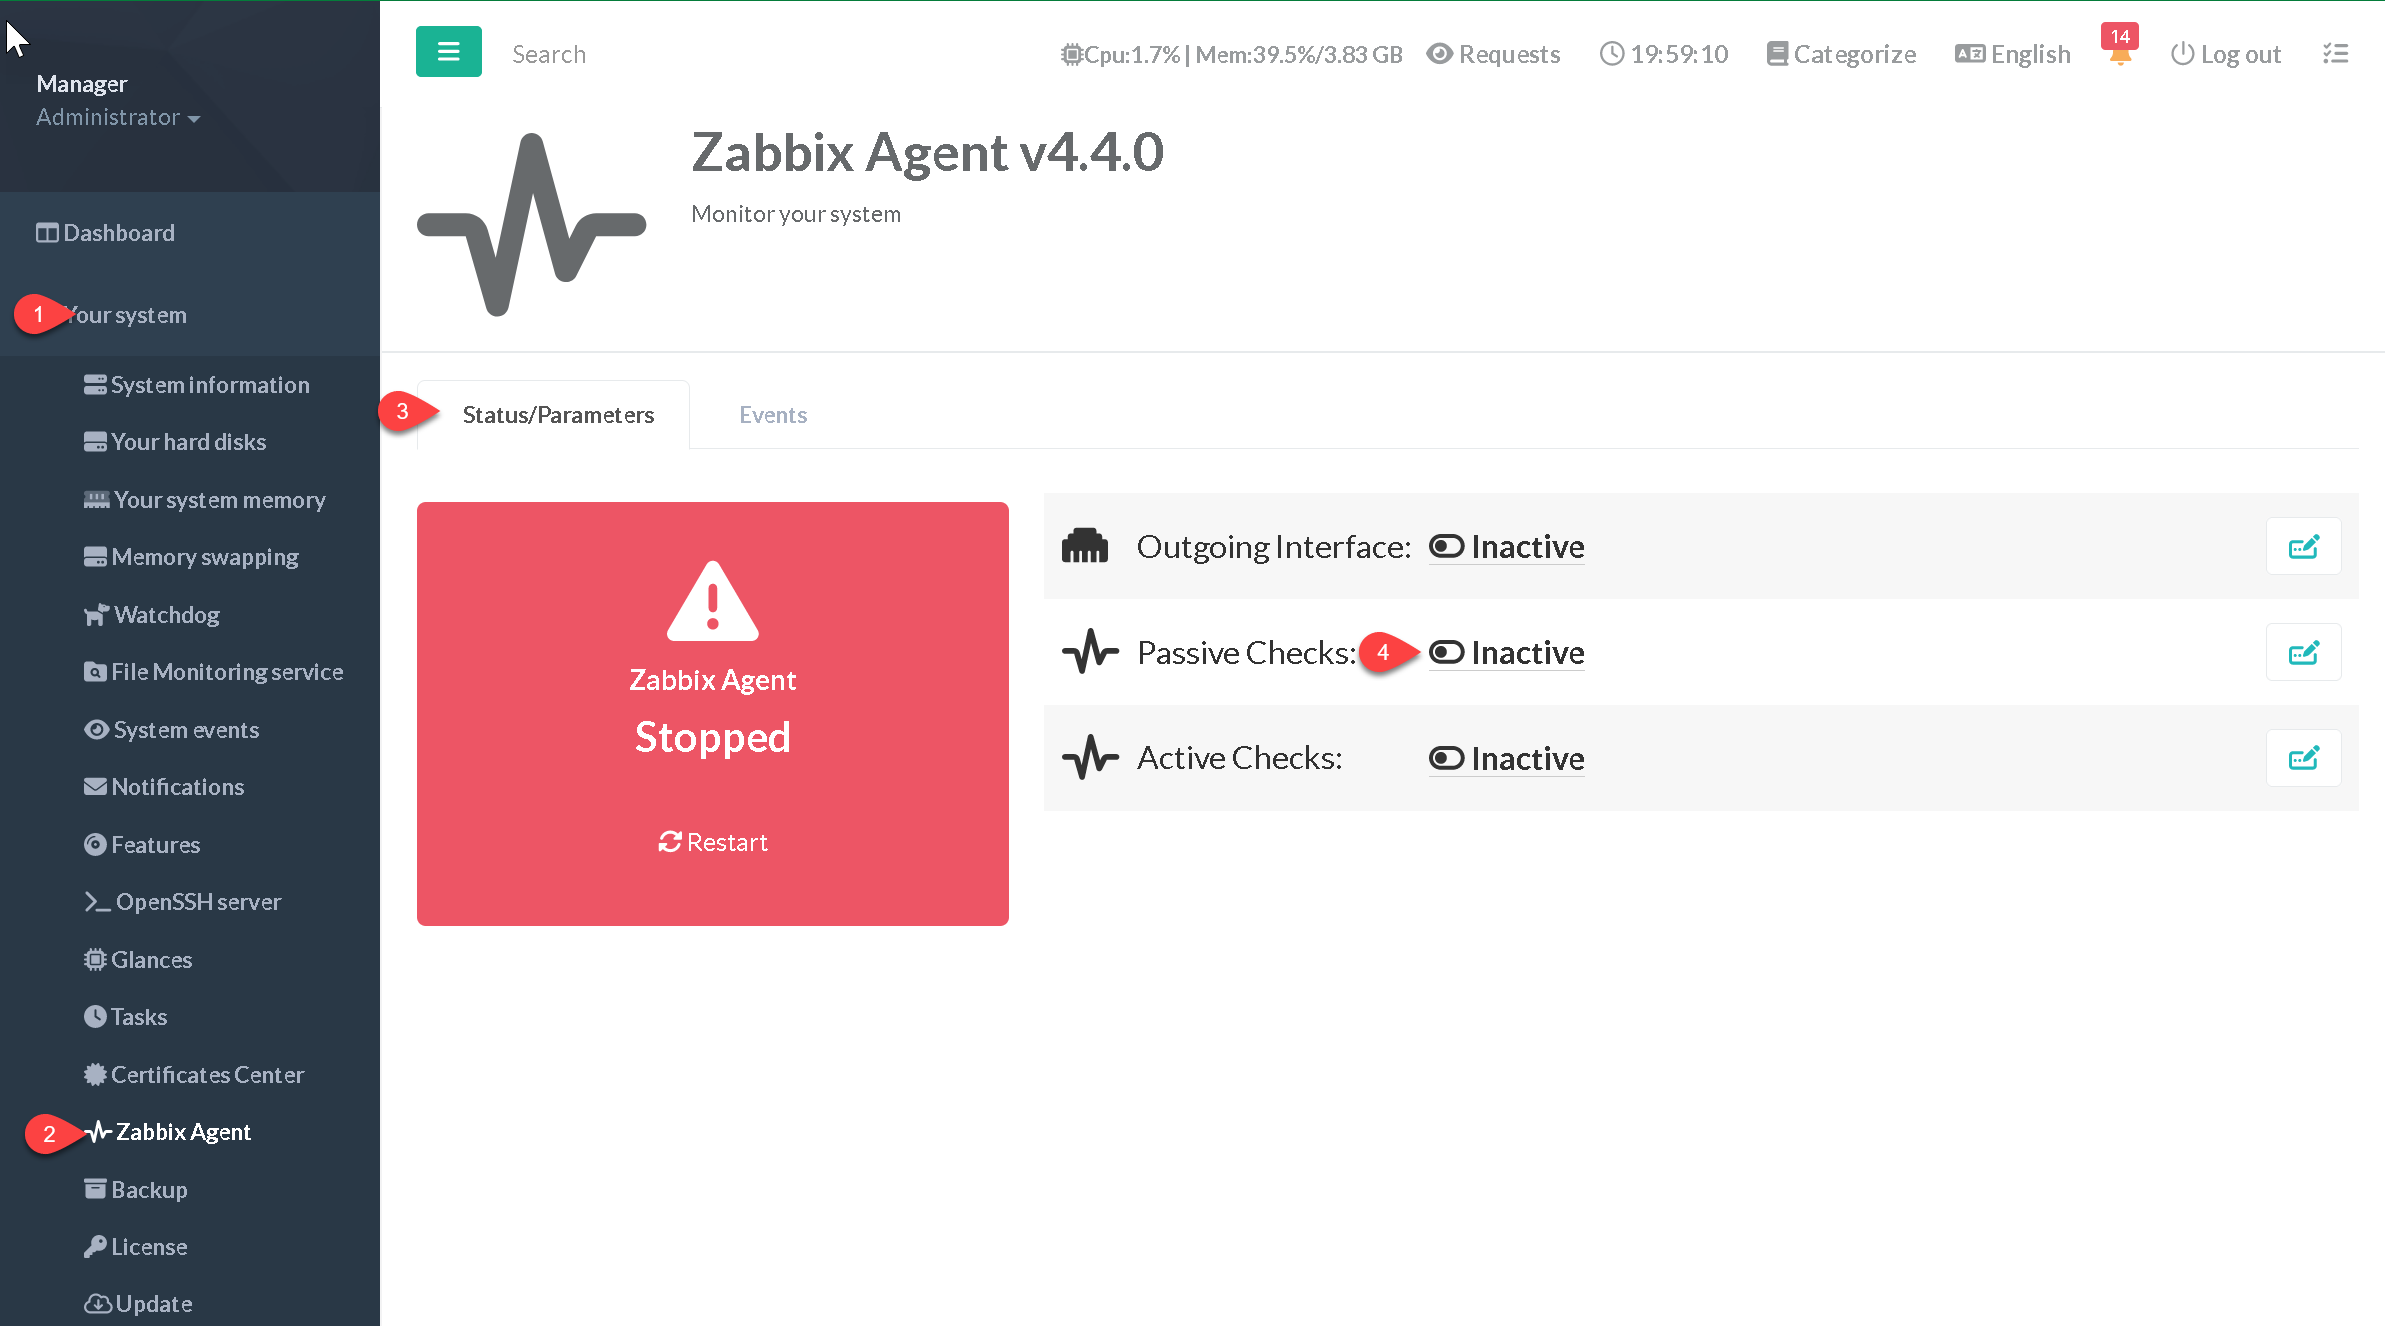
- On the left menu, choose “
Your system” > “Zabbix Agent”
¶ Outgoing Interface
The "outgoing interface" refers to the network interface through which the Zabbix agent sends data to the Zabbix server.
When the Zabbix agent is configured on a host, it collects data from that host and sends it to the Zabbix server for monitoring and analysis. The agent uses a network interface to communicate with the Zabbix server, and this network interface is referred to as the outgoing interface.
In most cases, the outgoing interface is automatically detected by the Zabbix agent during the installation and configuration process.
However, it is also possible to manually specify the outgoing interface in the agent configuration file, especially in cases where the host has multiple network interfaces.
The outgoing interface is important because it determines the network path that the data takes from the monitored host to the Zabbix server.
It can affect the performance and reliability of the monitoring process, especially in large and complex network environments.
Therefore, it is important to ensure that the outgoing interface is correctly configured and optimized for the specific monitoring needs and requirements of the organization.
¶ Passive Checks or Active Checks ?
In Zabbix, passive and active checks are two different methods of monitoring that are used to retrieve data from monitored hosts or devices. The main difference between the two is in the way the data is collected.
¶ Active checks: [ Zabbix Server ==> Artica + Zabbix Client ]
With active checks, the Zabbix server sends requests to the monitored devices to retrieve the required data.
This means that the monitoring process is initiated by the Zabbix server, and the monitored devices must be configured to allow incoming requests from the Zabbix server.
Active checks can be used to monitor various parameters such as CPU usage, memory usage, and network traffic.
¶ Passive checks: [Artica + Zabbix Client ==> Zabbix Server ]
With passive checks, the Artica + Zabbix Agent send data to the Zabbix server without any request from the server.
This means that the monitoring process is initiated by your Artica server.
Passive checks can be used to monitor parameters such as log files, network port availability, and other data that is not actively monitored by the device.
In other words, with active checks, Zabbix initiates the monitoring process and requests the data from the monitored device, while with passive checks, the monitored device initiates the monitoring process and sends the data to Zabbix without being prompted.
Both methods have their advantages and disadvantages:
Active checks are more resource-intensive because they require the Zabbix server to send requests to the monitored devices, while passive checks can be more accurate because they rely on real-time data from the devices themselves.
Ultimately, the choice of which method to use depends on the specific monitoring needs and requirements of the organization.
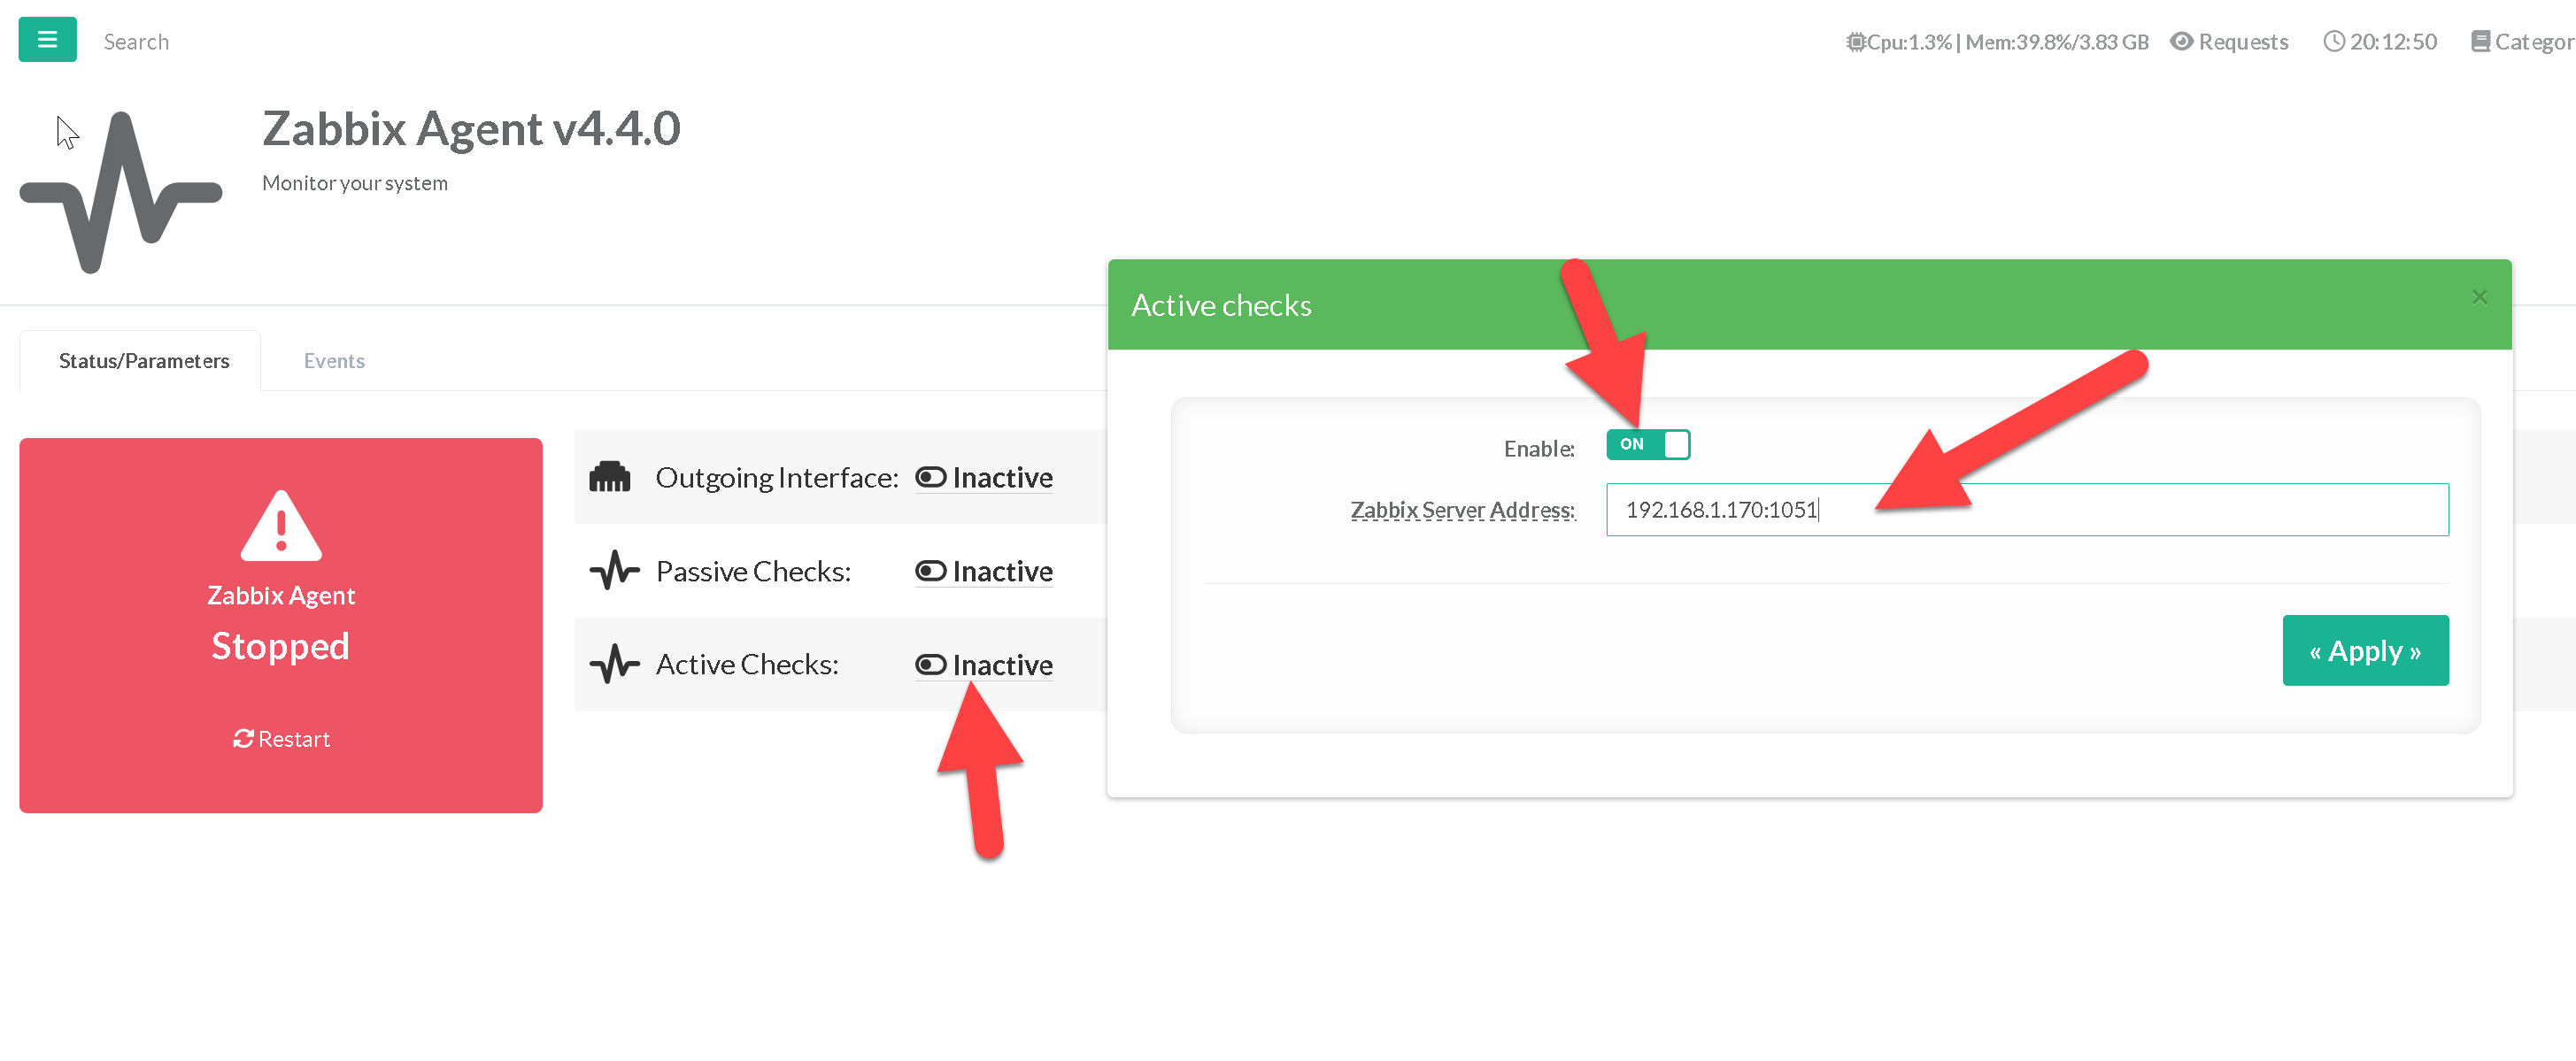
¶ Setup the Active Checks
- Click on the Inactive link on the Active Checks
- Turn on the Enable option.
- Set in Zabbix Server address a list of comma delimited IP:port (or DNS name:port) pairs of Zabbix servers and Zabbix proxies for active checks.
If port is not specified, default port 1051 is used.
IPv6 addresses must be enclosed in square brackets if port for that host is specified.
If port is not specified, square brackets for IPv6 addresses are optional.