Backend SLA continuously supervises the servers your reverse proxy forwards traffic to.
It measures whether each backend answers, how fast it answers, whether its TLS is sound, and whether it meets the availability target you expect from it
And it keeps that history so you can prove it.Artica already knows when a backend fails, but only at the moment a visitor is hit by the failure.
Backend SLA asks the question before your visitors do, on a schedule, and remembers the answer.
¶ Why you want it
- You learn about a failing backend before your users tell you.
Probes run continuously, independently of visitor traffic.
A backend that breaks at 3 a.m. on a low-traffic site is detected at 3 a.m., not at 9 a.m.
- You can prove your availability.
Every measurement is stored and compared against the availability target of the backend.
The SLA verdict, the observed availability, the consumed error budget and the accumulated downtime are computed for you.
- You see where the time goes.
A deep probe measures DNS resolution, TCP connection, TLS handshake and time-to-first-byte separately.
"The site is slow" becomes "the TLS handshake takes 400 ms".
- Your backend TLS is graded, not guessed.
Protocol version, cipher suite, certificate validity, SNI match, self-signed detection and days-to-expiry are checked on every deep probe and turned into a score and a letter grade.
- Outages become incidents with a beginning and an end.
Instead of scrolling logs, you read a list: when it started, when it ended, how long it lasted and why.
- It costs your backends almost nothing.
Most measurements are free — they reuse the latency scan the reverse proxy already performs. Only the detailed probe issues its own request, every five minutes by default.
- It is always on.
There is nothing to enable: as soon as a website has backends, they are supervised.
A fleet supervised on some appliances and not on others tells an operator nothing.
¶ Typical use cases
- Proving an SLA to a customer or to management
You committed to 99.9 % availability.
The SLA section tells you the observed availability, the target, the downtime accumulated, and — most importantly — the window actually measured.
A figure that covers three hours is never presented as if it covered thirty days.
- Arbitrating between "the proxy is slow" and "the backend is slow"
When users complain, the Performance tab separates connection time, TLS handshake time and time-to-first-byte.
If TTFB is high while connection and TLS are flat, the application is slow — not the network, and not the proxy.
- Watching a certificate you do not control
Backends often carry their own certificate, renewed by another team.
The Security tab reports its issuer, expiry date, remaining days, whether it matches the requested name and whether it is self-signed.
An expiry that would have broken production on a Sunday becomes a number you can watch on a Tuesday.
- Validating a migration or a maintenance window
Move a website to a new backend, then compare availability and latency before and after over the same window.
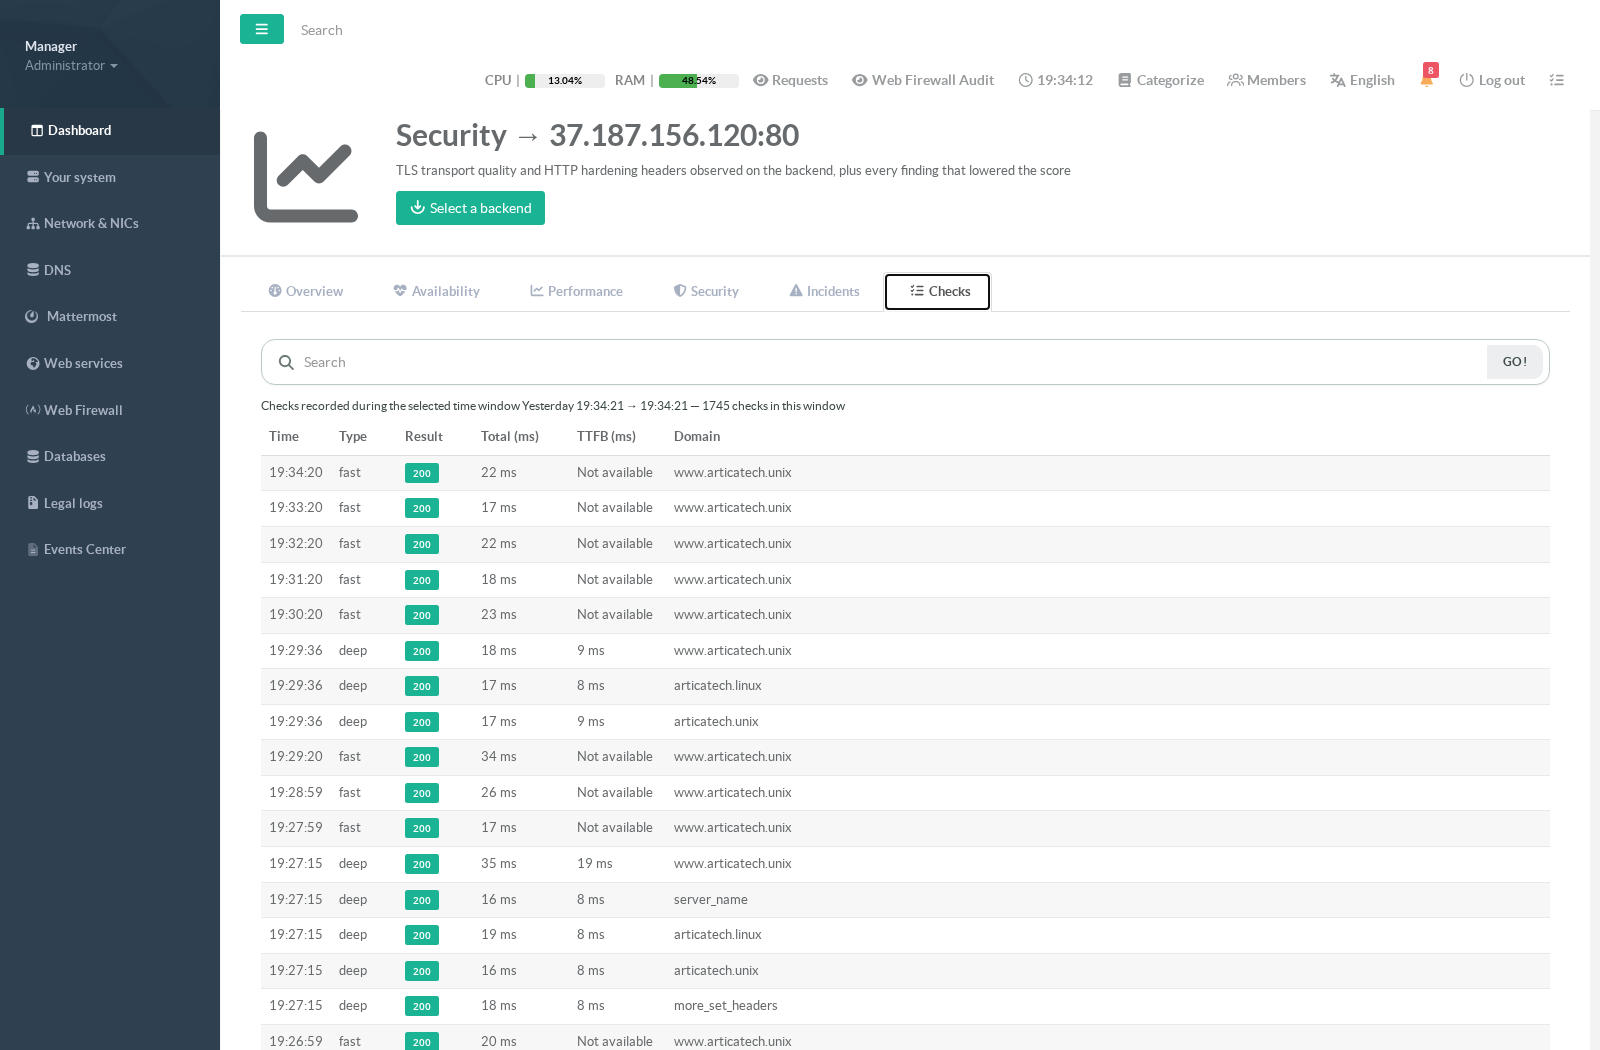
The Checks tab lists the individual measurements, so you can see the exact moment behaviour changed.
- Catching the backend that is up but wrong
A backend answering500is still "reachable".
Backend SLA judges the answer against the status codes you expect (200-399by default), so a server that responds but responds badly is counted as unavailable — because for your visitors, it is.
¶ How it works
¶ Two measurement rates
Backend SLA combines two sources, deliberately:
- Fast samples — taken from the latency scan the reverse proxy already runs, roughly every minute. They cost your backends nothing extra, and they carry availability and total response time.
- Deep probes — a full request issued by the module itself, every five minutes by default. They measure the phase breakdown (DNS, connect, TLS, time-to-first-byte) and inspect the certificate.
Both are judged by the same rule: the HTTP status must fall inside the expected range. Fast samples outnumber deep ones, so a laxer rule for them would quietly distort availability, SLA and downtime at once.
¶ Which host names are probed
Each website is probed on its service name first, then on every host name declared for it. A site published under three names is measured under those three names — because a virtual host can be healthy under one name and broken under another.
¶ States
- Initializing — discovered, not enough measurements yet to judge.
- Up — answering as expected.
- Degraded — answering, but past a latency threshold or below the minimum security score.
- Down — failing repeatedly (three consecutive failures by default; two consecutive successes to recover).
- Maintenance / Disabled / Removed / Unknown — administrative or transitional states.
Reach it from the left menu: Web services > Backend SLA. The page has two tabs.
¶ Status tab
Nine tiles summarise the whole fleet: how many backends are supervised, how many are up, degraded or down, the average availability over 24 hours, the average latency, the average security score and the number of open incidents.
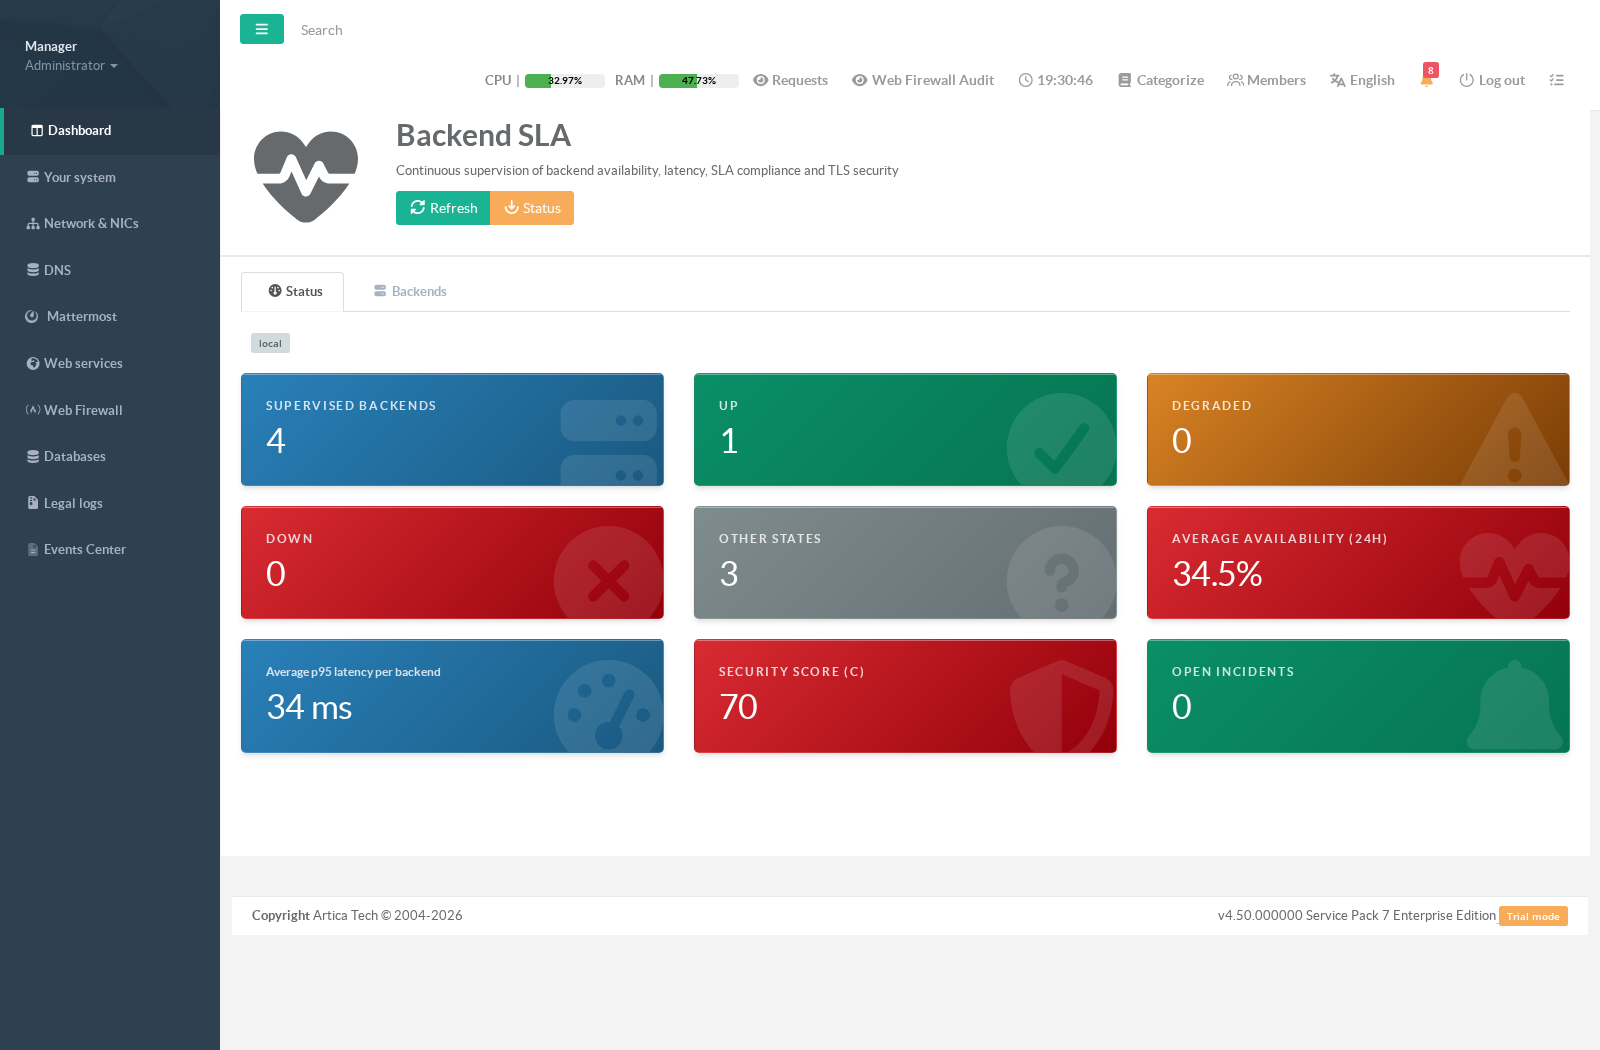
The small badge above the tiles reports where the figures come from:
local when the appliance answers from its own store, siem when long-term history is joined from an Artica SIEM appliance, and local-fallback when a SIEM is configured but could not be reached.
You always know which one you are reading.
¶ Backends tab
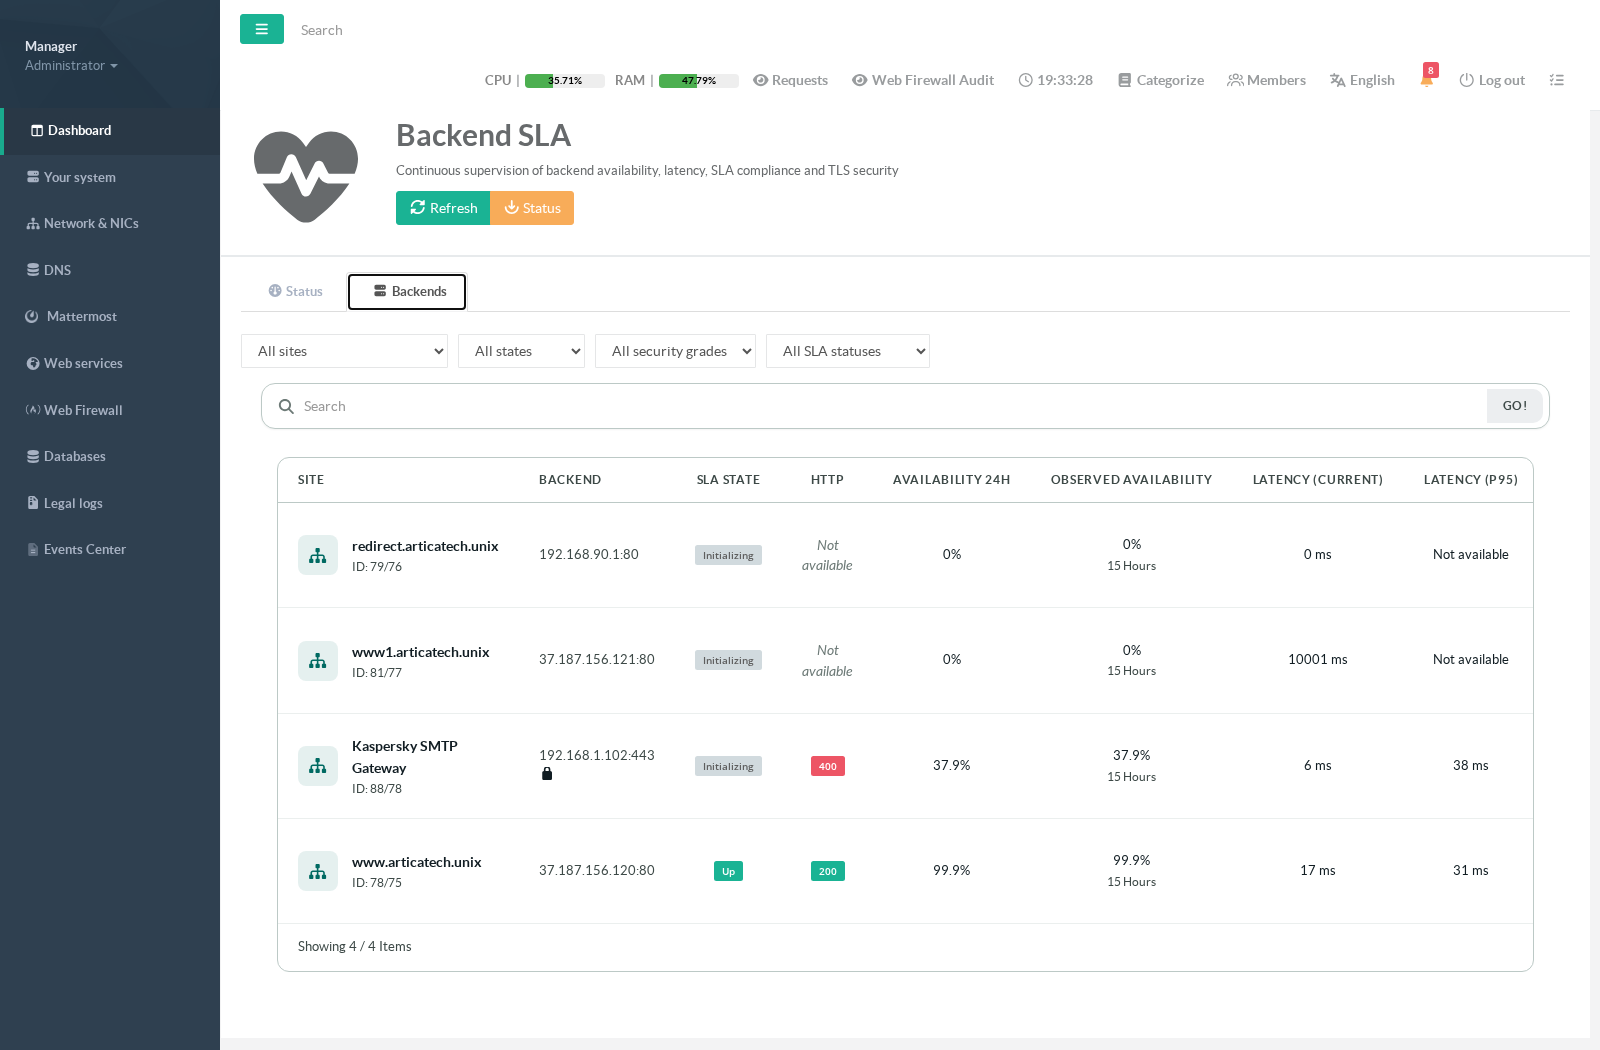
The second tab lists every supervised backend with its state, its availability, its latency and its security grade, with a search box and filters by site, state, grade and SLA compliance.
¶ Per-backend statistics
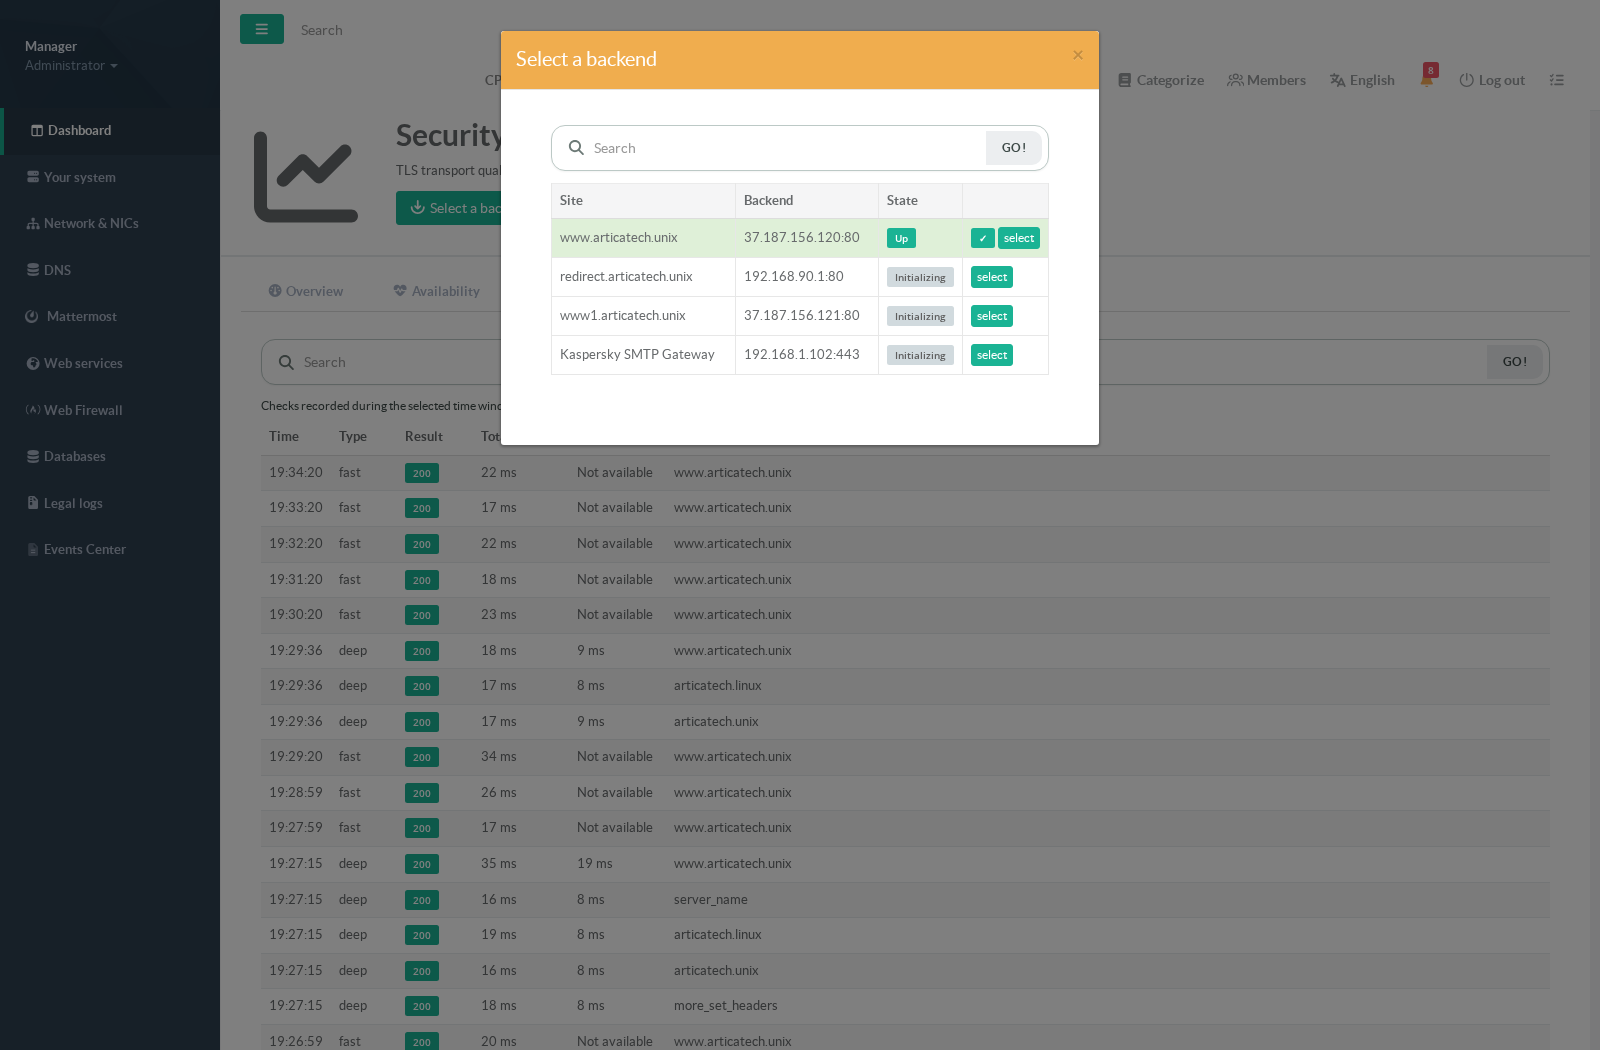
Clicking a backend opens its detail page. You can also open the page directly and pick a backend from the header button — the choice is remembered for your next visits.
¶ Overview
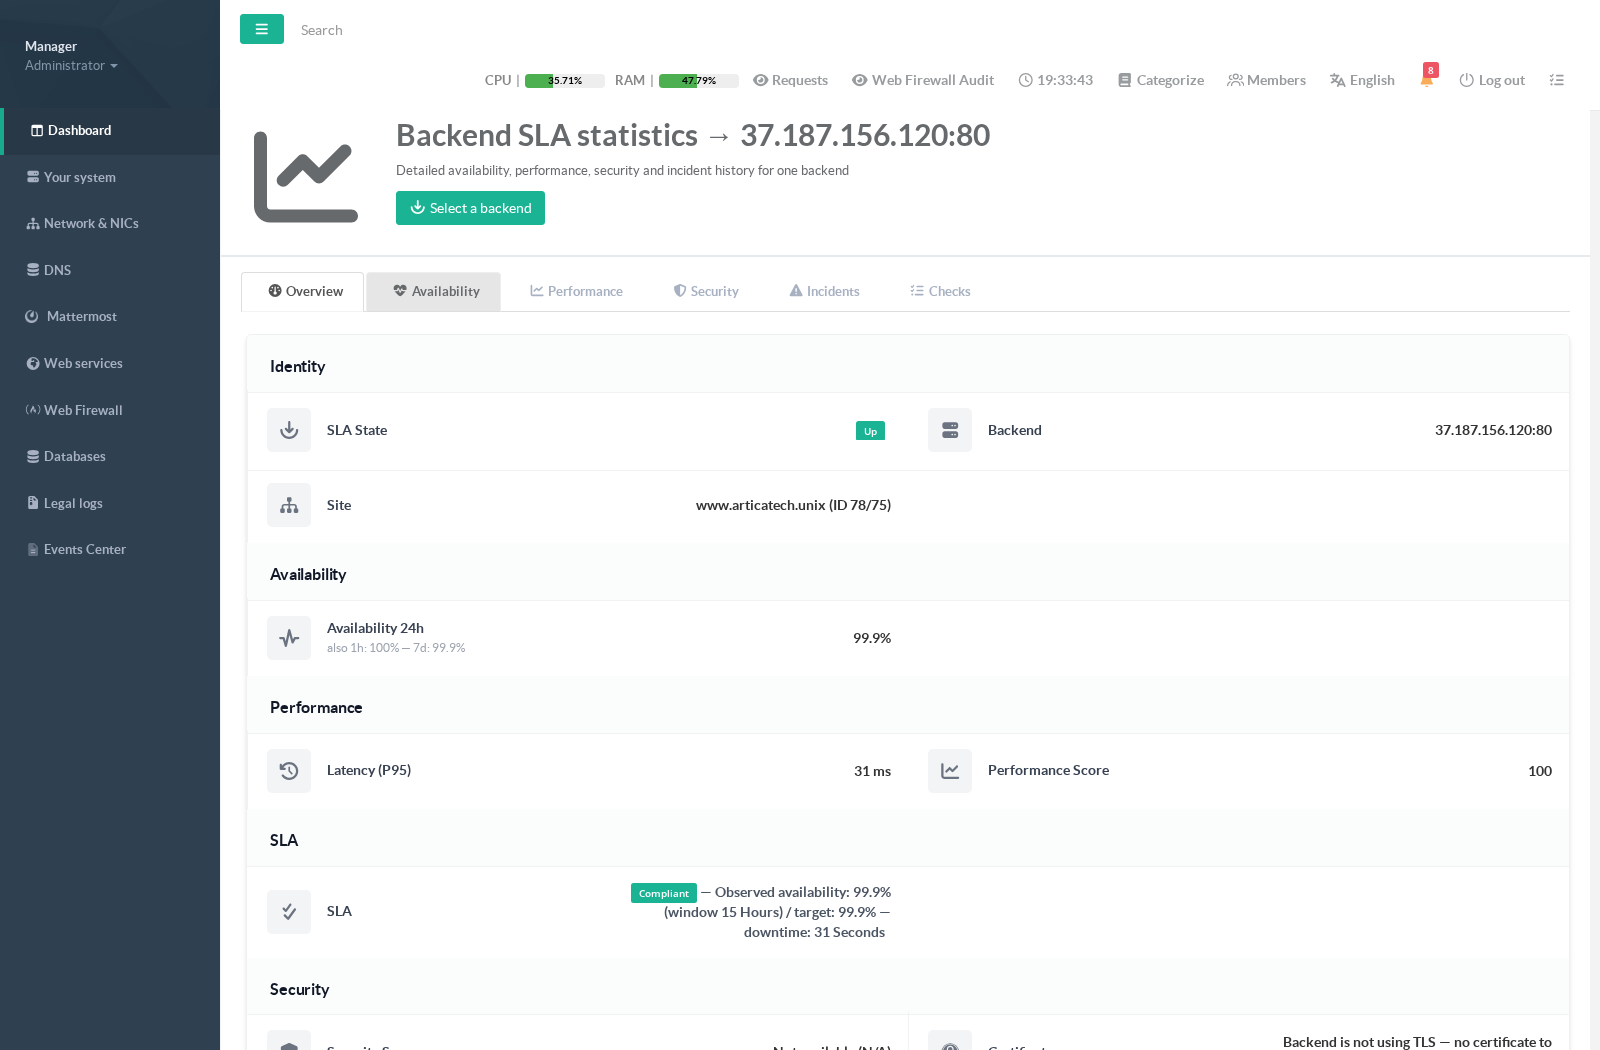
The identity card of the backend: state, site, availability over the three windows, latency, performance score, SLA verdict, security score, certificate and last incident.
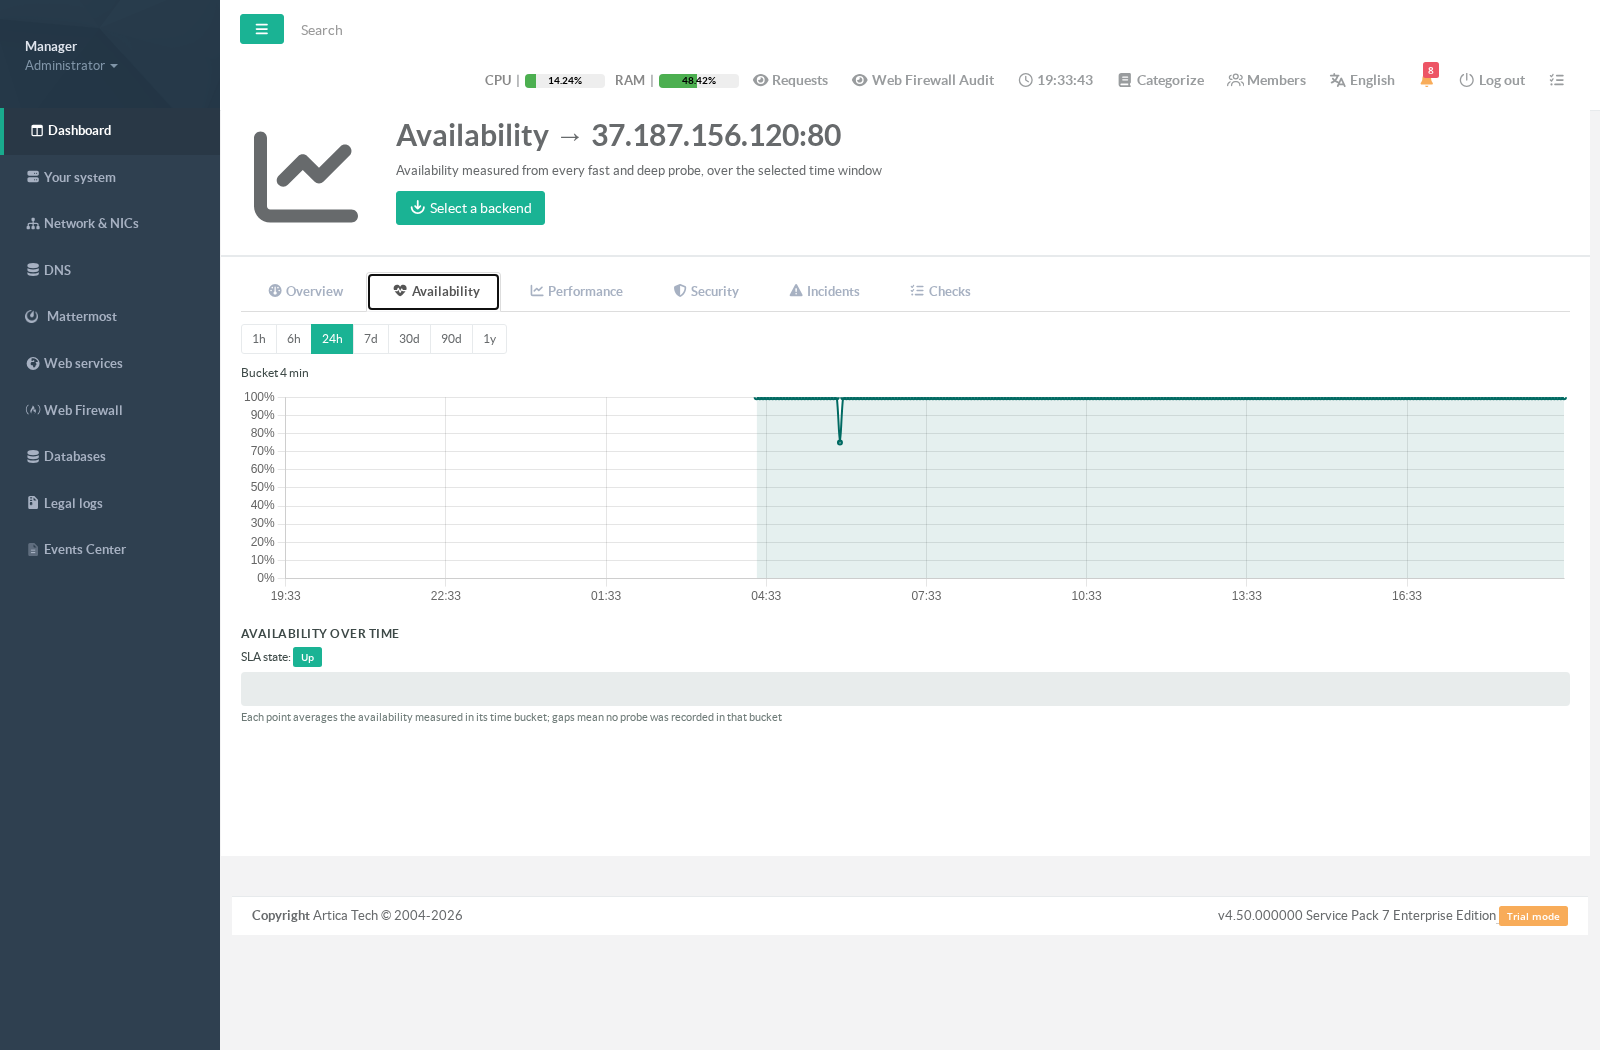
¶ Availability
Availability over time, plus the incident timeline. Periods with no measurement are drawn as gaps, never as zero — an interruption of measurement must not look like an interruption of service.
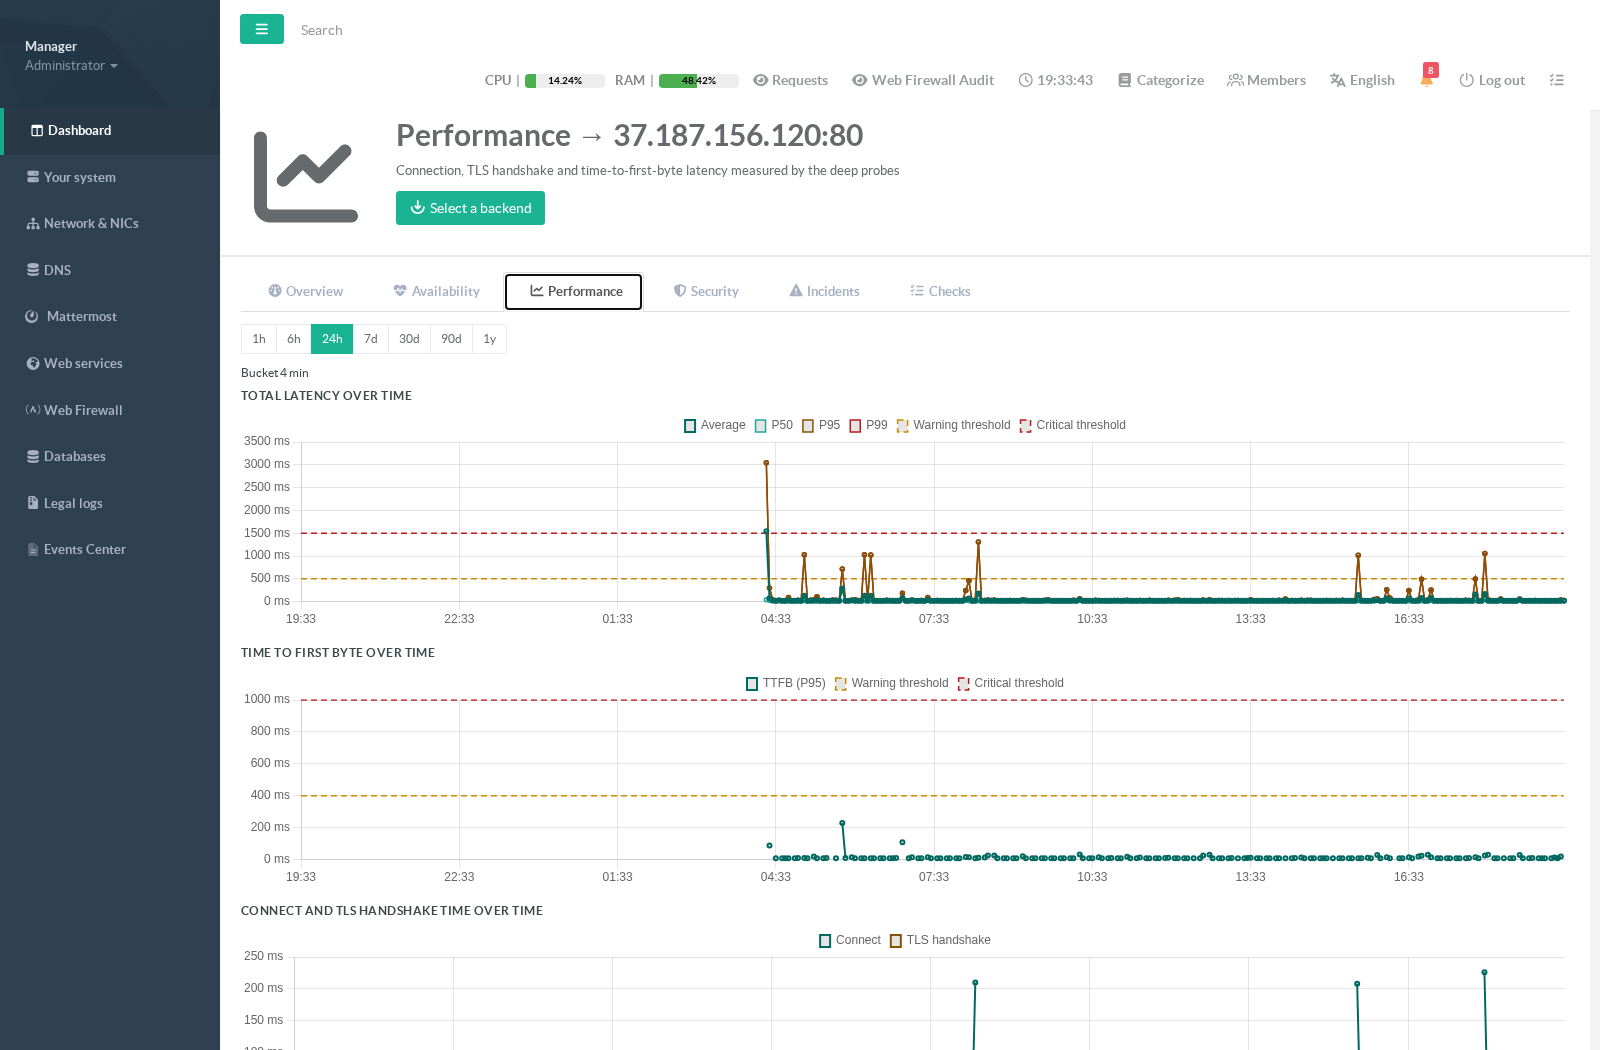
¶ Performance
Latency percentiles over time and the phase breakdown: DNS, connection, TLS handshake, time-to-first-byte. The warning and critical thresholds of the backend are drawn on the chart, so a slow period is read against the threshold that actually applies to it.
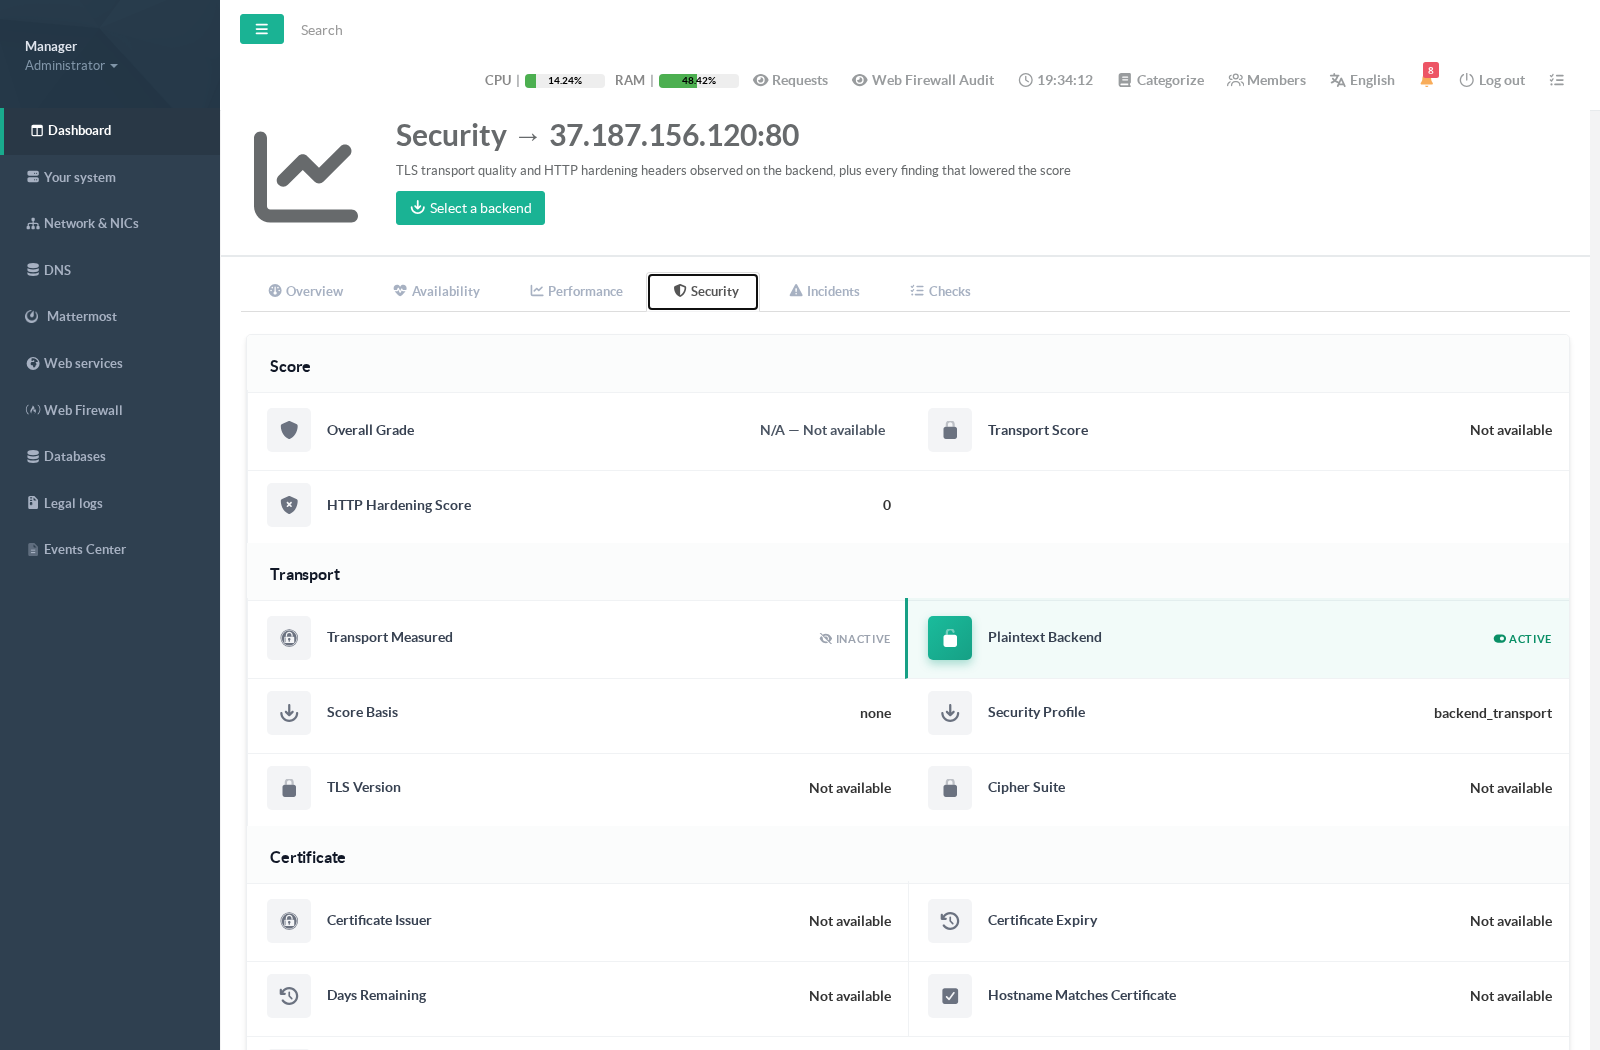
¶ Security
The transport and hardening scores, the negotiated TLS version and cipher suite, the certificate details, and the list of findings — each with an explanation and a recommendation.
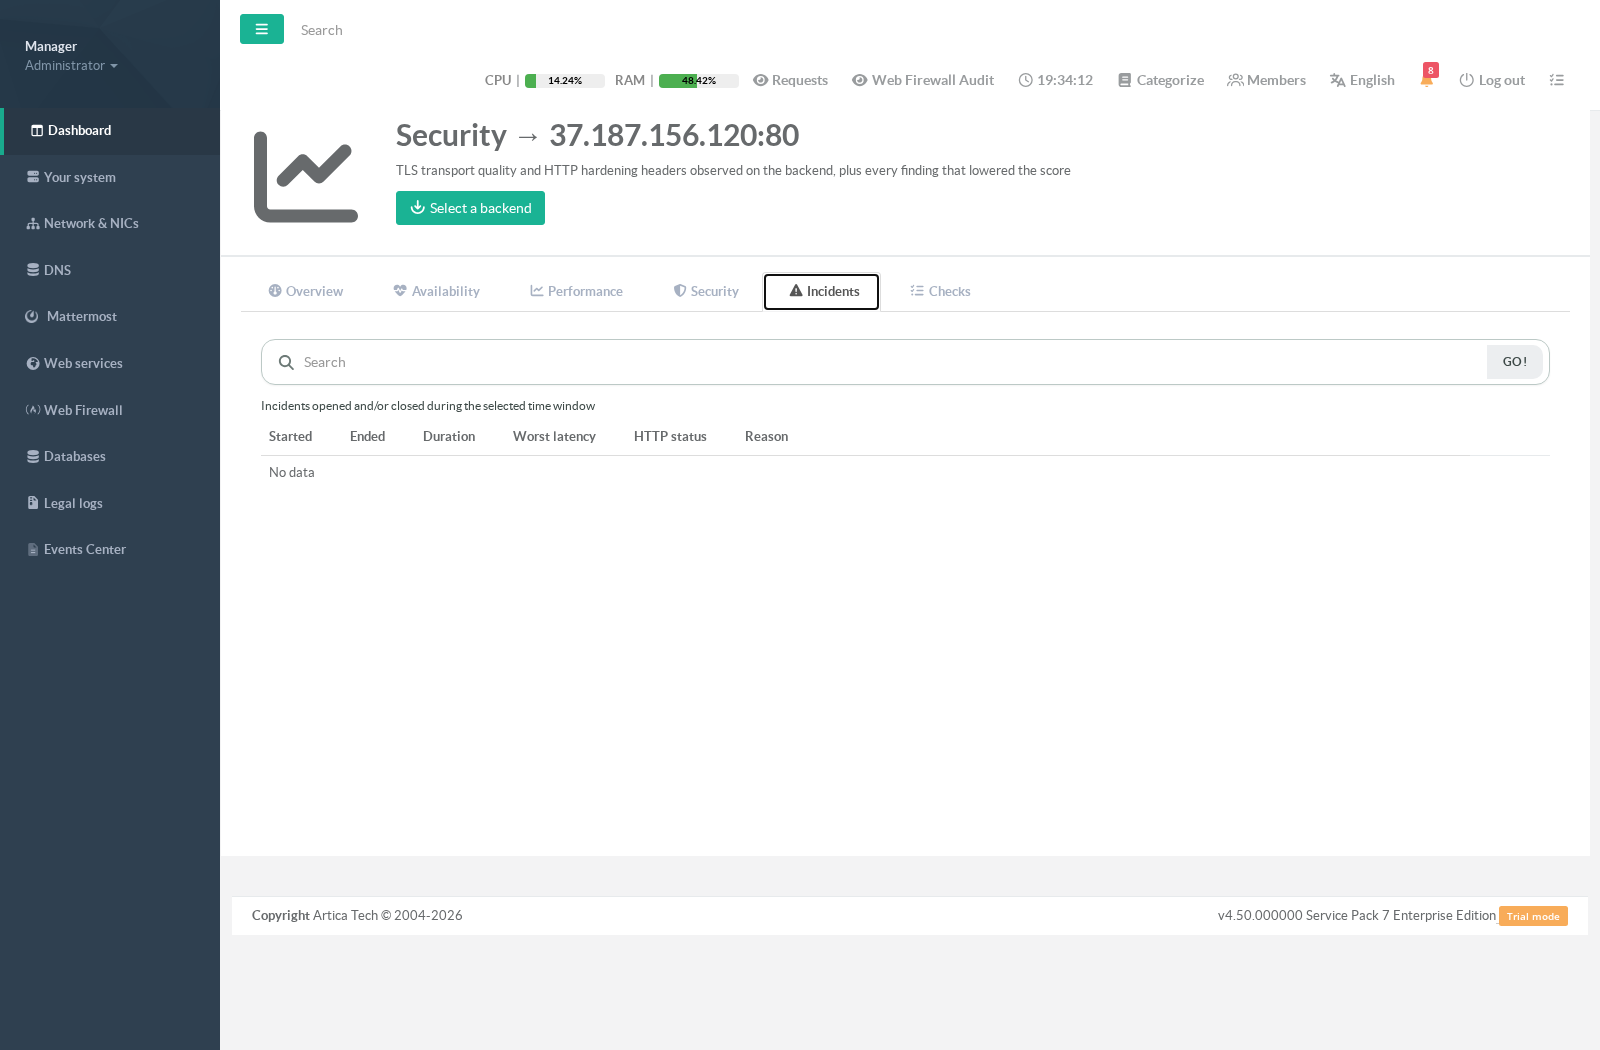
¶ Incidents
Every outage with its start, end, duration, severity and reason.
¶ Checks
The individual measurements — the raw material behind every other tab. Useful when you need to point at one exact probe at one exact minute.
¶ Reading the figures: "not available" is not zero
This is the single most important convention of the whole feature, and it is worth one minute of your time.
An indicator that was not measured is displayed as Not available — never as 0. The distinction is not cosmetic:
- Availability "Not available" means no sample exists for that window. Availability "0 %" means samples exist and they all failed. One is a blind thermometer, the other is a real outage.
- Latency "Not available" means no successful measurement exists yet — you cannot compute a percentile out of failures.
- Security grade "N/A" means there was nothing to grade — a plaintext backend with no TLS requirement, for instance. It does not mean the backend failed its security check.
- SLA compliance is a three-state value: compliant, not compliant, or not measurable. It is never silently reported as "not compliant" because measurement was missing.
A real zero is always shown as a zero — a genuinely dead backend reads 0 %, and a certificate expiring today reads 0 days. What you never get is a fabricated figure standing in for a missing one.
¶ SLA compliance
Each backend is compared against a target availability of 99.9 % by default. The page reports:
- the observed availability, and the window it actually covers — a module started an hour ago reports one hour, and says so;
- the target;
- the downtime accumulated, expressed in seconds, minutes, hours or days;
- the error budget consumed.
¶ Security scoring
Deep probes grade backend TLS on a 0-100 scale, rendered as a letter: A from 90, B from 80, C from 65, D from 50, F below. Crossing the minimum acceptable score (80 by default) moves the backend to Degraded.
Two grading profiles exist:
- backend_transport (default) — grades the transport only: protocol, cipher, certificate. This is the right profile for an internal backend, where Artica itself is responsible for the public security headers.
- web_hardening — also grades the HTTP security headers returned by the backend. Use it when the backend is expected to be a hardened public endpoint in its own right.
¶ Settings and data retention
- There is no enable switch. Backend supervision is always active.
- BackendSLARetentionDays — how long time-stamped records are kept. 7 days by default. This covers the raw measurements and the incident history; raise it if you need to look further back locally. The last security assessment of each backend is not time-based and is kept regardless.
- If you need history beyond the local retention window, forward it to an Artica SIEM appliance (see below) rather than growing the local database indefinitely.
- Measurements are stored locally on the appliance, in a dedicated database, purged and compacted once a day.
- Default policy values: probe path
/, deep interval 300 s, timeout 5 s, expected status200-399, target availability 99.9 %, latency warning/critical 500/1500 ms, TTFB warning/critical 400/1000 ms, minimum security score 80, three failures to declare an outage, two successes to recover.
¶ Sending the history to an Artica SIEM appliance
If you operate an Artica SIEM appliance, the reverse proxy can forward every deep measurement to it over mutual-TLS, alongside its request and WAF events. The appliance then holds a long-term history that outlives the local retention, and the statistics page joins it automatically.
The rule the page follows is strict and worth knowing: the SIEM is a source of history, never of state. Whether a backend is up right now always comes from the appliance you are looking at. And if the SIEM cannot be reached, the page says local-fallback rather than silently showing you less data than you think.
¶ REST API
Everything the pages display is available on the reverse-proxy daemon socket, for your own tooling:
GET /backend-sla/status— module state, number of monitors, scheduler statisticsGET /backend-sla/backends— every supervised backend with its summaryGET /backend-sla/backends/{serviceid}— the same, restricted to one websiteGET /backend-sla/summary/{serviceid}/{backendid}— one backend's identity cardGET /backend-sla/metrics/{serviceid}/{backendid}— aggregates over a windowGET /backend-sla/series/{serviceid}/{backendid}— the time series behind the chartsGET /backend-sla/security/{serviceid}/{backendid}— the last security assessmentGET /backend-sla/incidents/{serviceid}/{backendid}— incident historyGET /backend-sla/dashboard— the fleet-wide figures behind the tilesGET /backend-sla/data-source— which source is currently being read, and the fallback counterPOST /backend-sla/run/{serviceid}/{backendid}— run a deep probe immediately
Numeric fields follow the convention described above: -1 means "not measured", and 0 means a measured zero. Any consumer that averages these values must exclude -1 first, and must filter on probe_type = "deep" before averaging a phase — fast samples do not measure phases.
¶ Current limitations
- Supervision policies are not editable from the interface yet.
Thresholds, probe path, expected status and target availability currently use the default values listed above for every backend.
Per-backend and per-website policies exist in the engine and will be exposed in a later release.