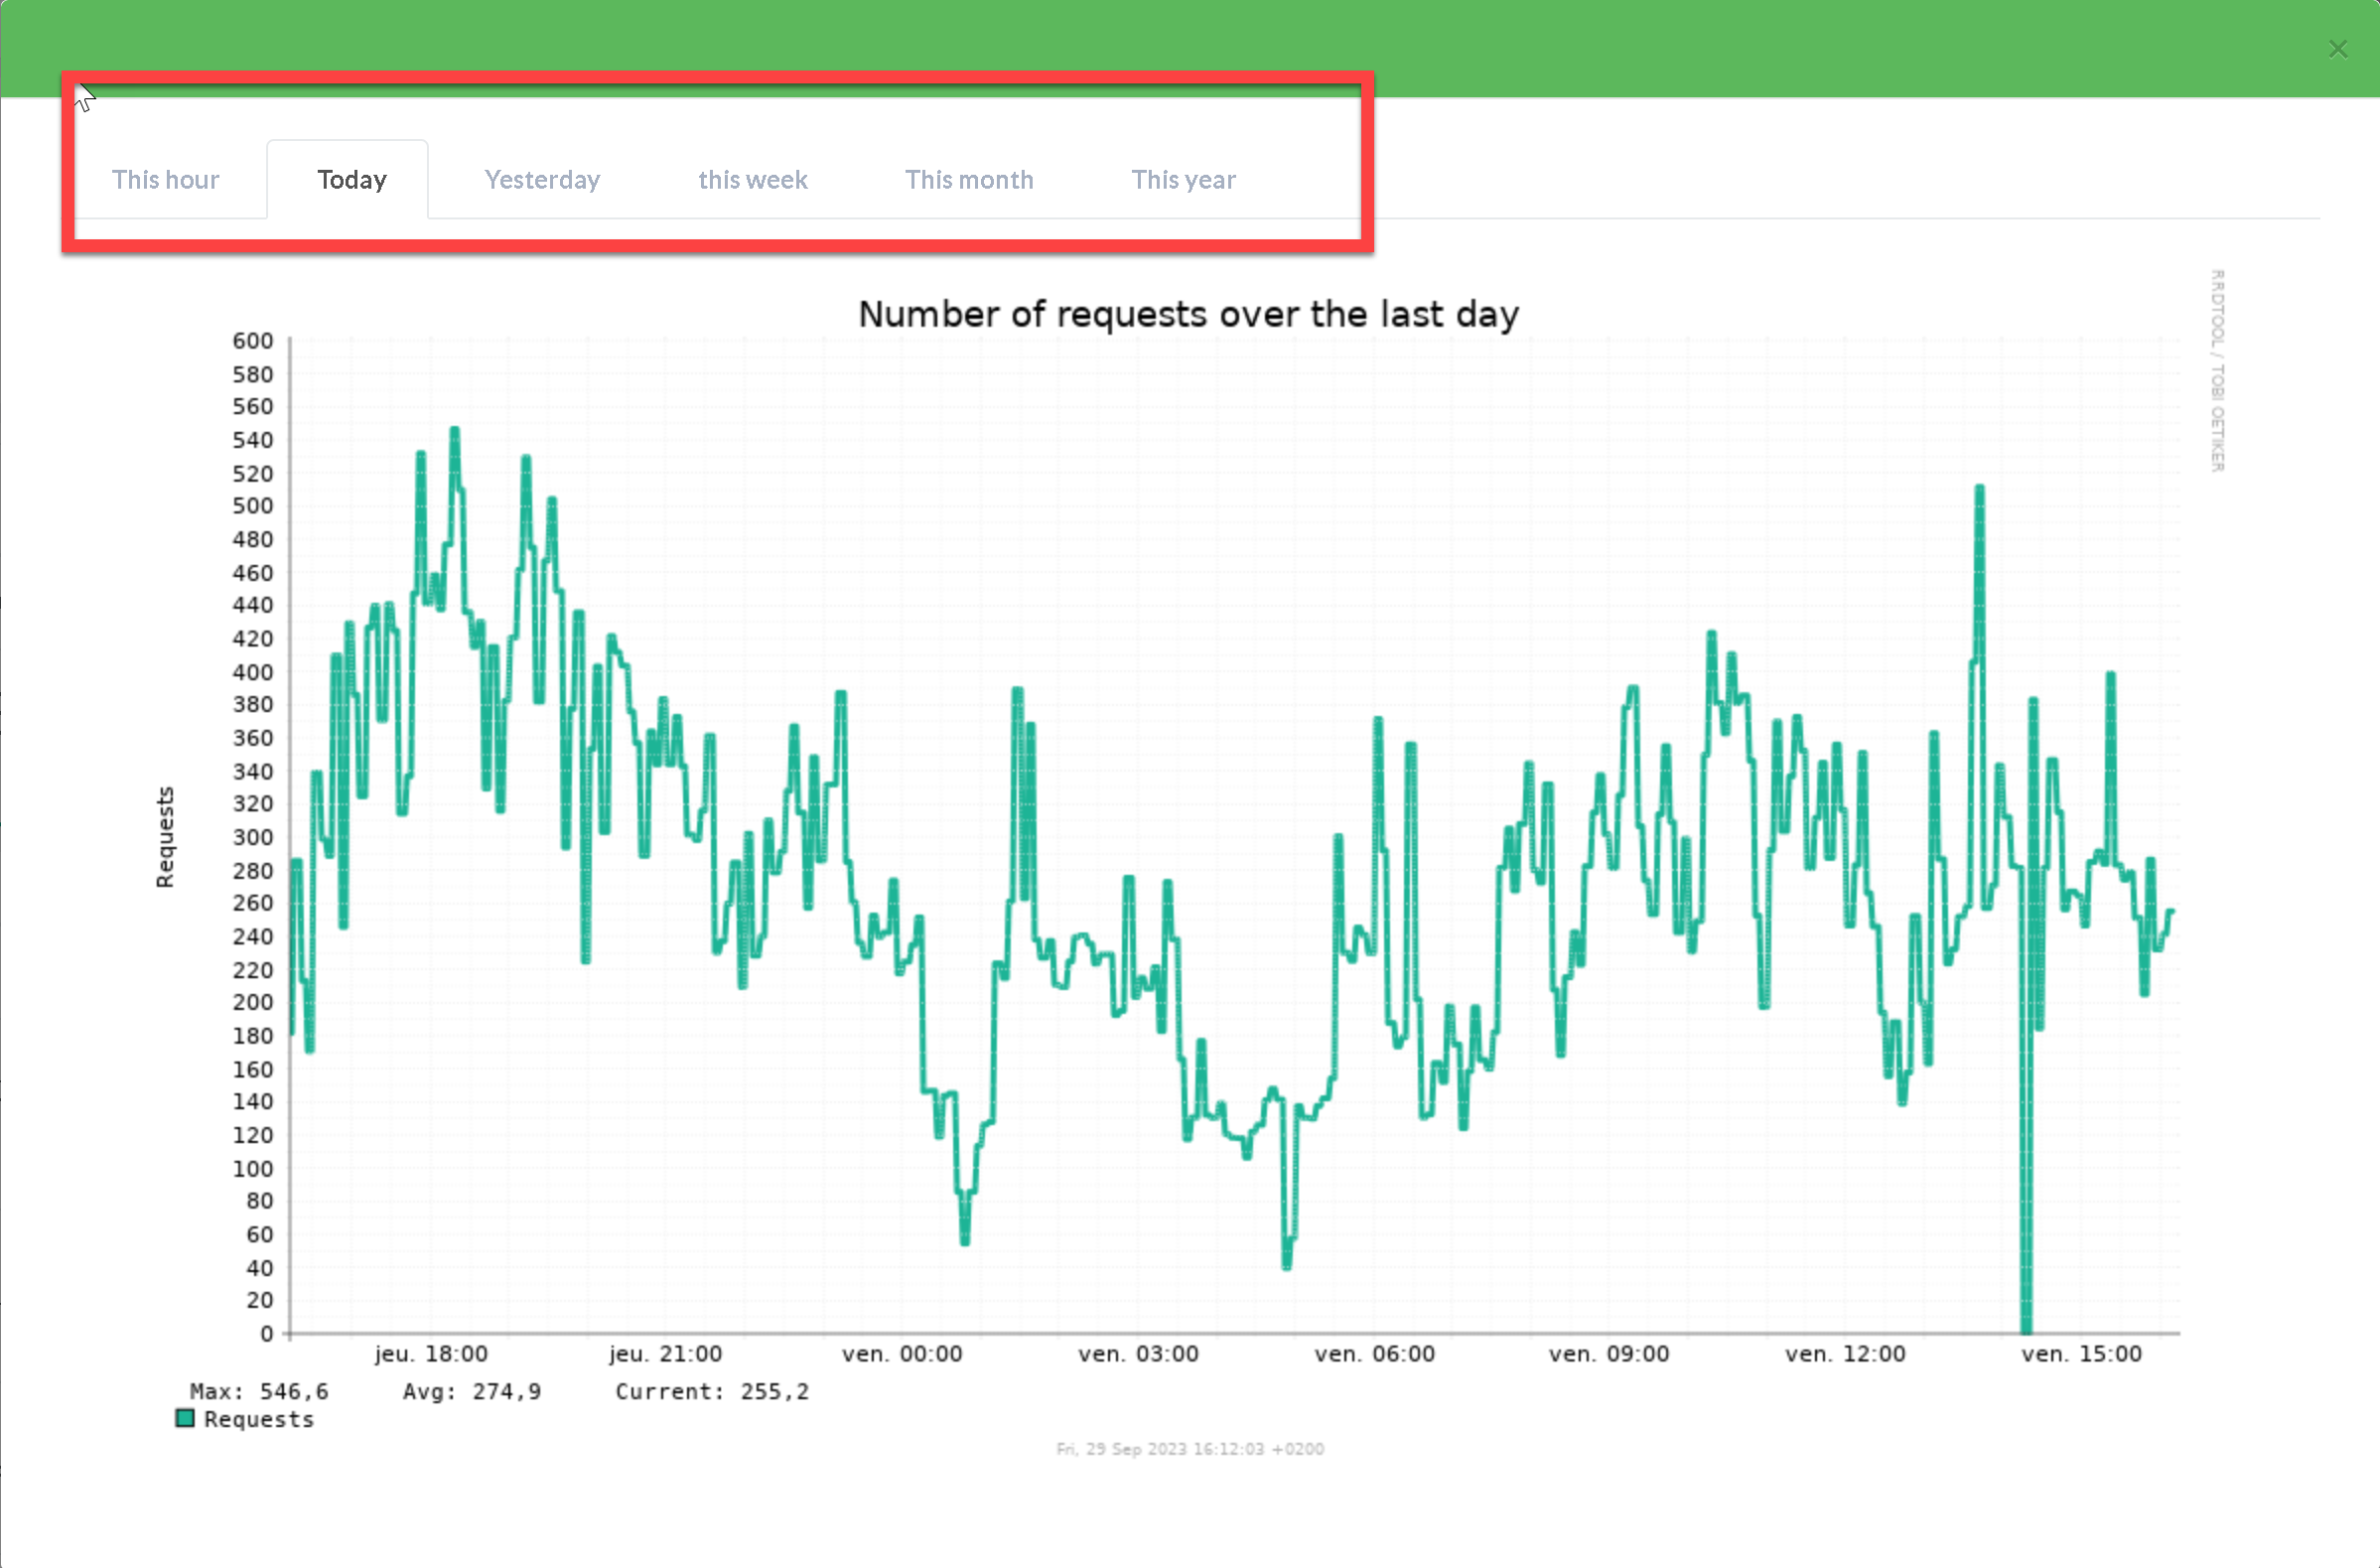
Artica produces central data on the number of simultaneous connections and the number of requests that your reverse-proxy has generated over a period of one year.
- In the dashboard, take a look of the 2 numbers that represents the current number of queries and the number of connections.
- Click on on of the number link

- A new layer is displayed with Tabs
Tabs allow you to view graphs according to 6 periods:
- Current time ( hourly )
- Yesterday
- Current day ( daily )
- Weekly
- Monthly
- Yearly
