A tour of the EdgeGuard Central console: what each screen is for, with screenshots of the running product. Every section links to the page that documents it in full.
¶ How the console works
The console is the management plane. Nothing here inspects traffic: the decisions are made by the agents at the edge, and this is where the policy they follow is written and where what they did is read.
Configuration is a hierarchy — Global → Group → Tenant → Path rule — and each level inherits from the one above unless it overrides. Everything you change reaches the agents on their next pull, about thirty seconds, and nothing restarts.
This page is a map. Each section says what a screen is for and shows it; the dedicated page linked beneath goes into how it works, what it costs and how to prove it.
¶ Login
Email and password, with multi-factor authentication when the account has it enabled. A suspended organisation is refused here, and told so.
¶ Edge
Where the protected estate is defined: the defaults, the grouping, the sites, and the agents that enforce it.
¶ Dashboard
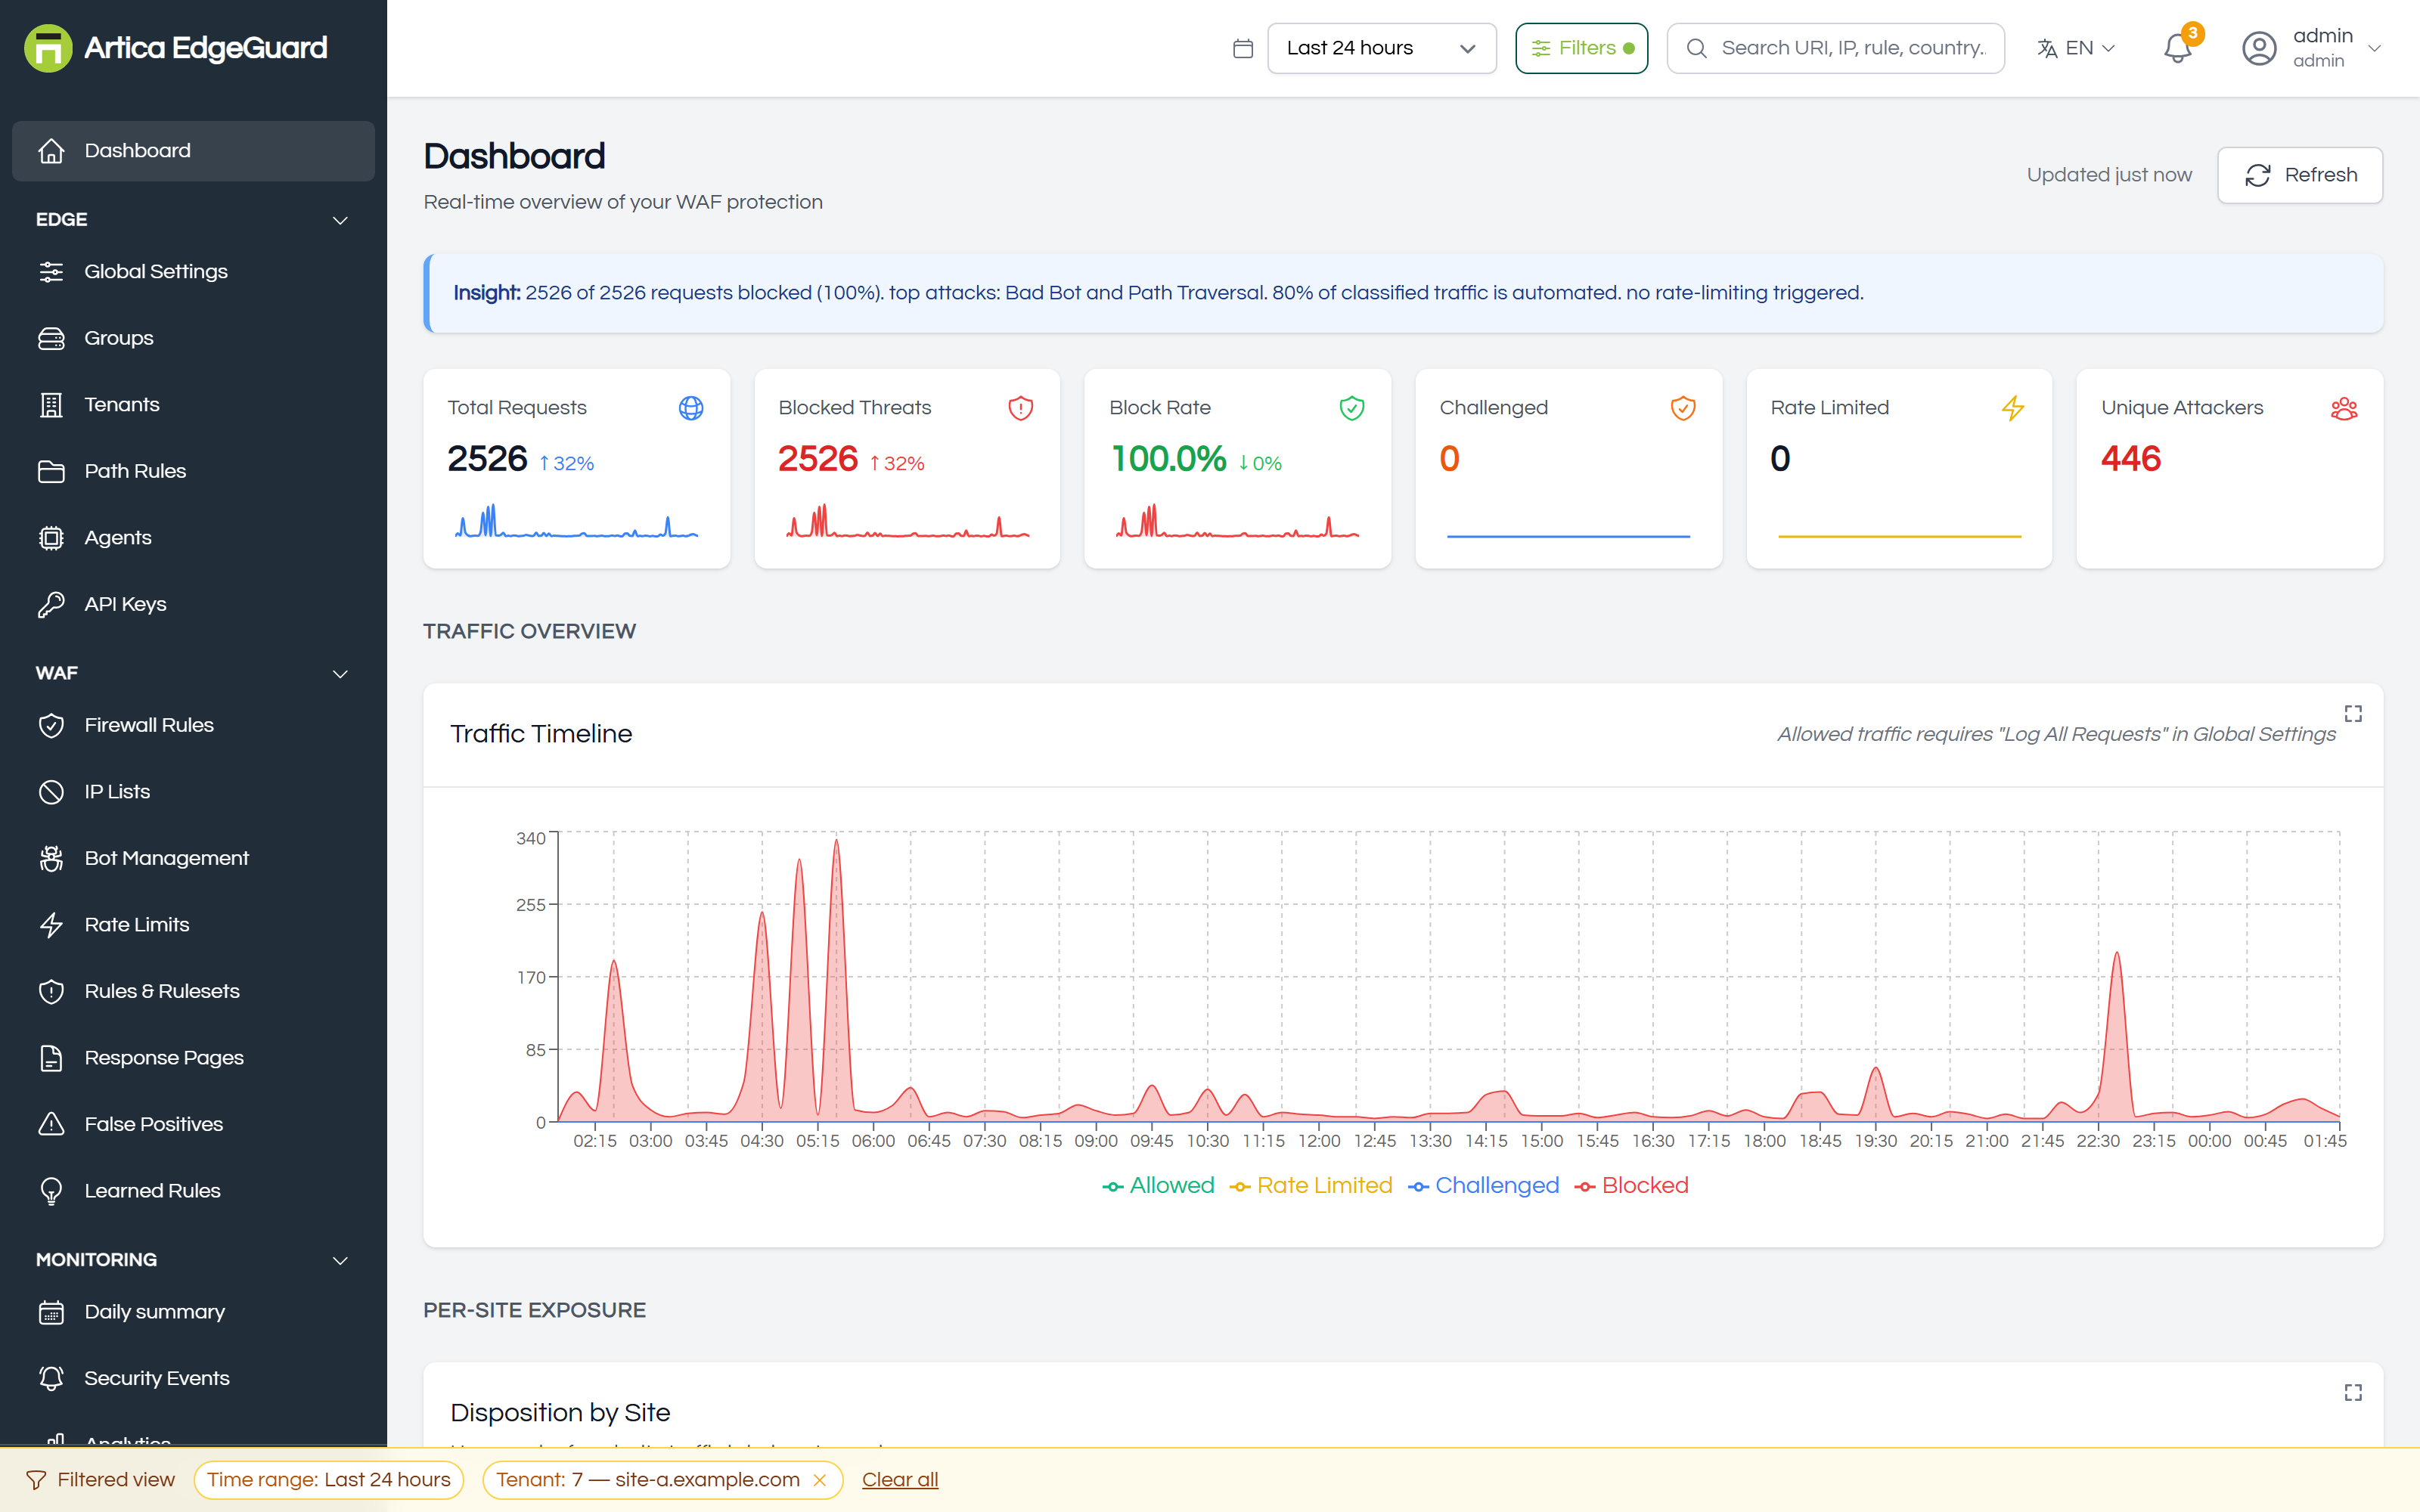
What is happening now, across everything you can see: traffic, refusals, the attacks that fired most, and the sites taking them. Start here in the morning; it answers "is anything on fire" in one screen.
¶ Global Settings
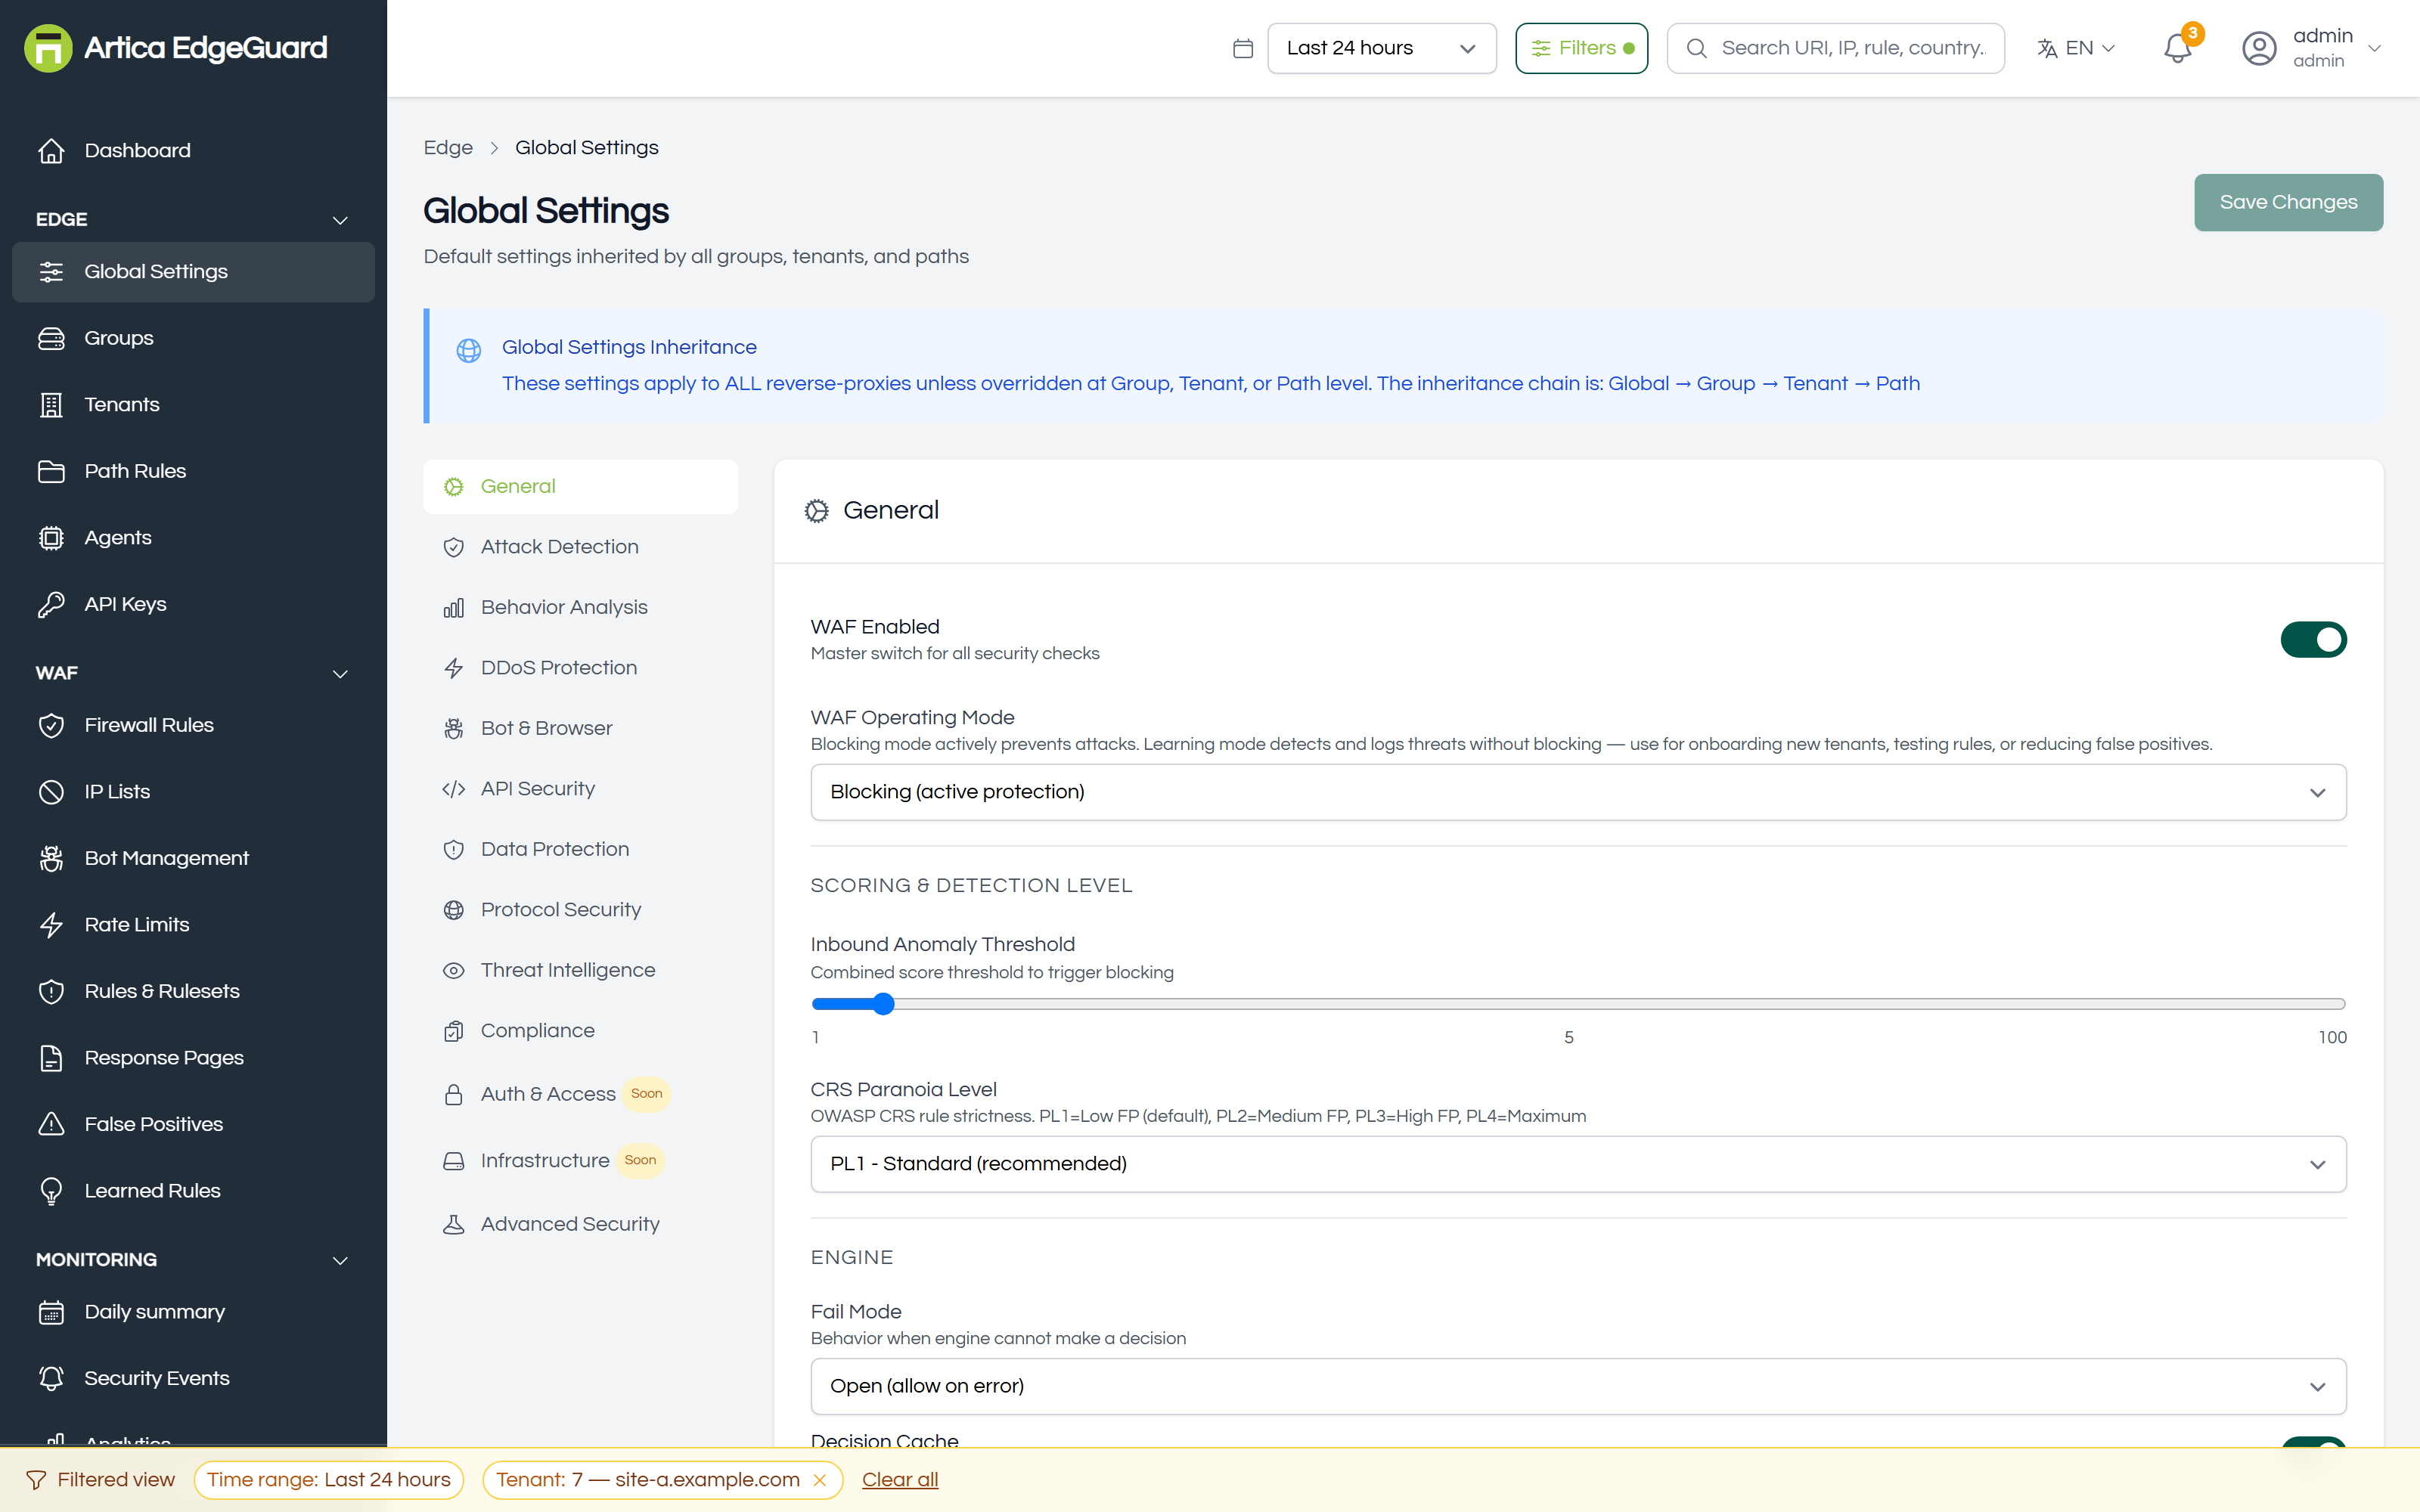
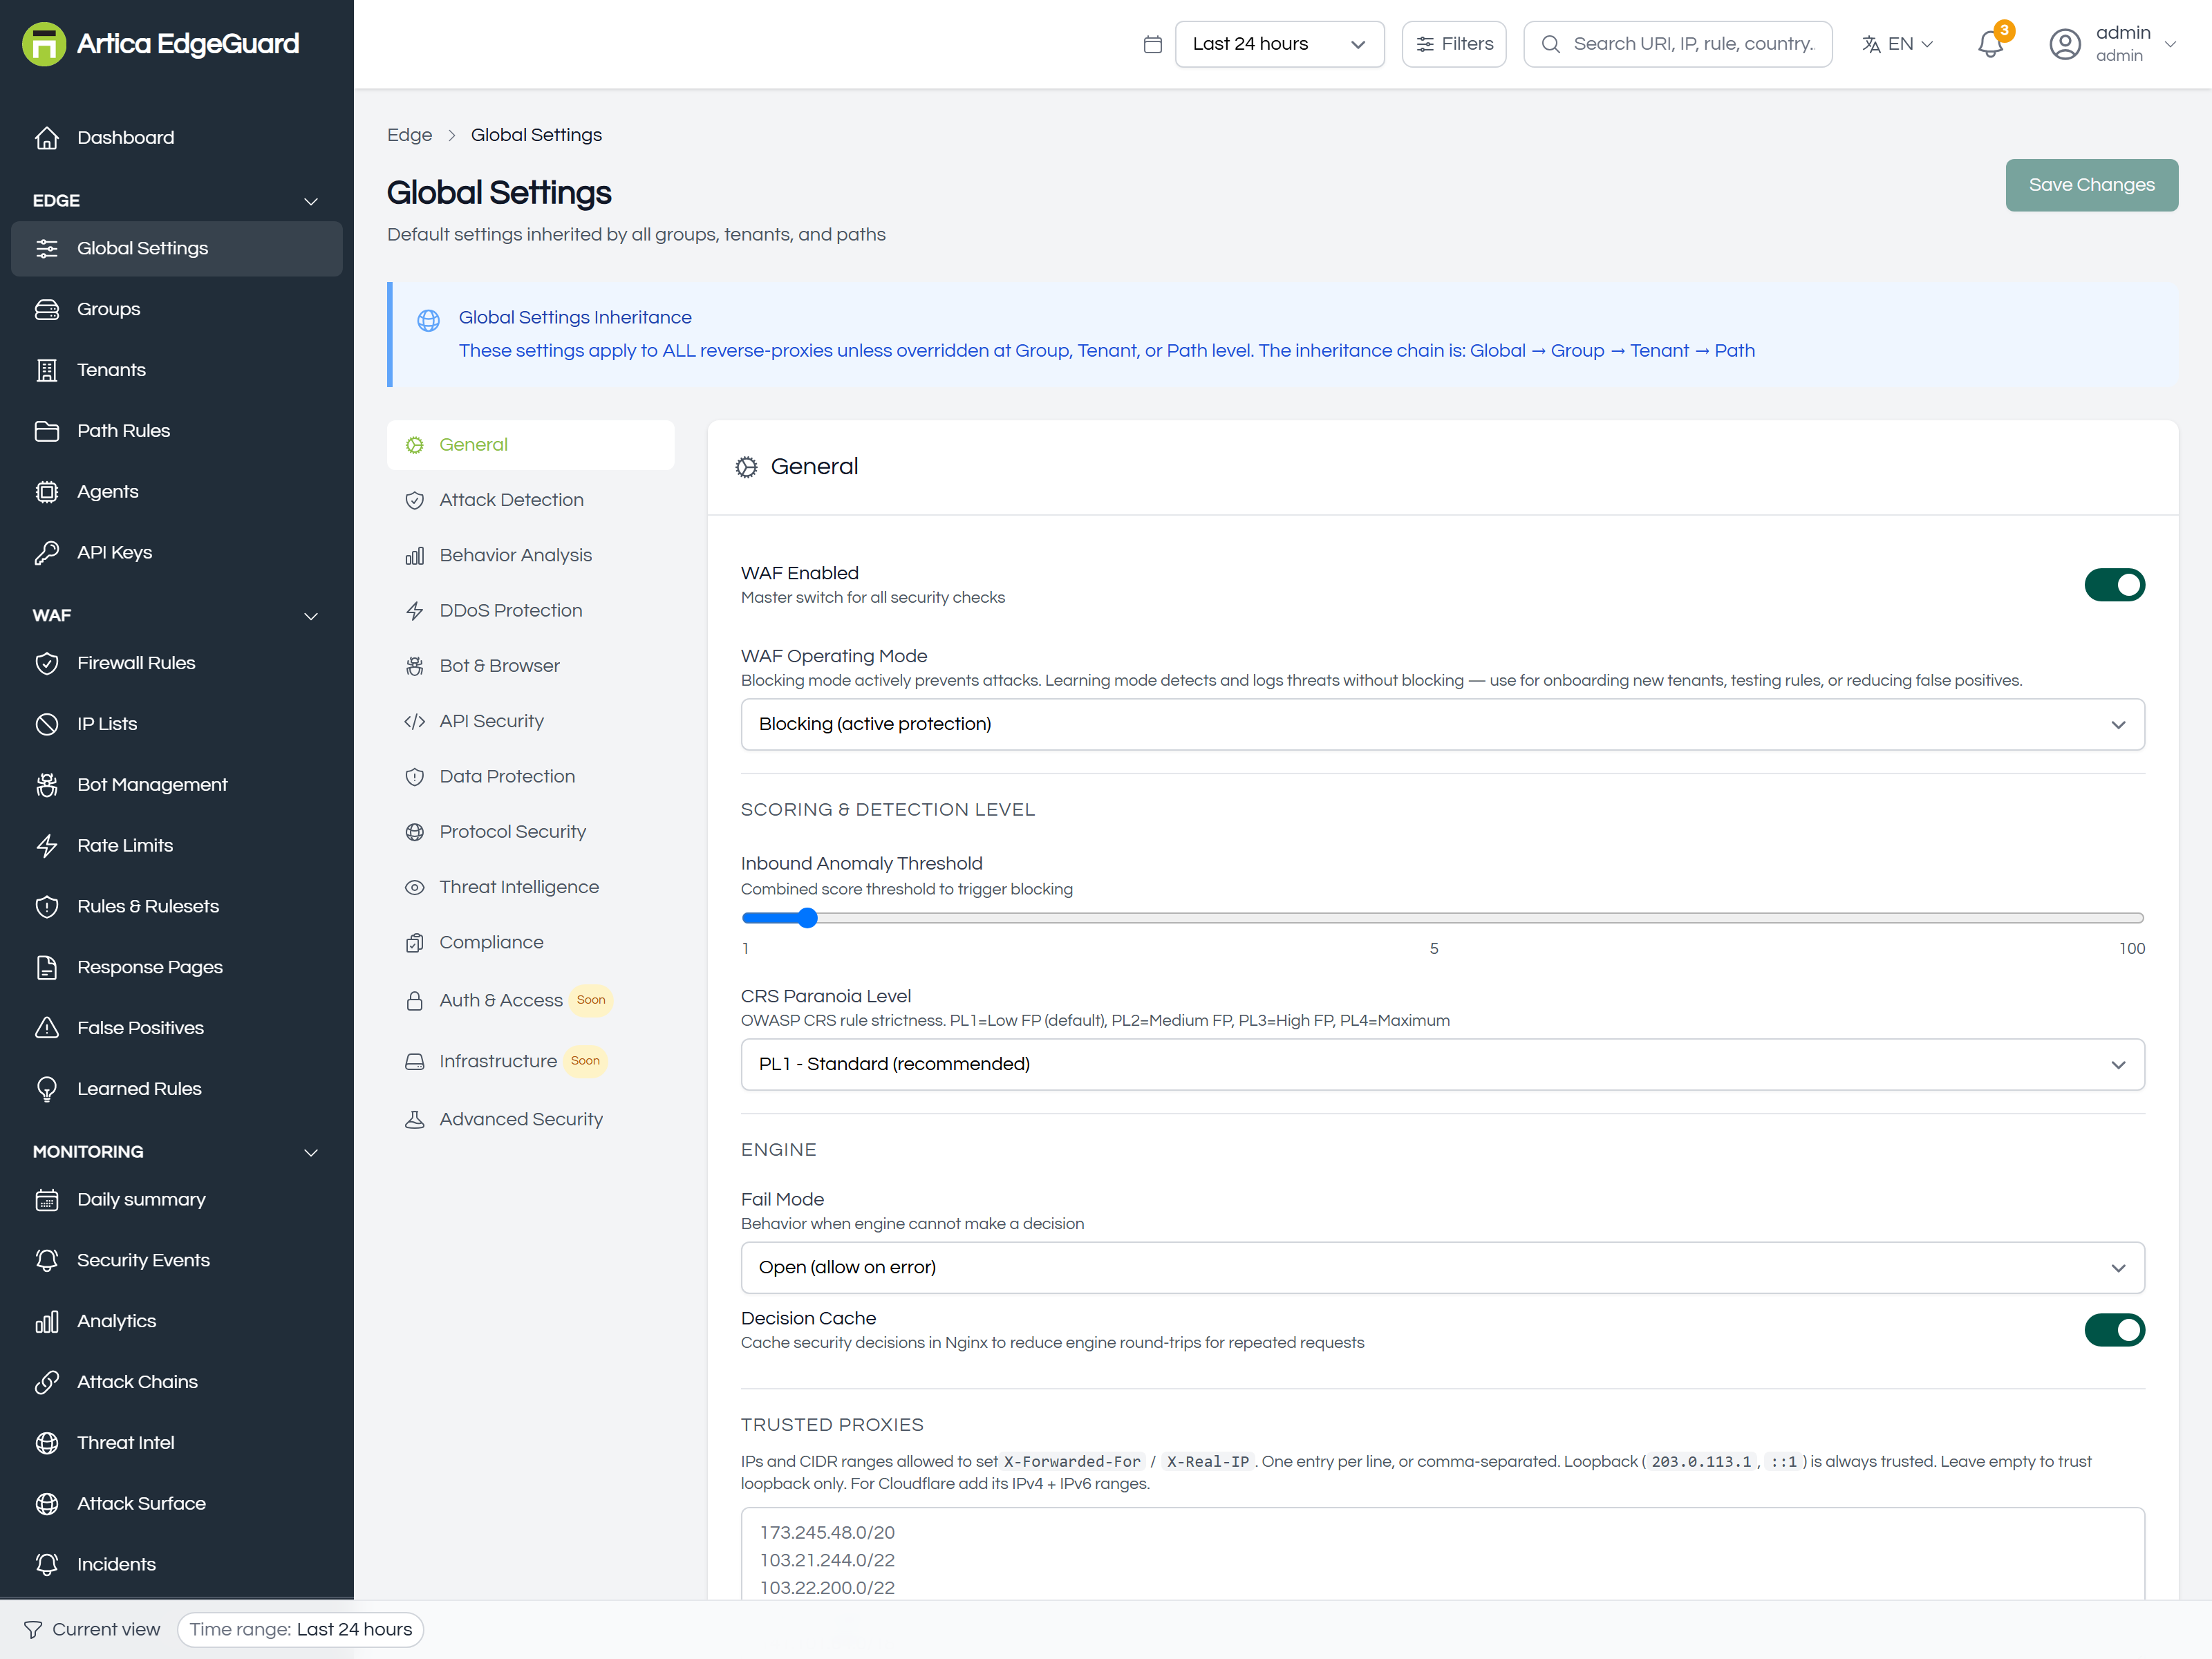
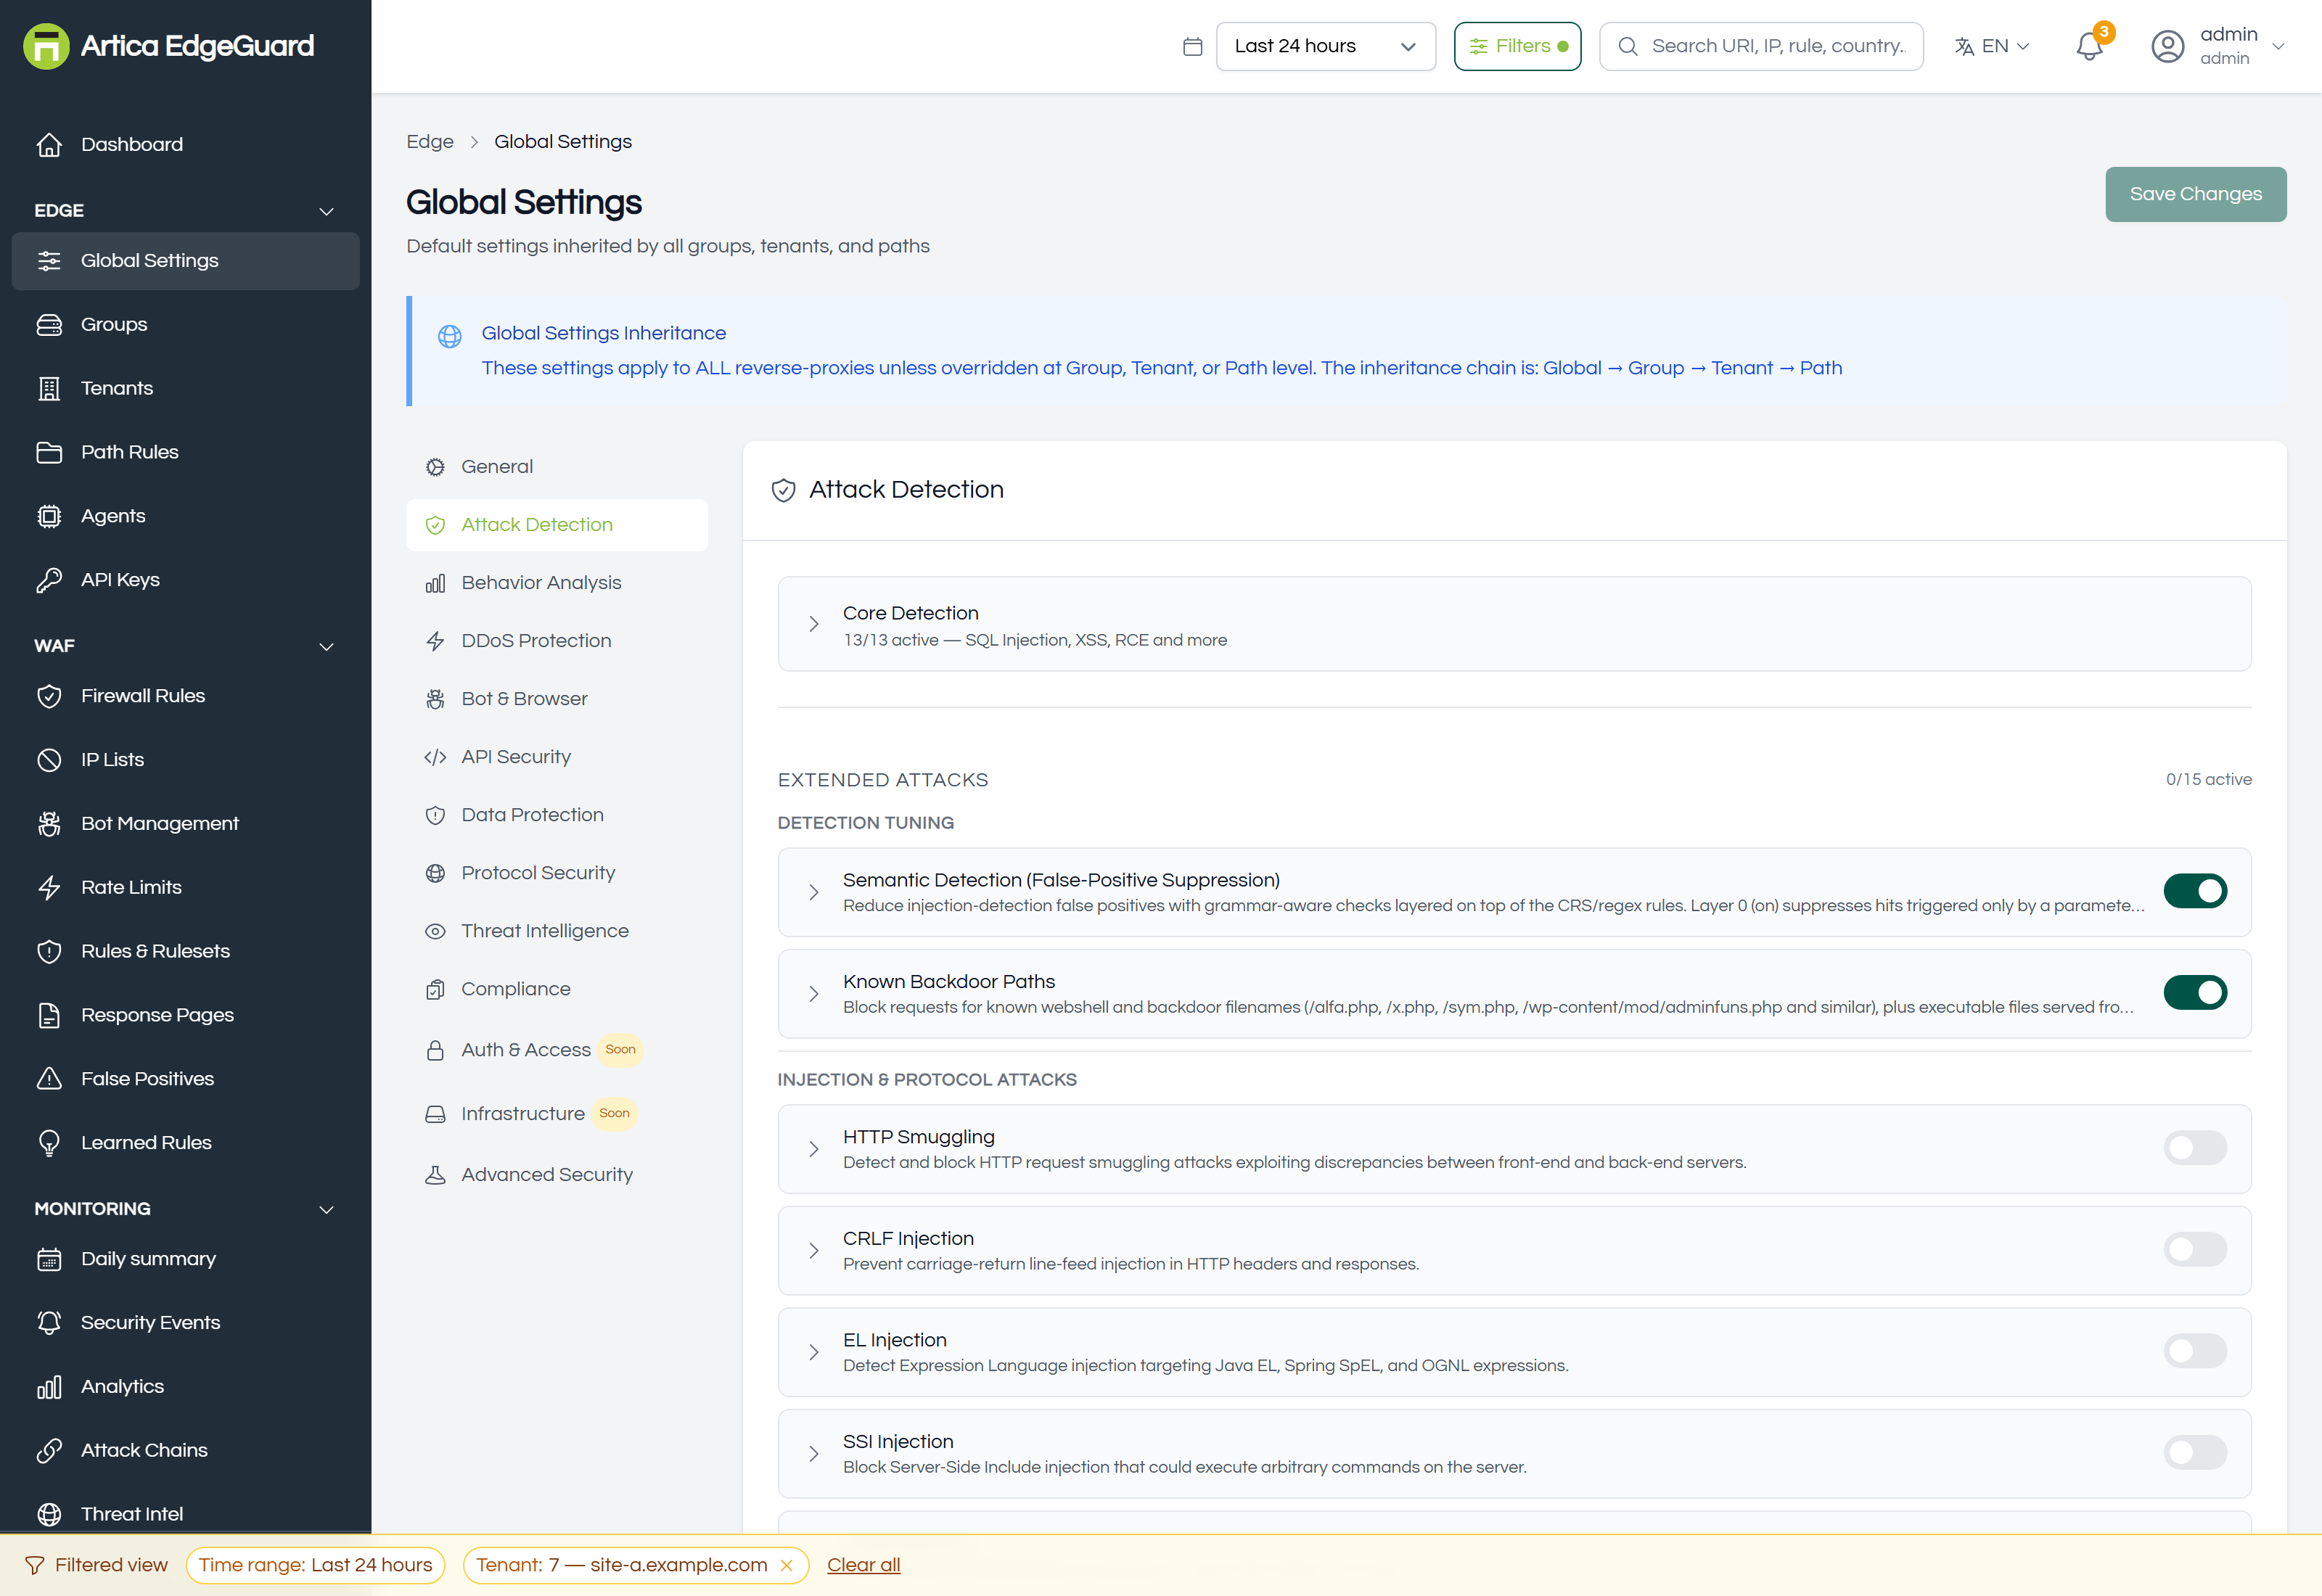
The defaults every site inherits — the master switch, the anomaly threshold and paranoia level, fail mode, trusted proxies — and thirteen tabs of security modules underneath. A site that sets nothing runs exactly this.
Full documentation: EdgeGuard — Global Settings
¶ Groups
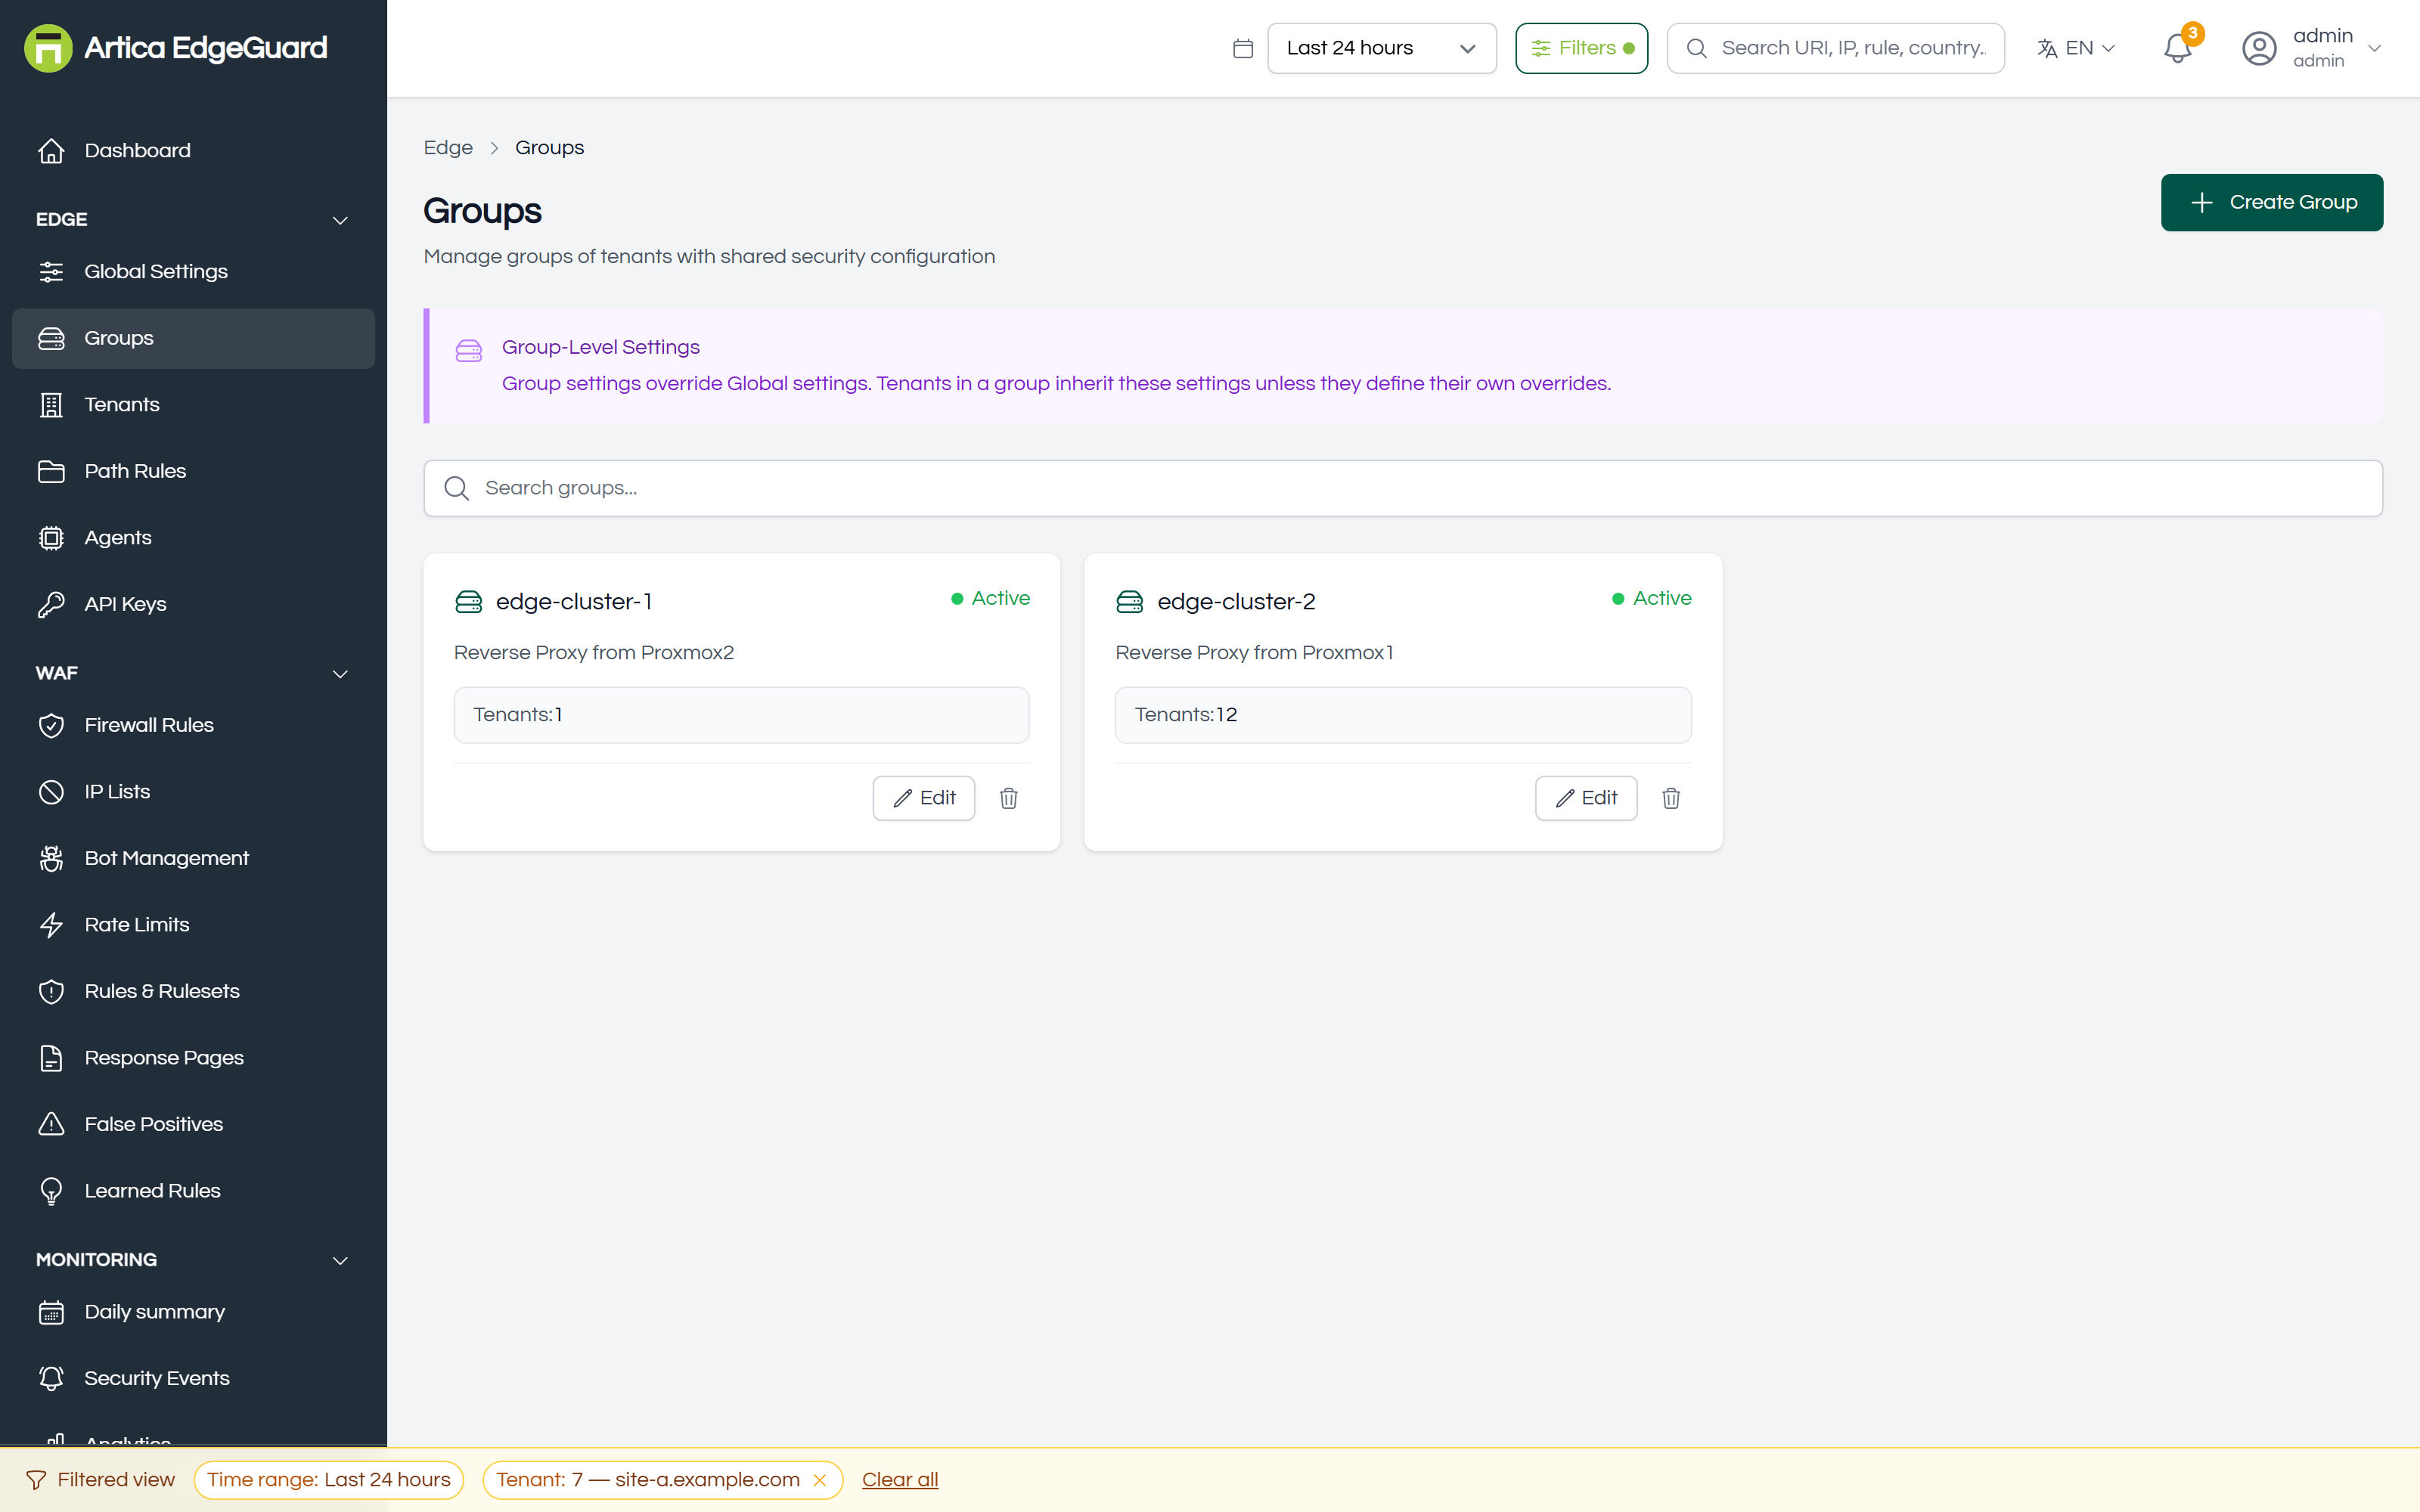
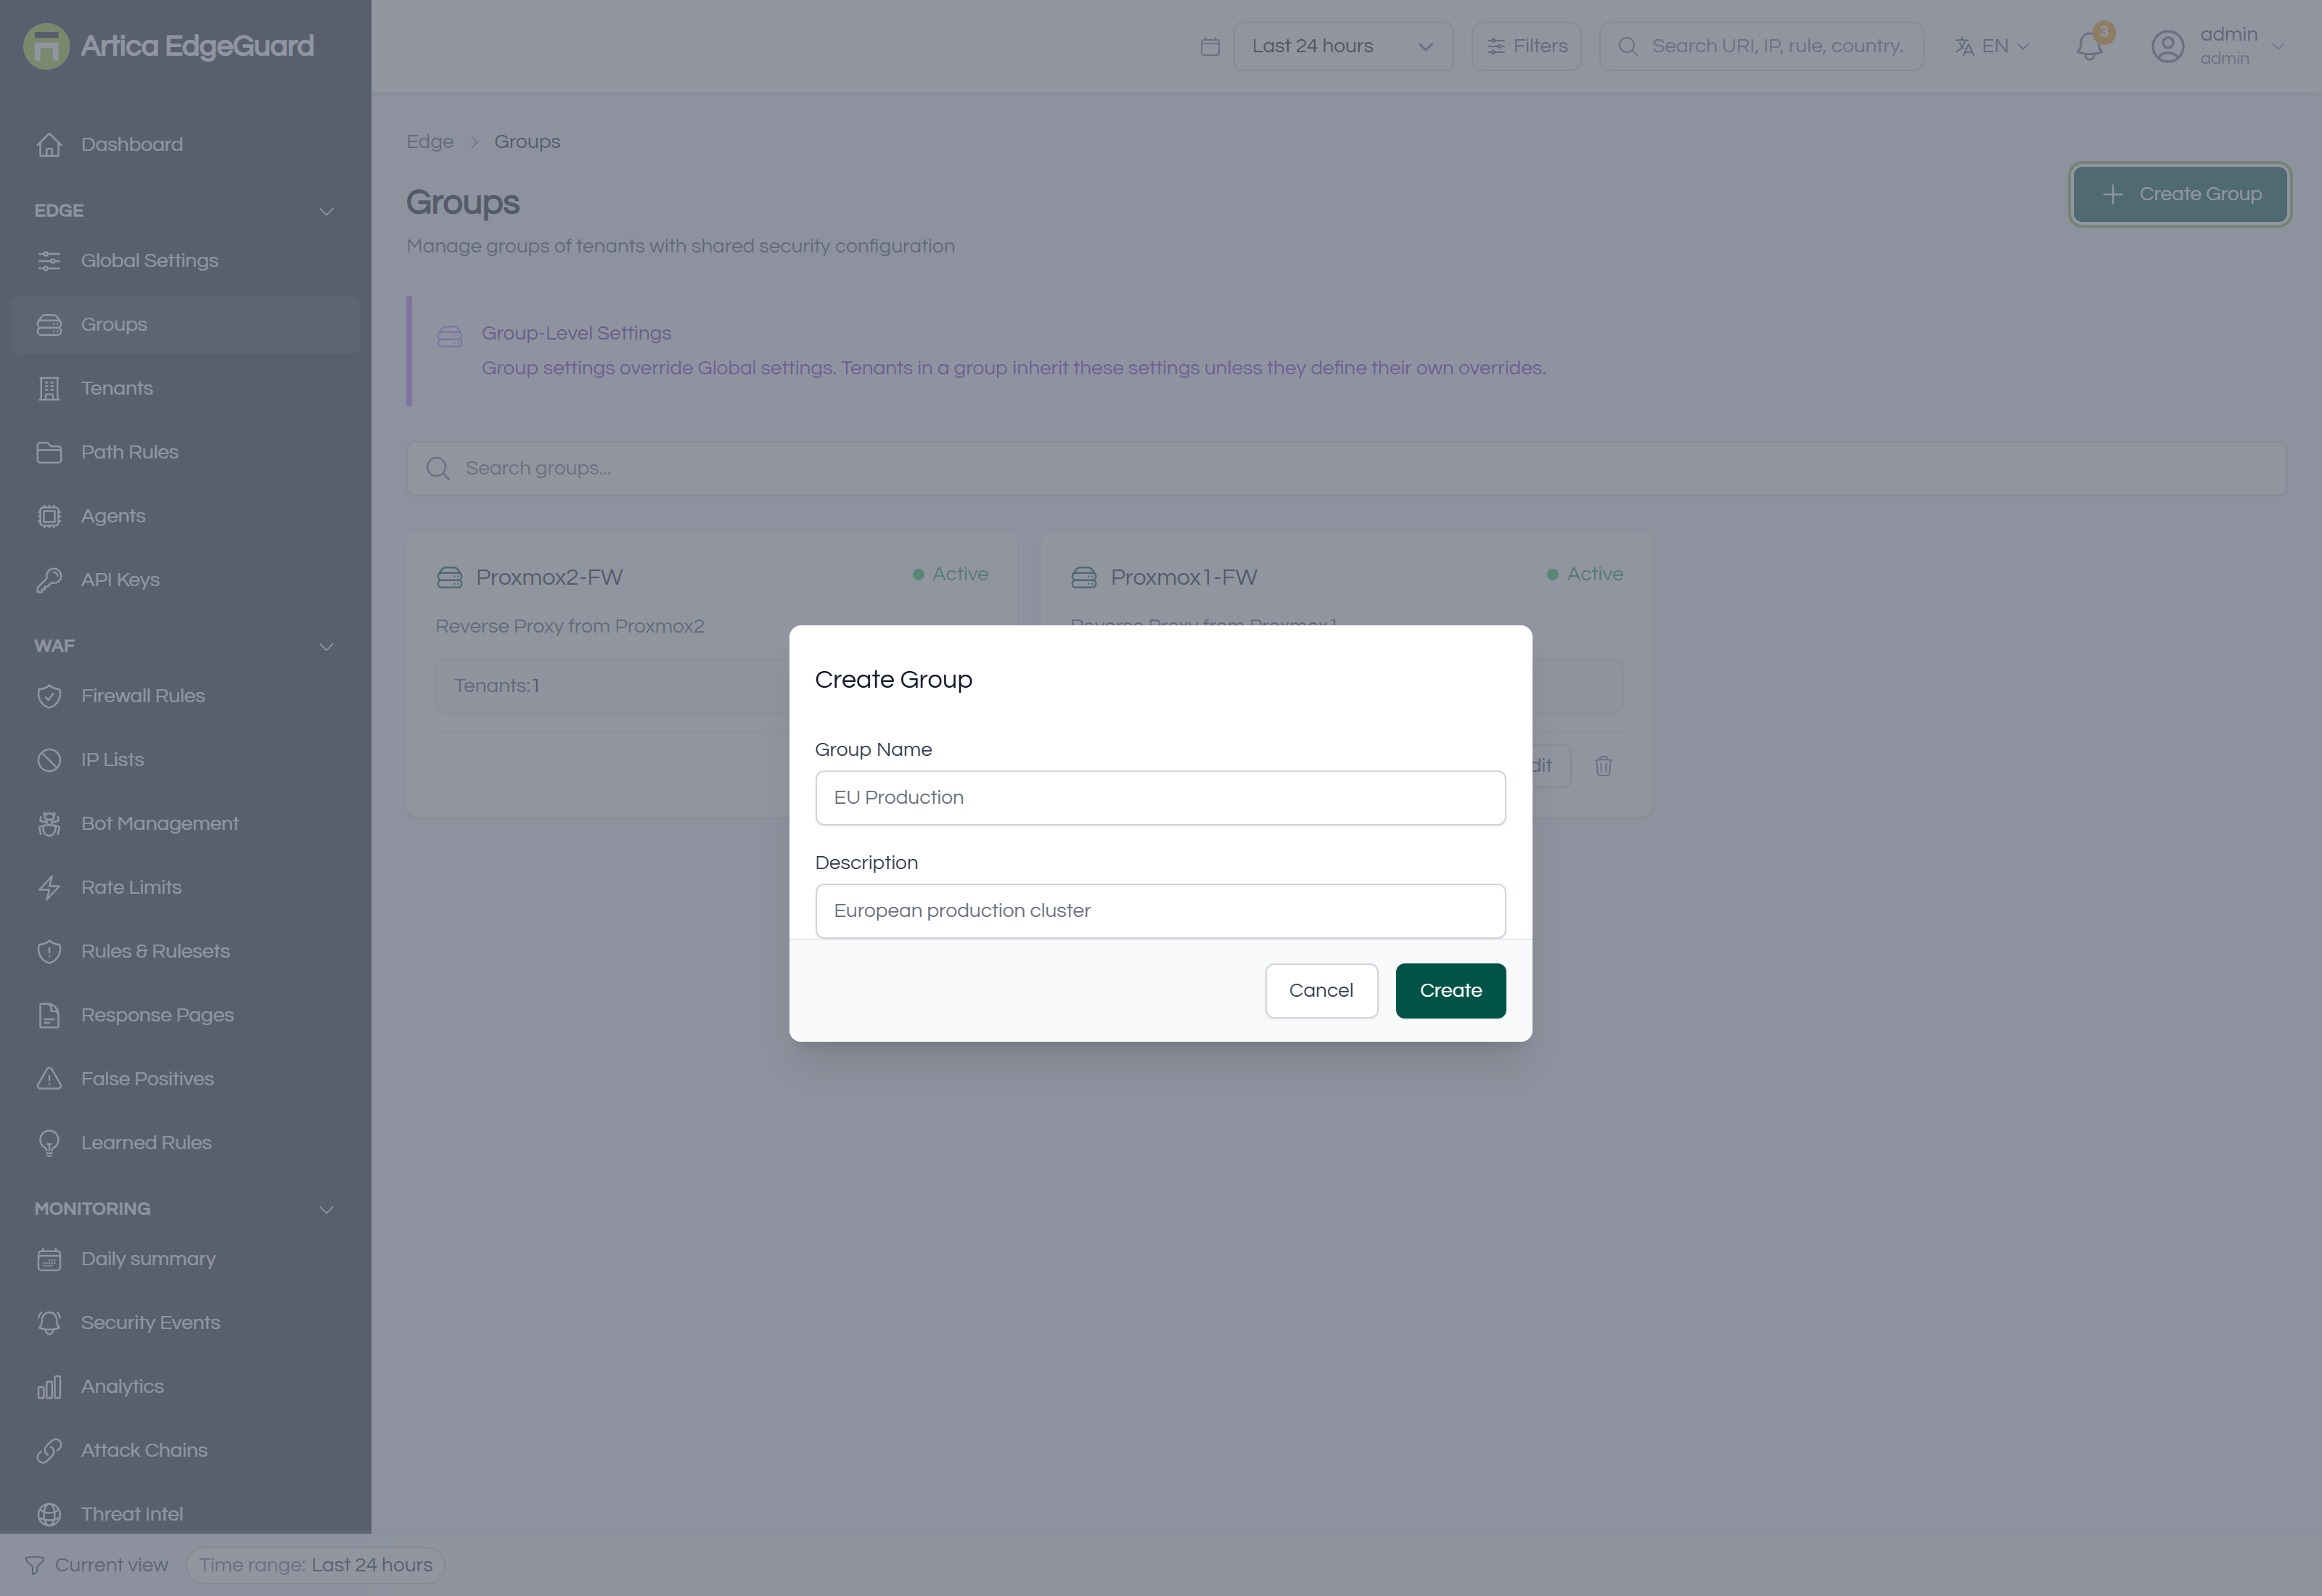
A set of sites that share configuration, sitting between Global and the sites themselves. Optional: a site with no group inherits straight from Global.
Full documentation: EdgeGuard — Groups
¶ Tenants
One protected site each. This is the level most configuration is actually made at, and the thing every event, rule and report is filtered by.
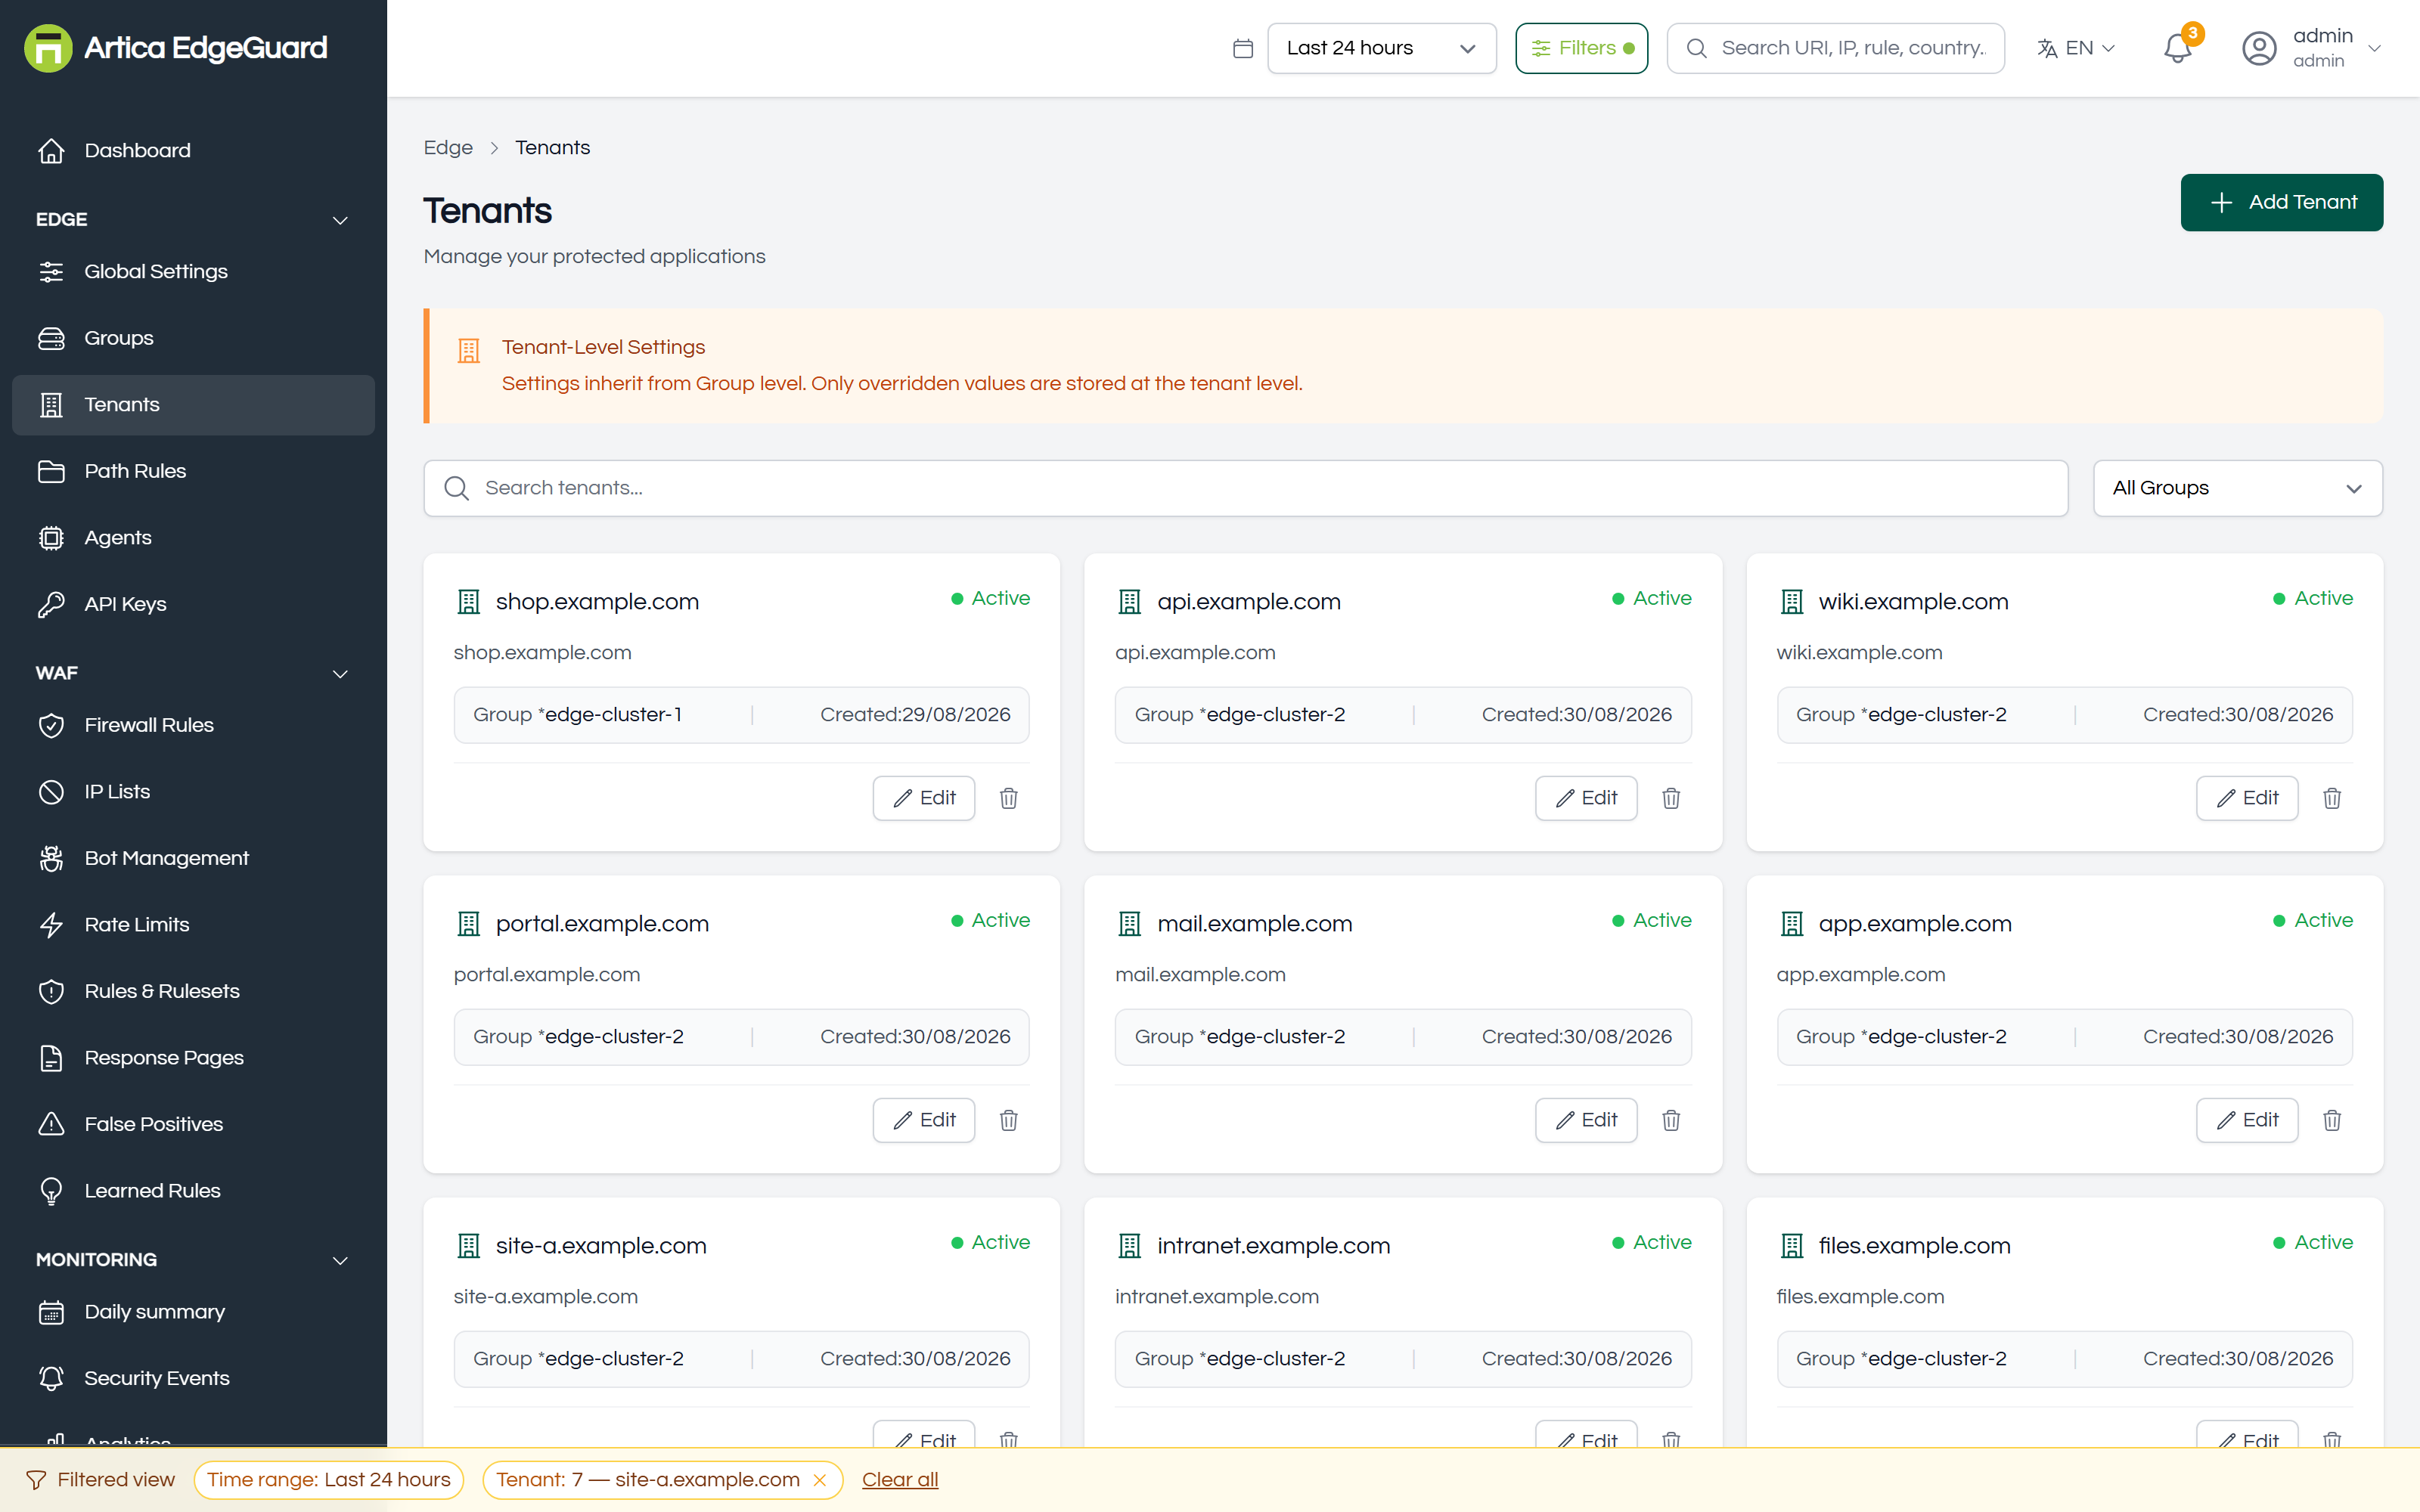
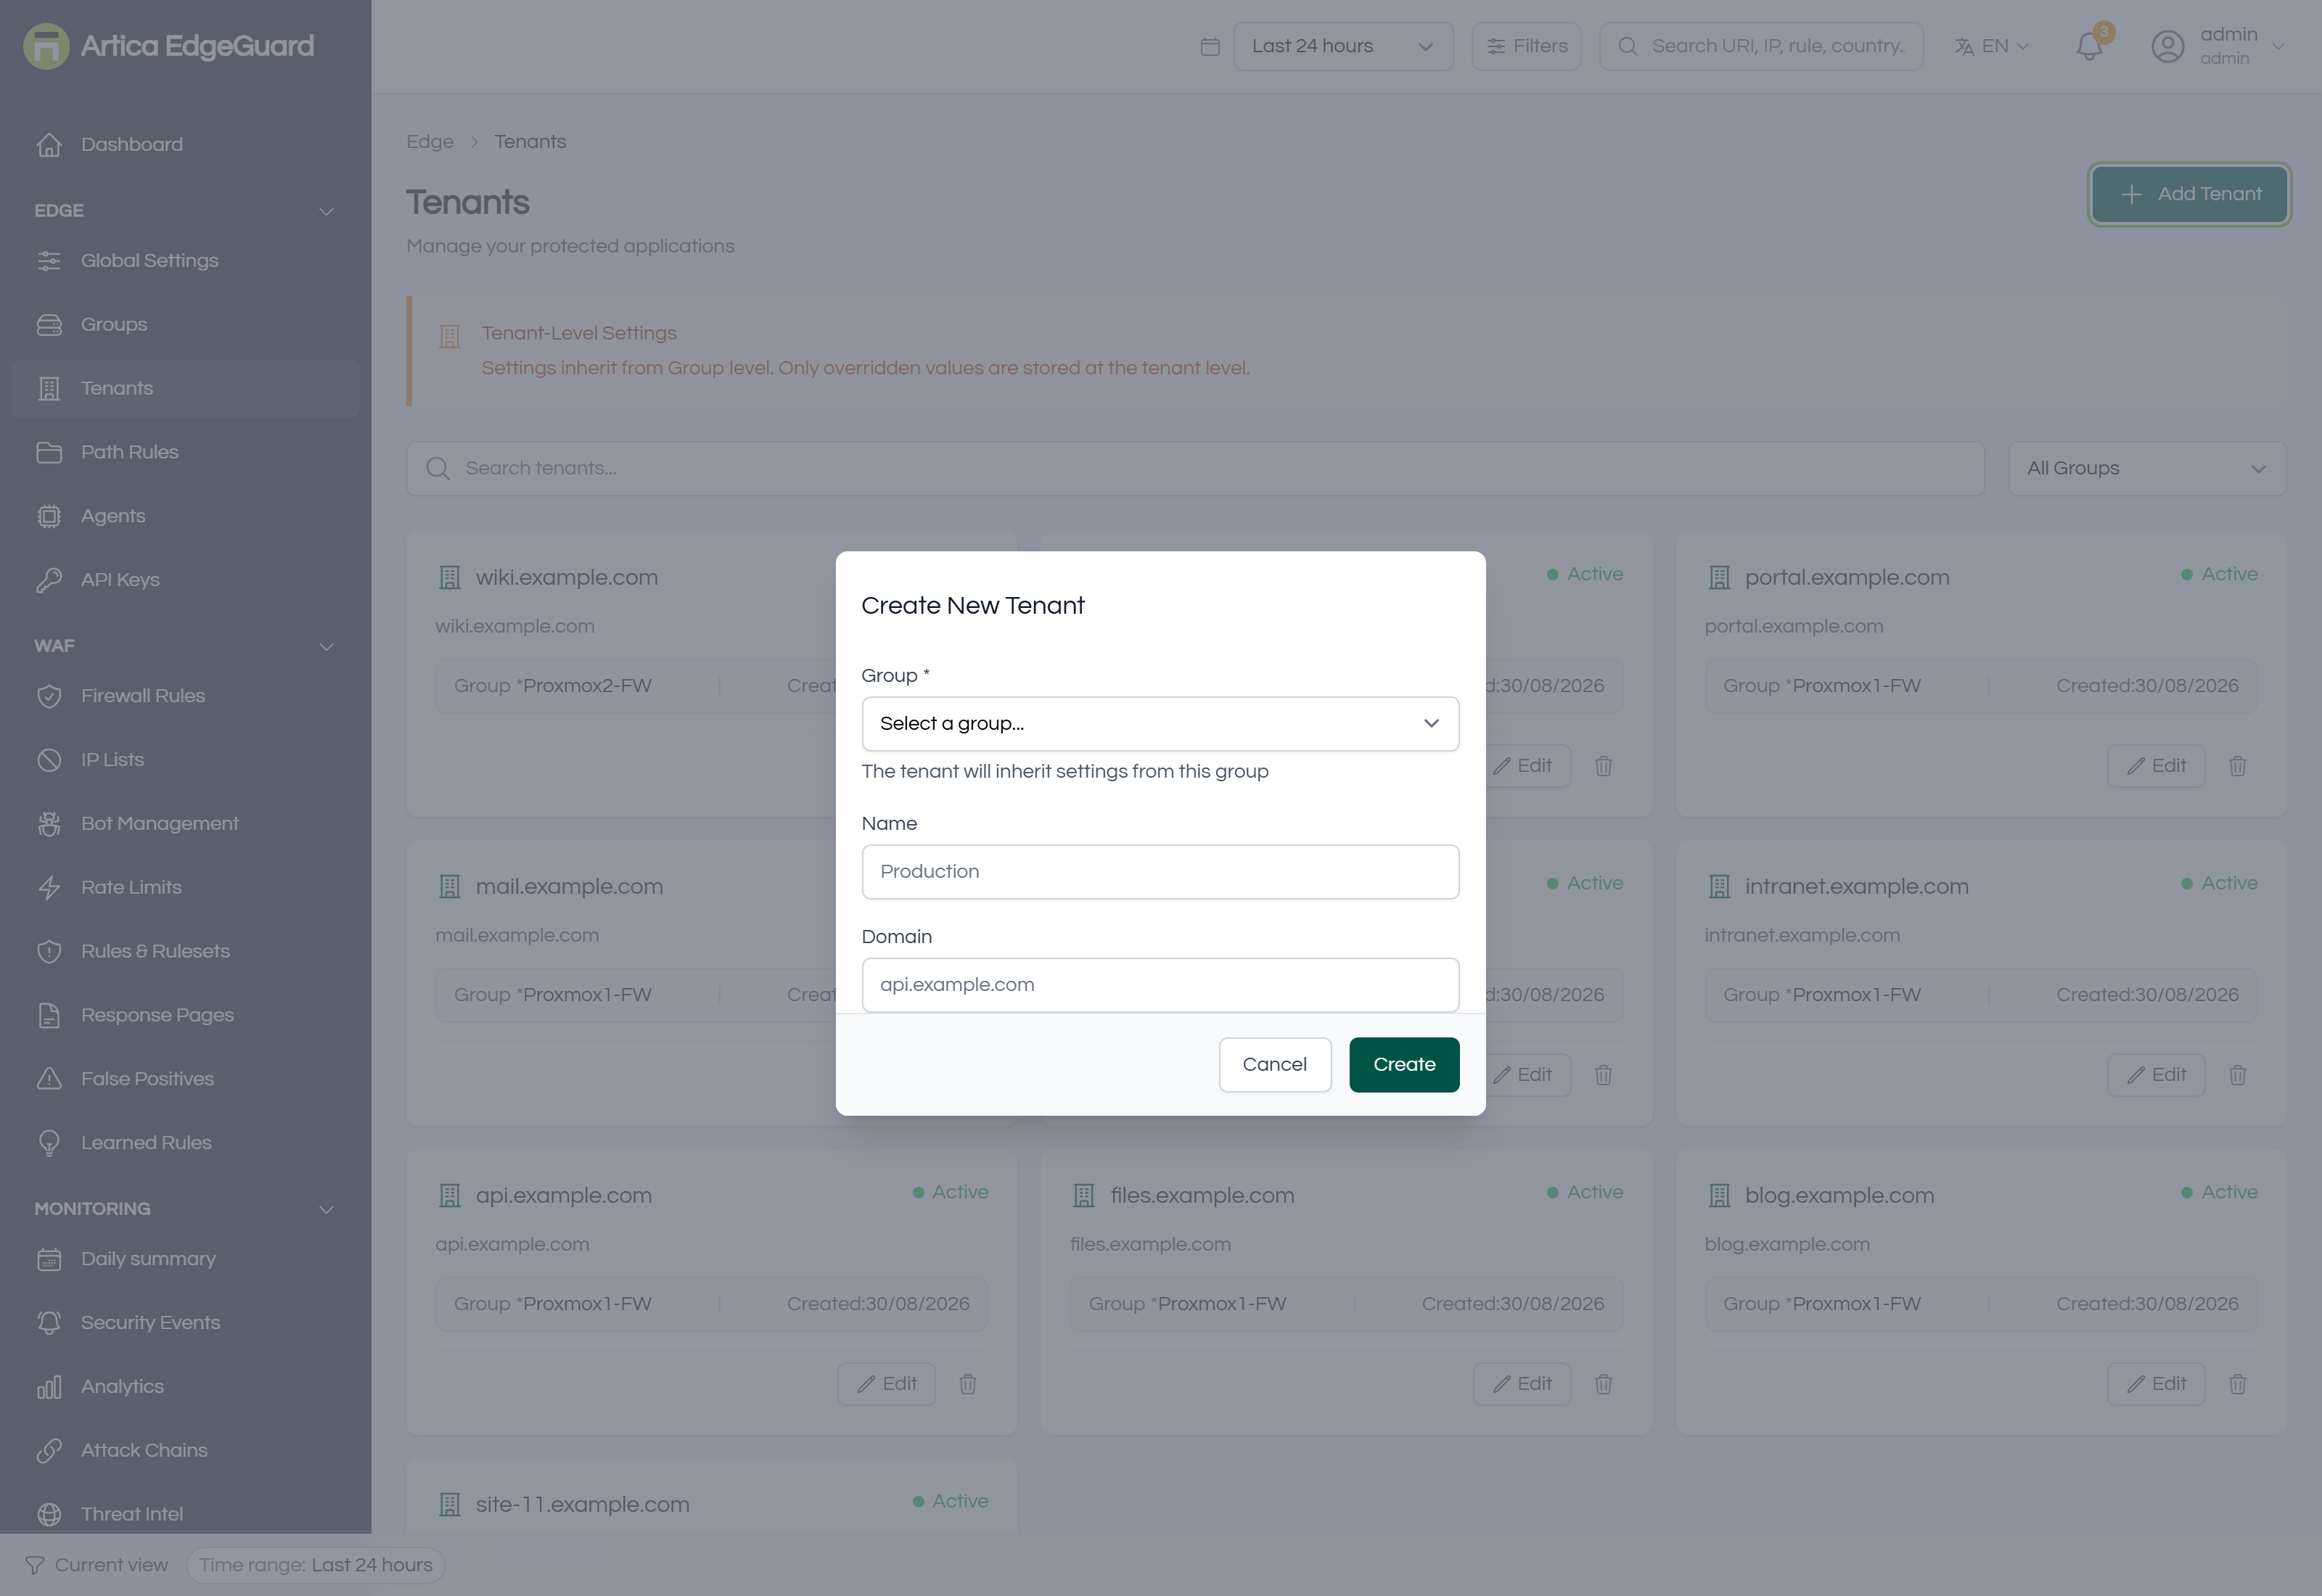
Full documentation: EdgeGuard — Tenants
¶ Path Rules
A different policy for one part of a site — stricter on /admin, looser on a webhook that has to accept odd payloads.
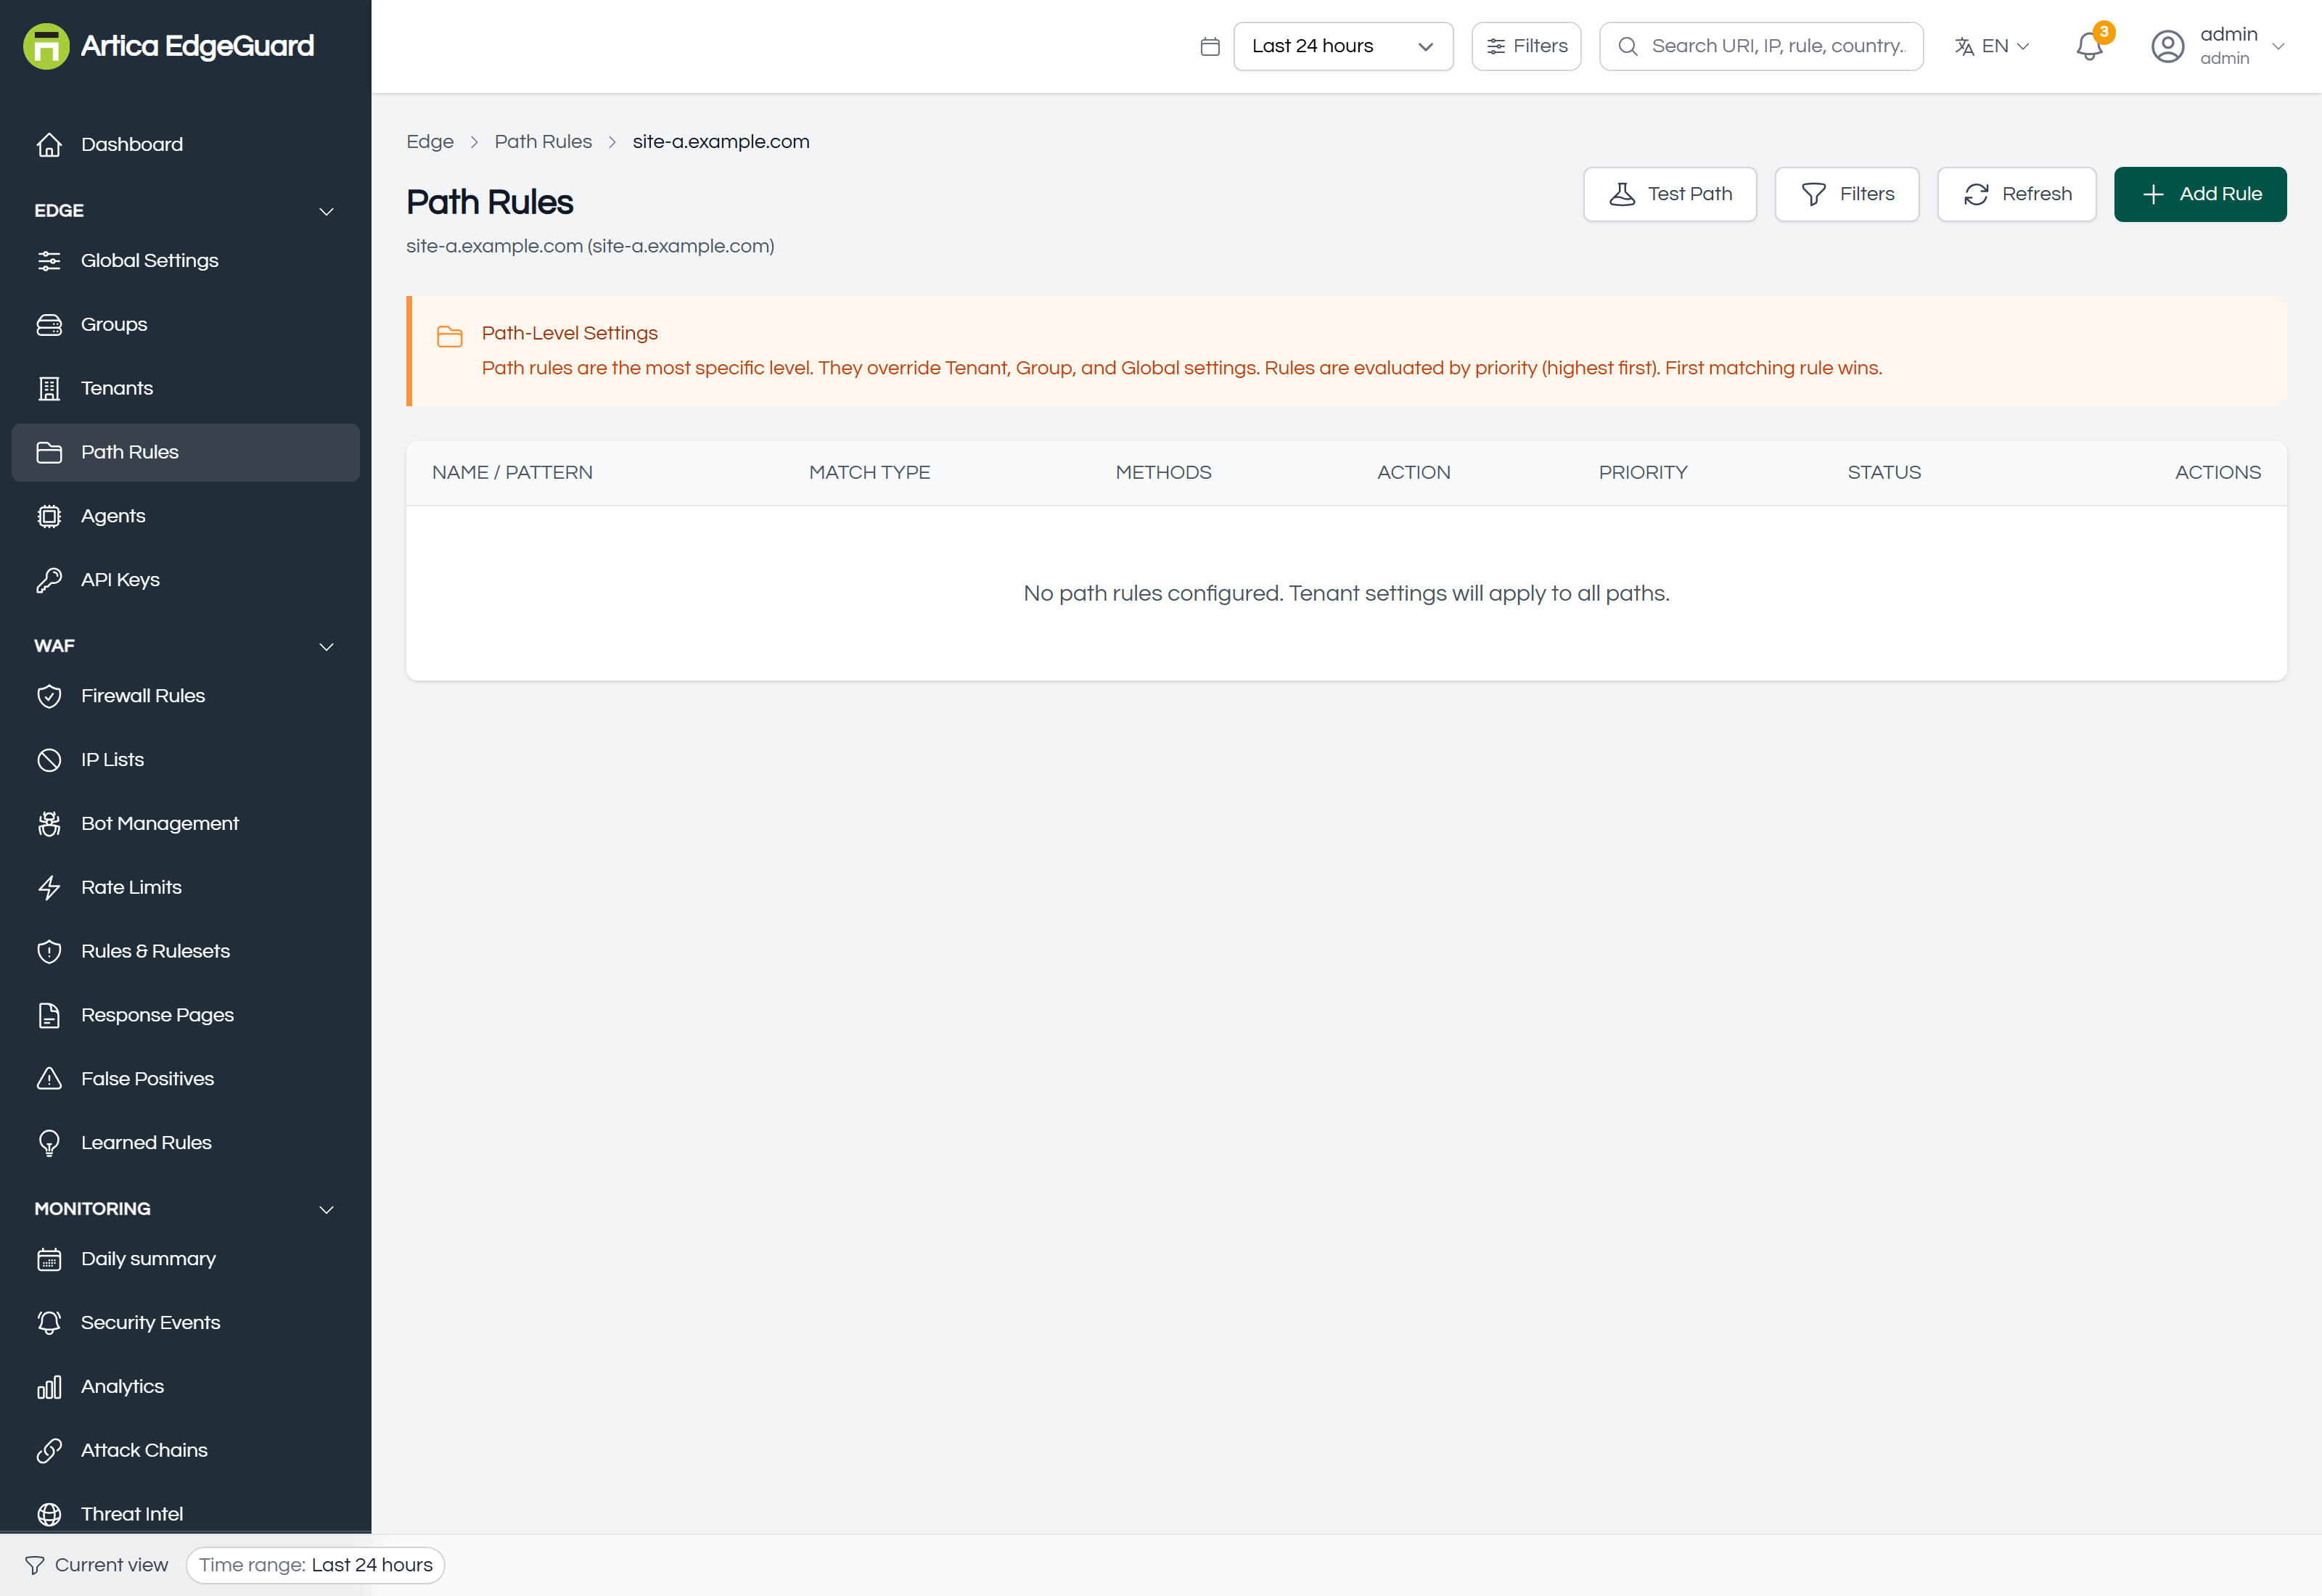
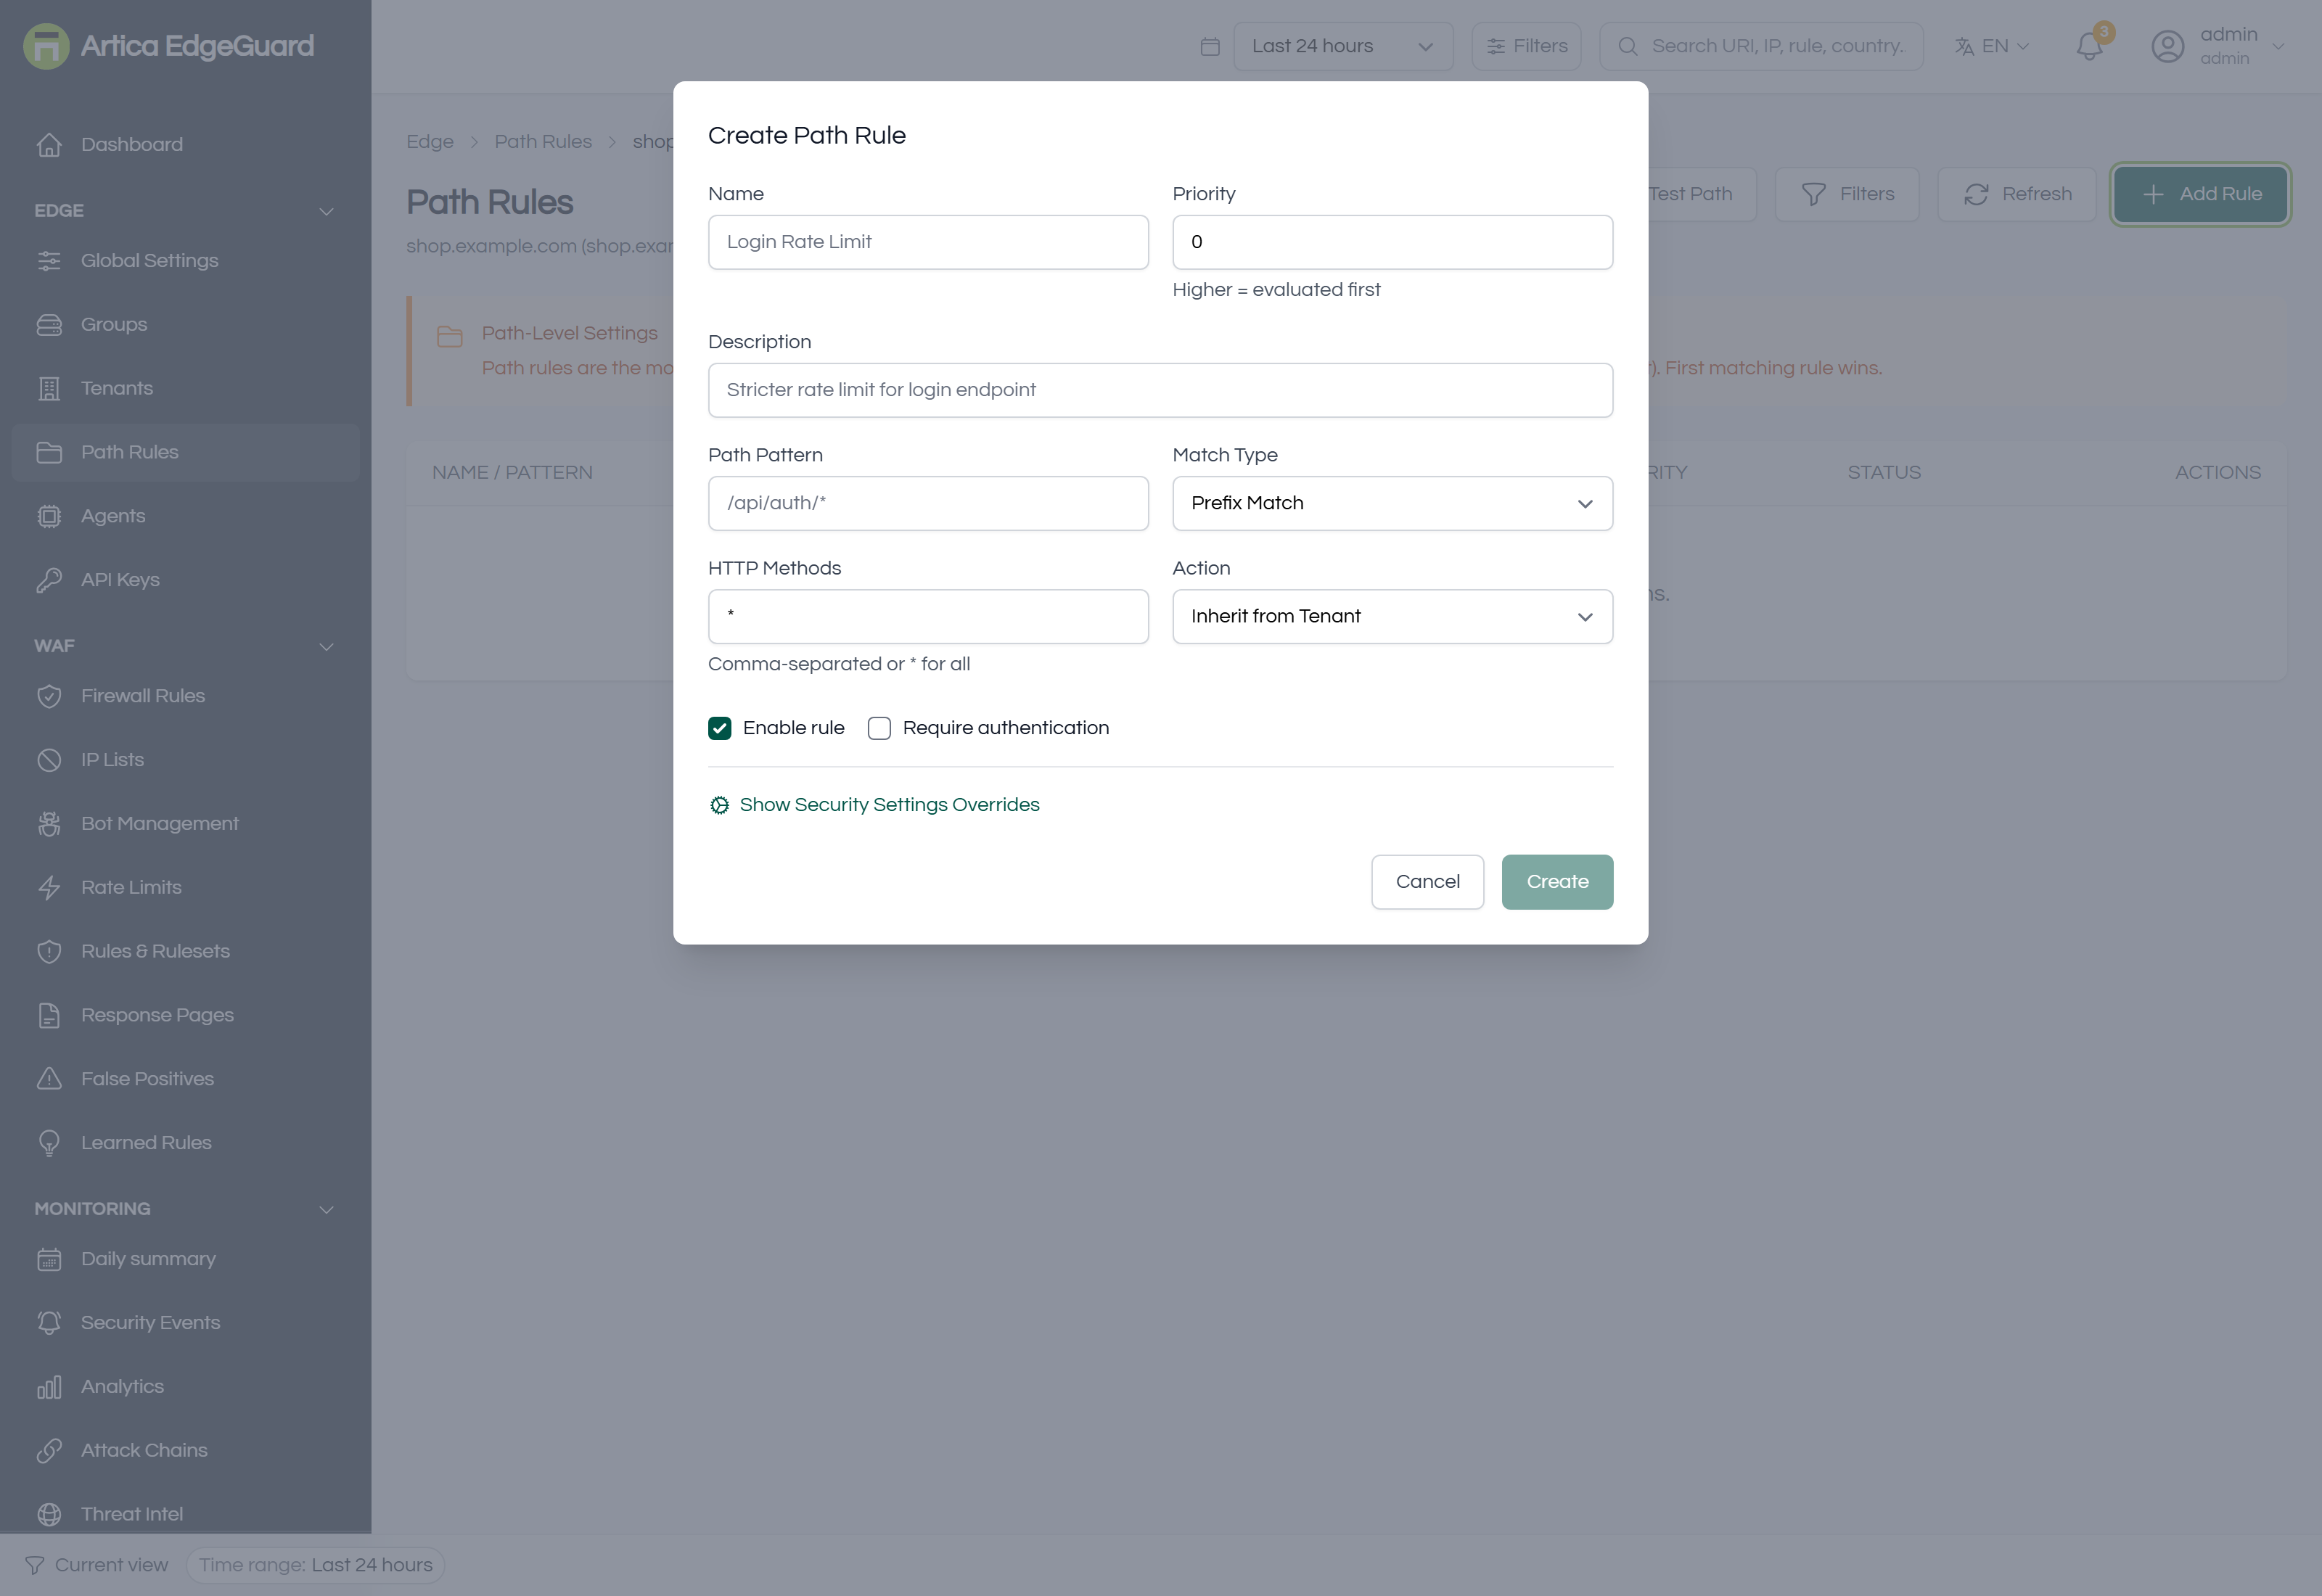
Full documentation: EdgeGuard — Path Rules
¶ Country Groups
Named sets of countries you can use in any geographic condition by writing @name. Continents need no group; the @ is what keeps them apart from countries.
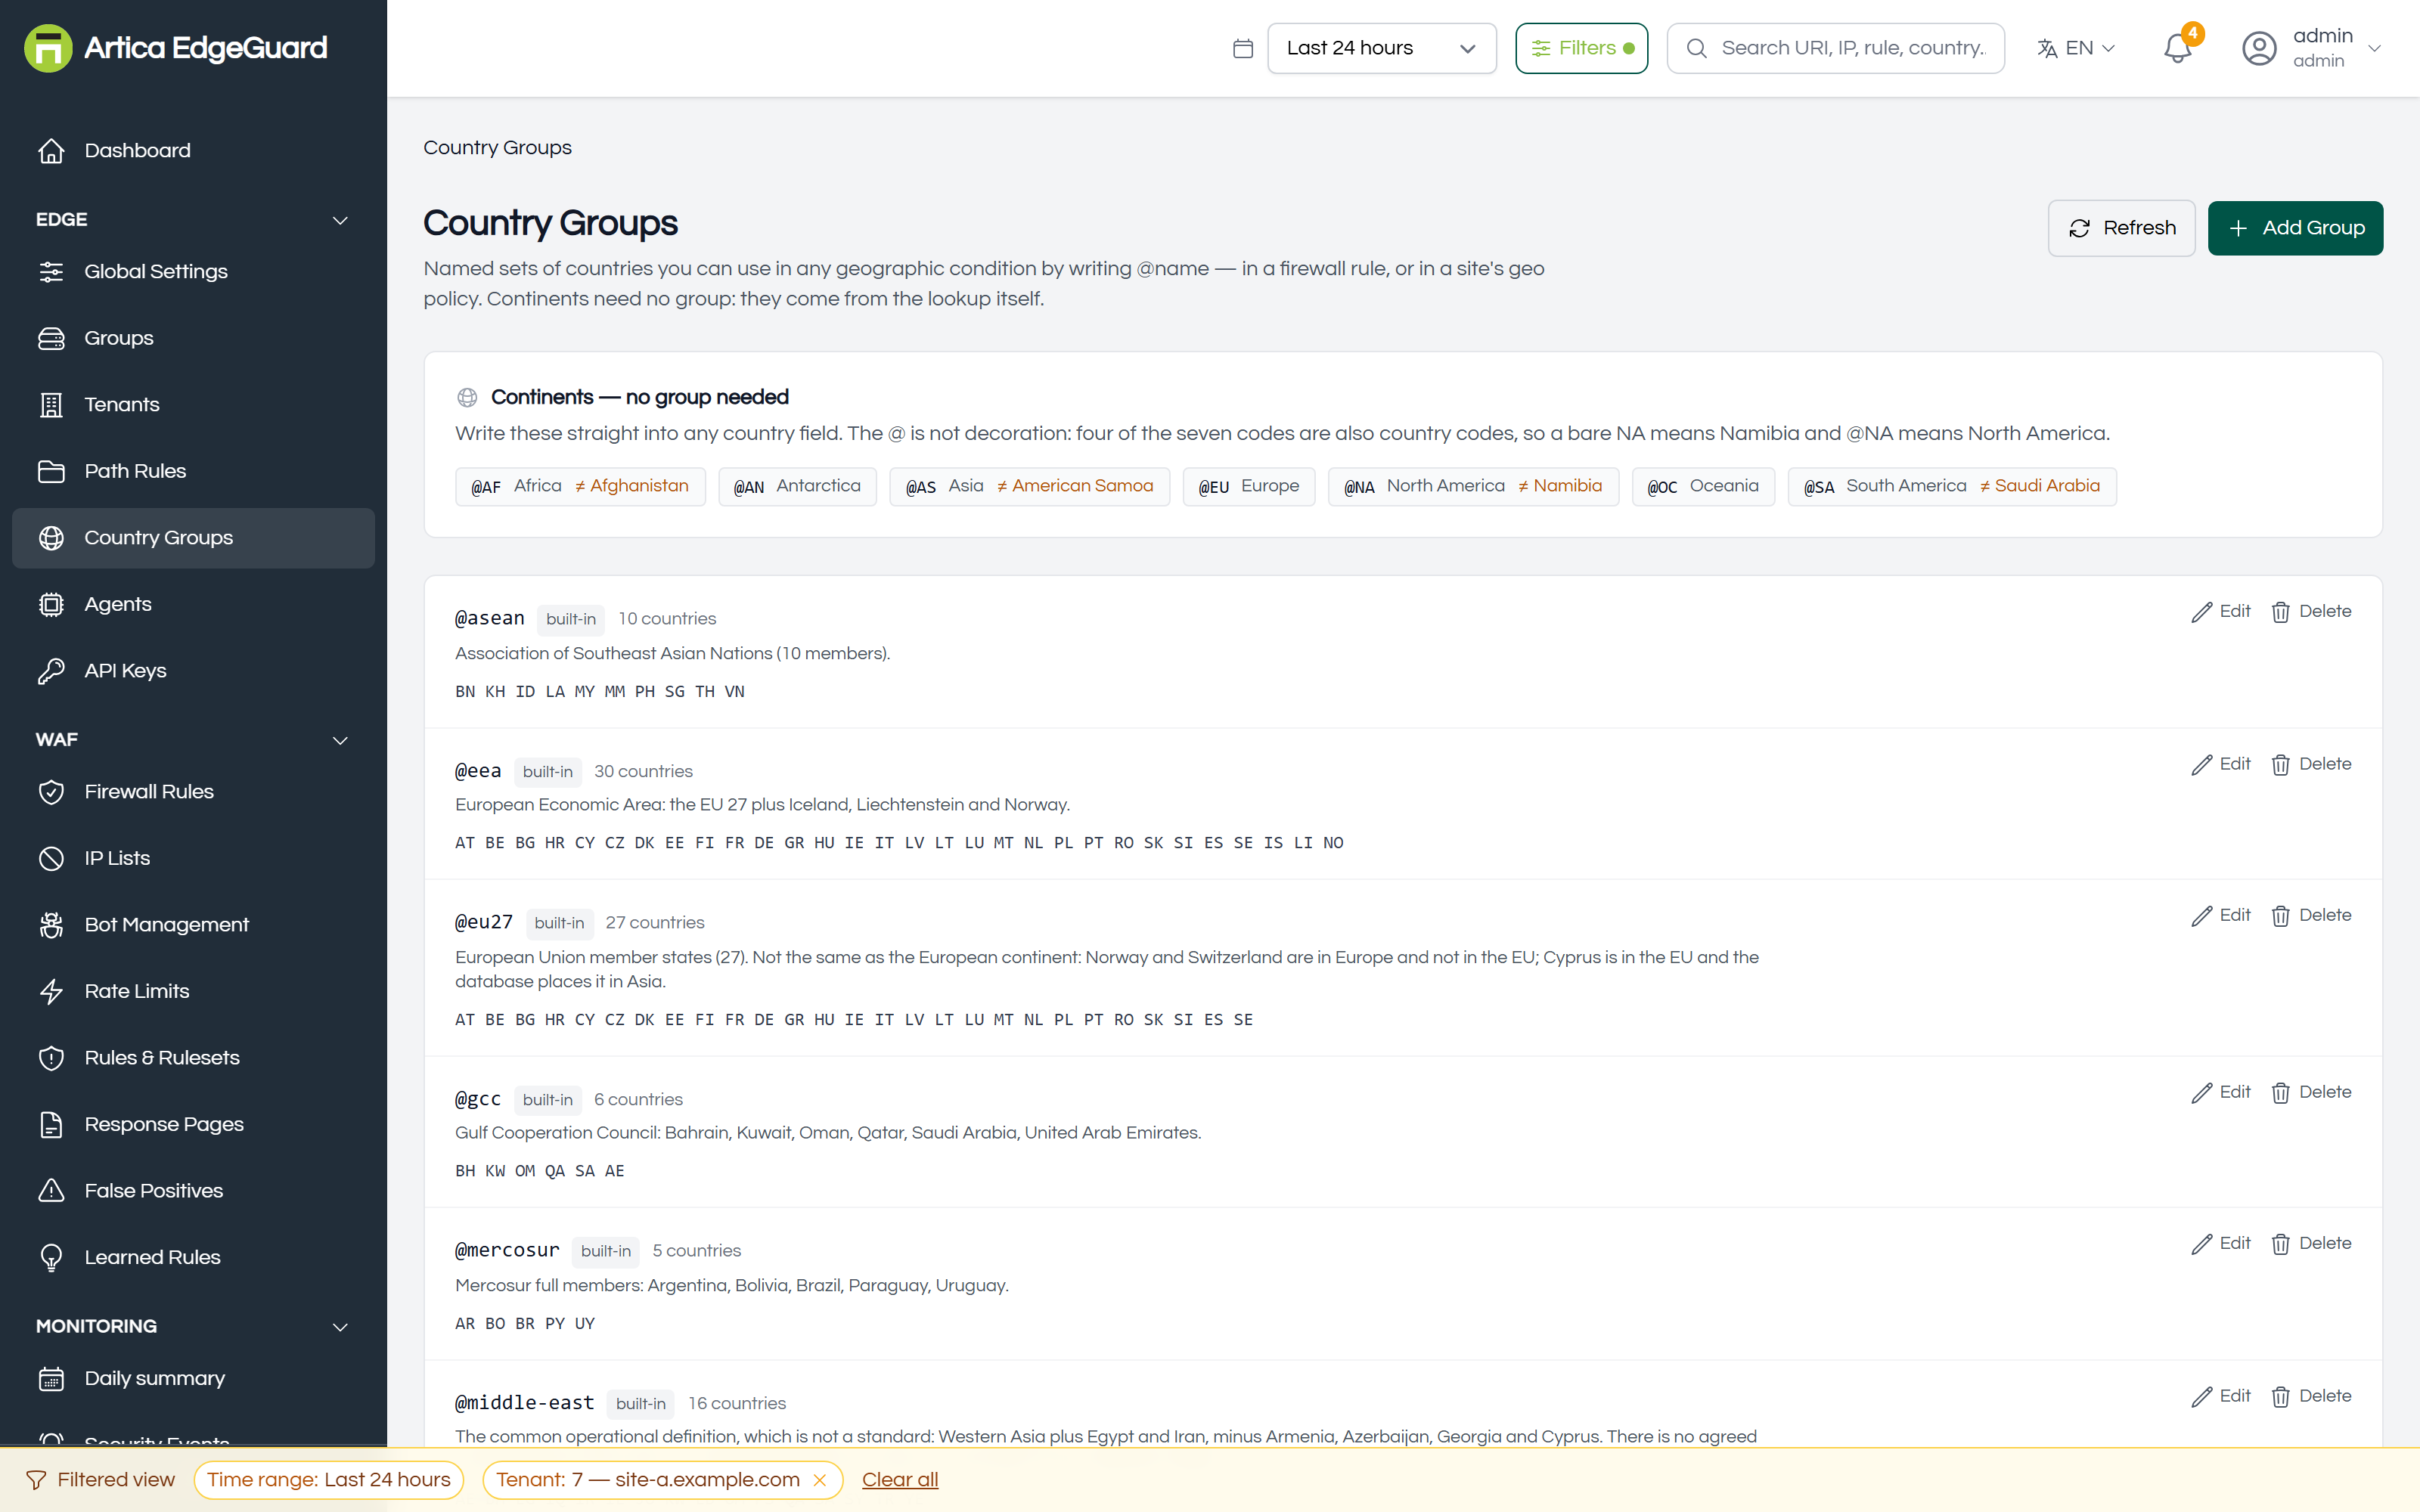
Full documentation: EdgeGuard — Country Groups
¶ Agents
Every decision engine connected to this console: status, the sites it protects, versions, database freshness, and the commands you can send one.
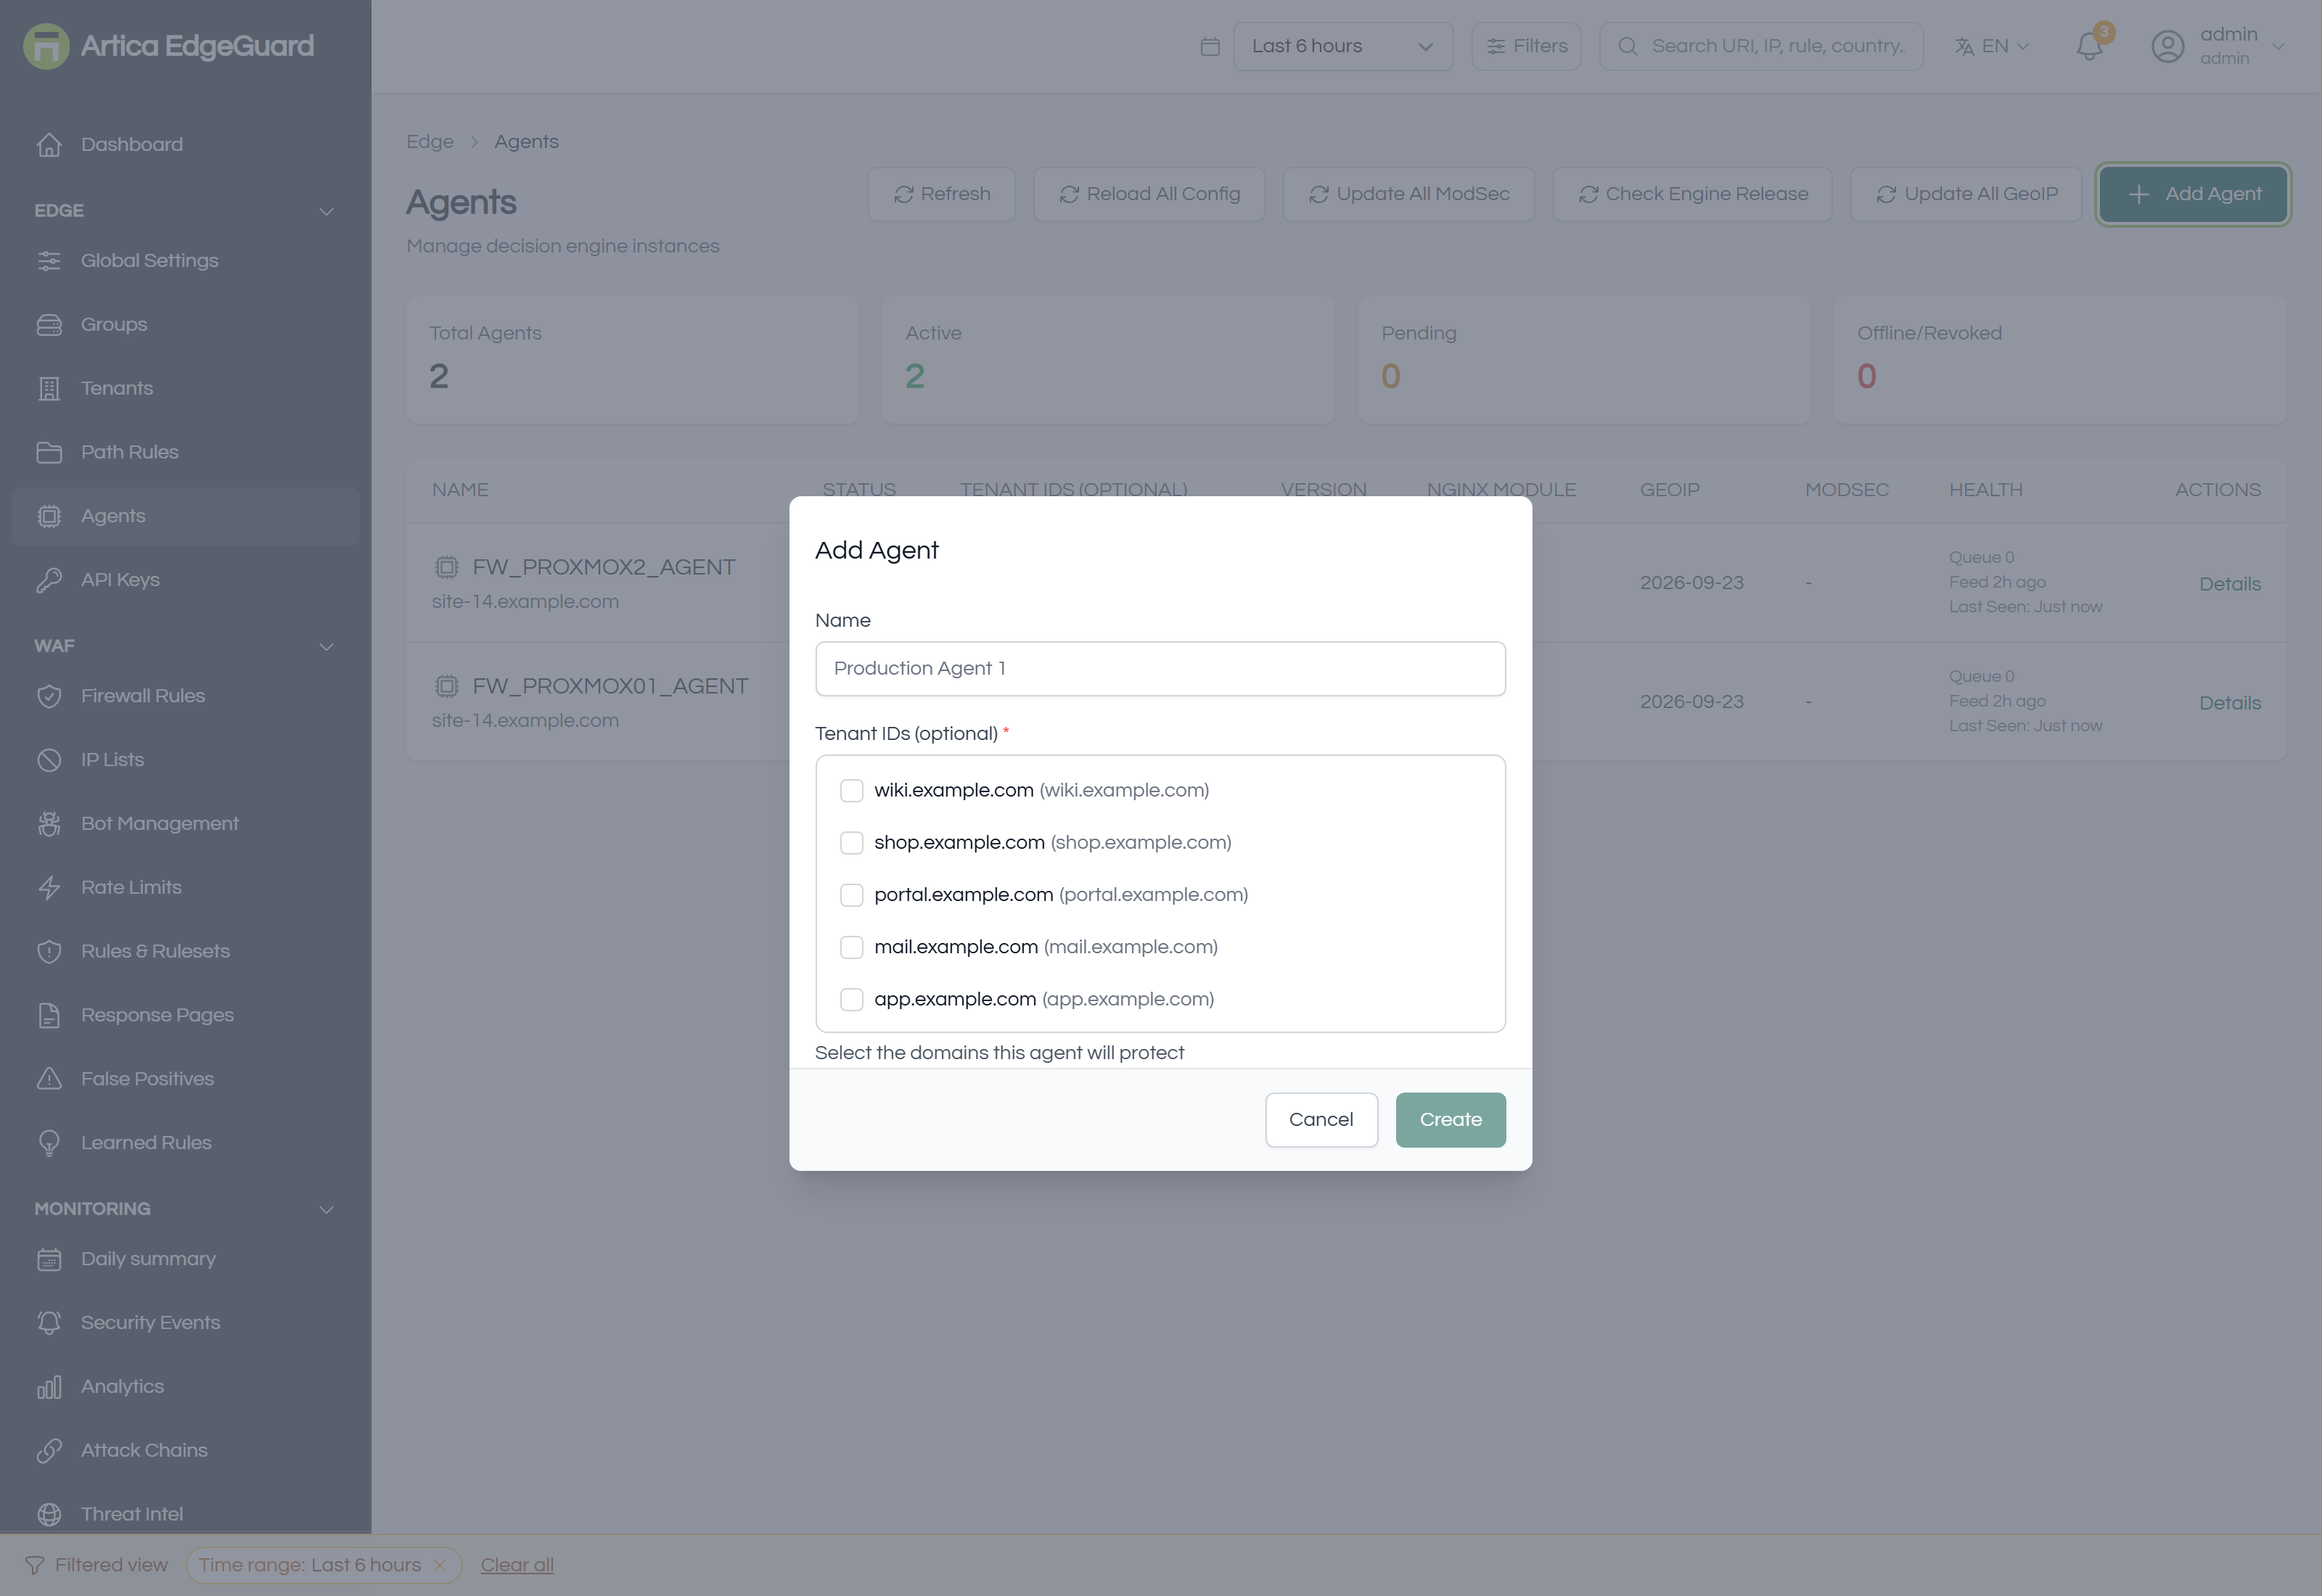
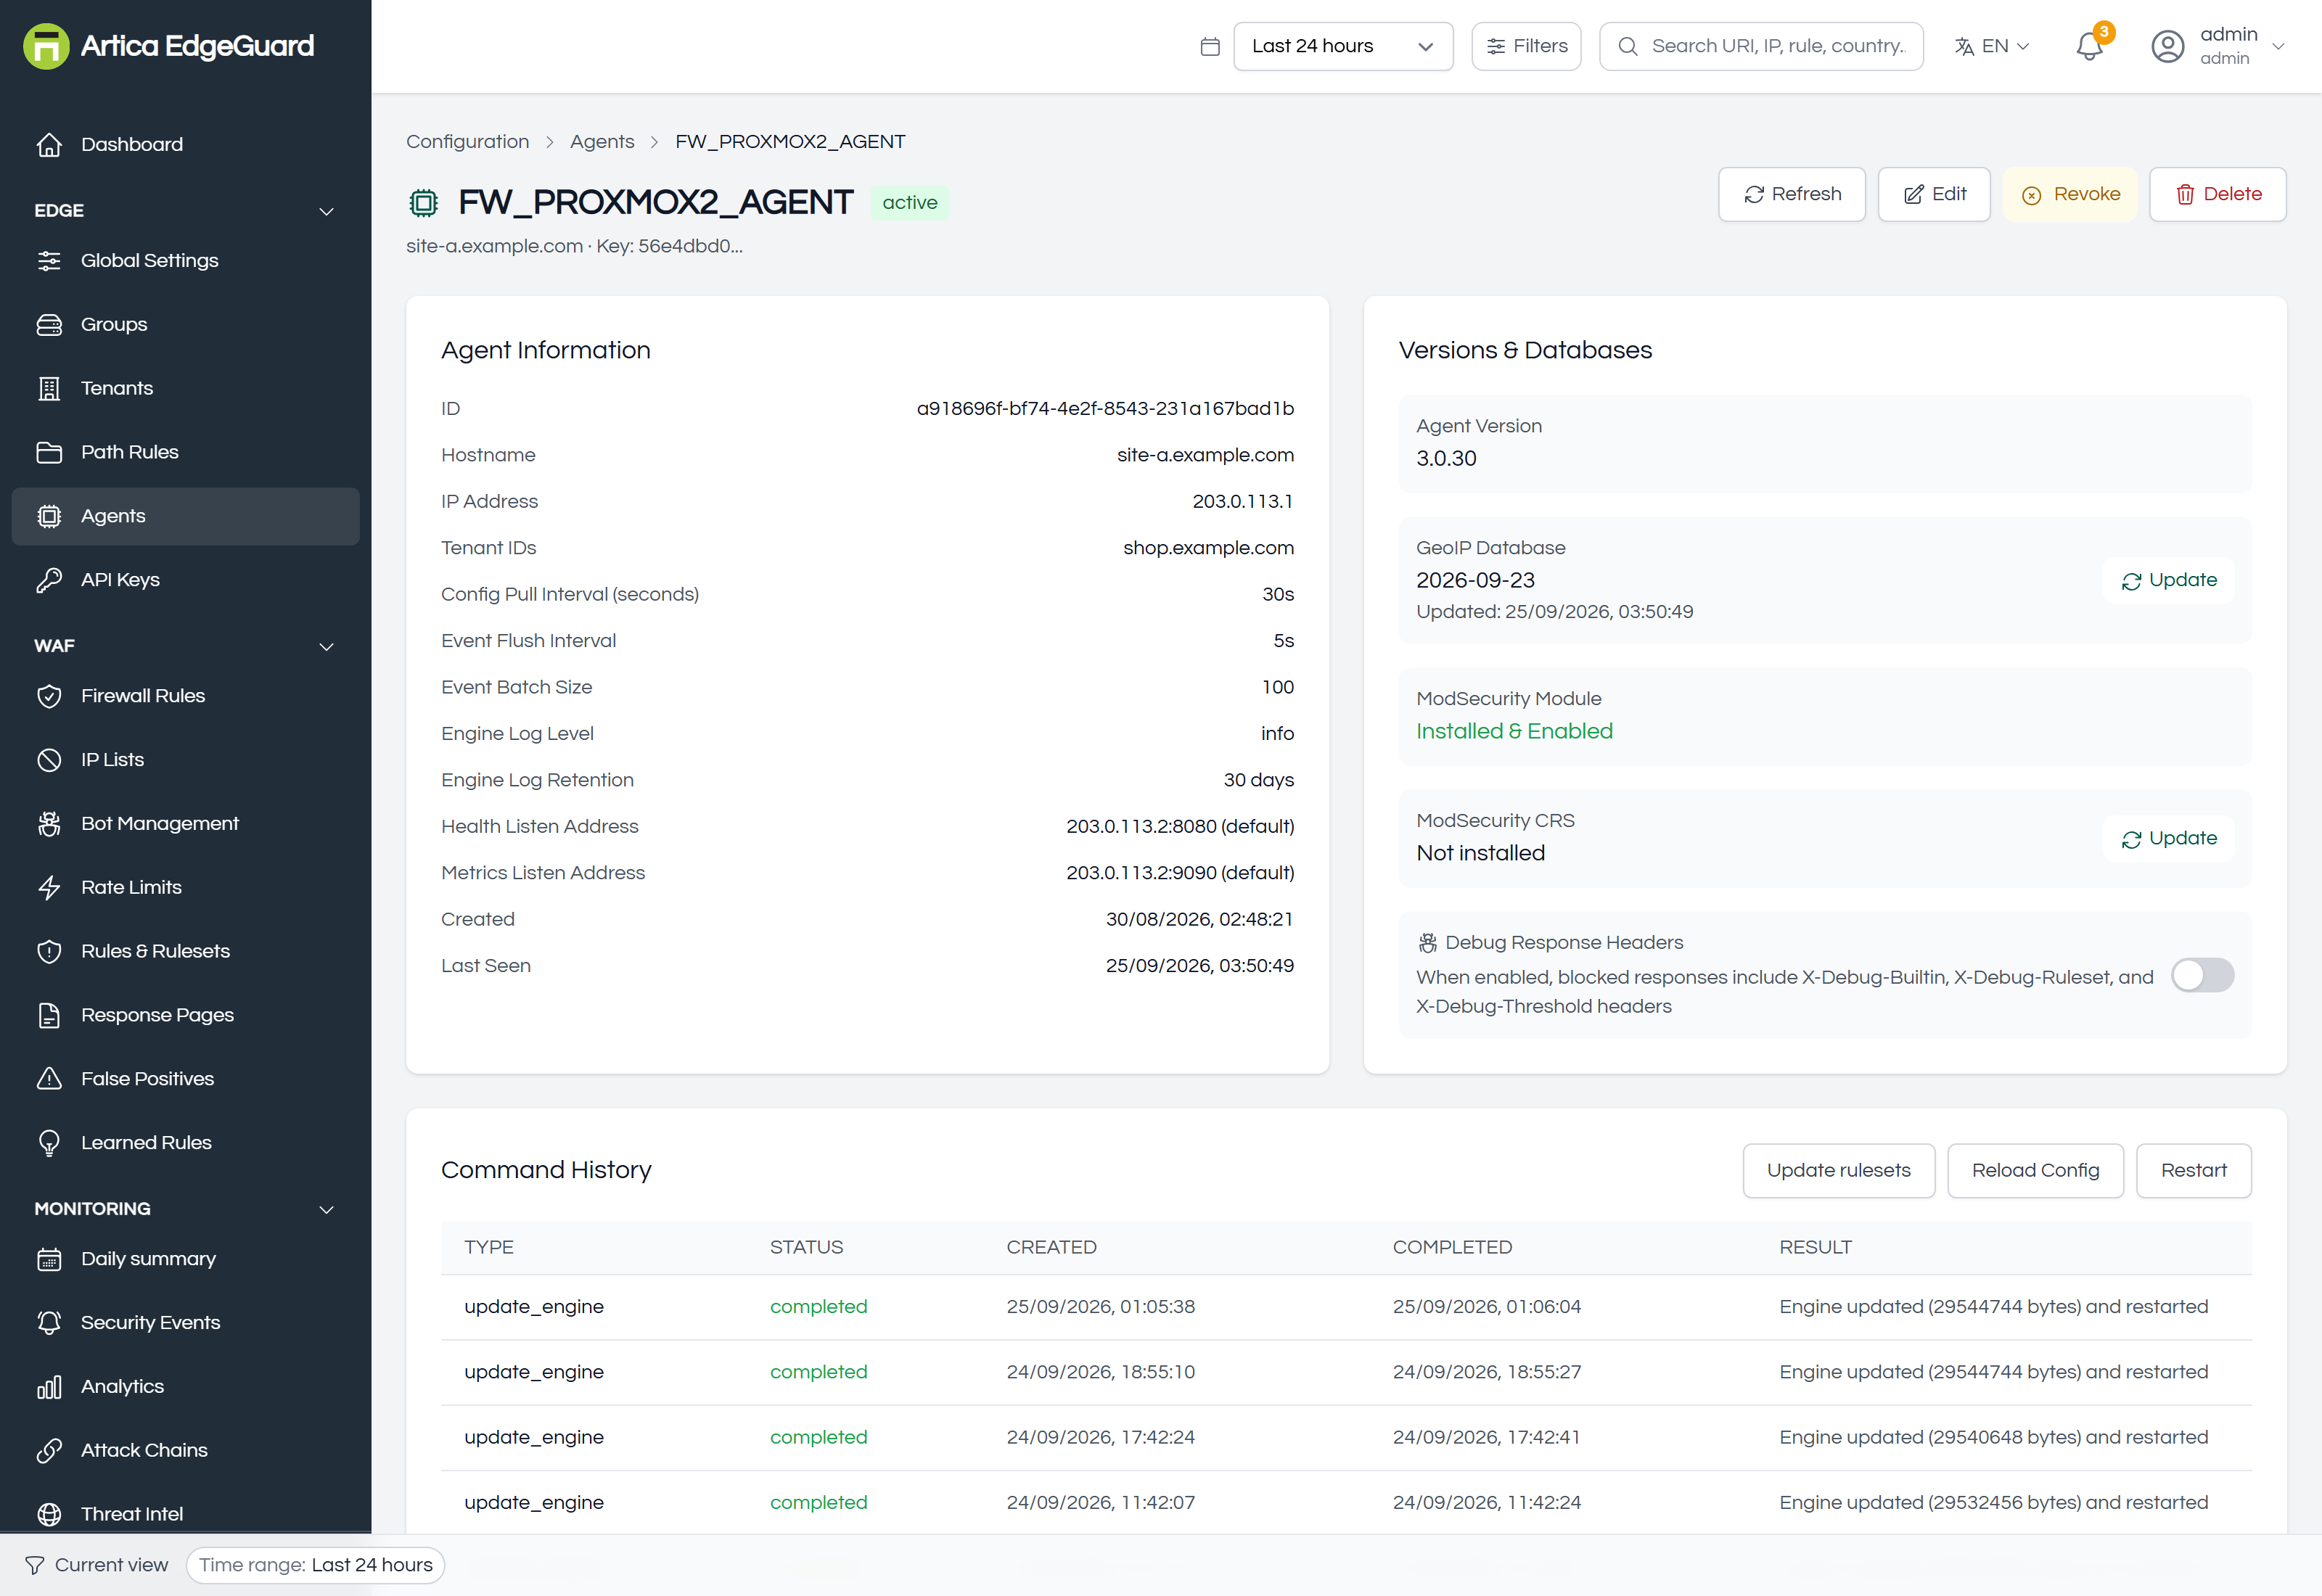
Full documentation: EdgeGuard — Agents
¶ API Keys
Keys for the management API — a deployment pipeline, a monitoring script, an integration of your own. Shown once, revocable, and acting as the person who created them.
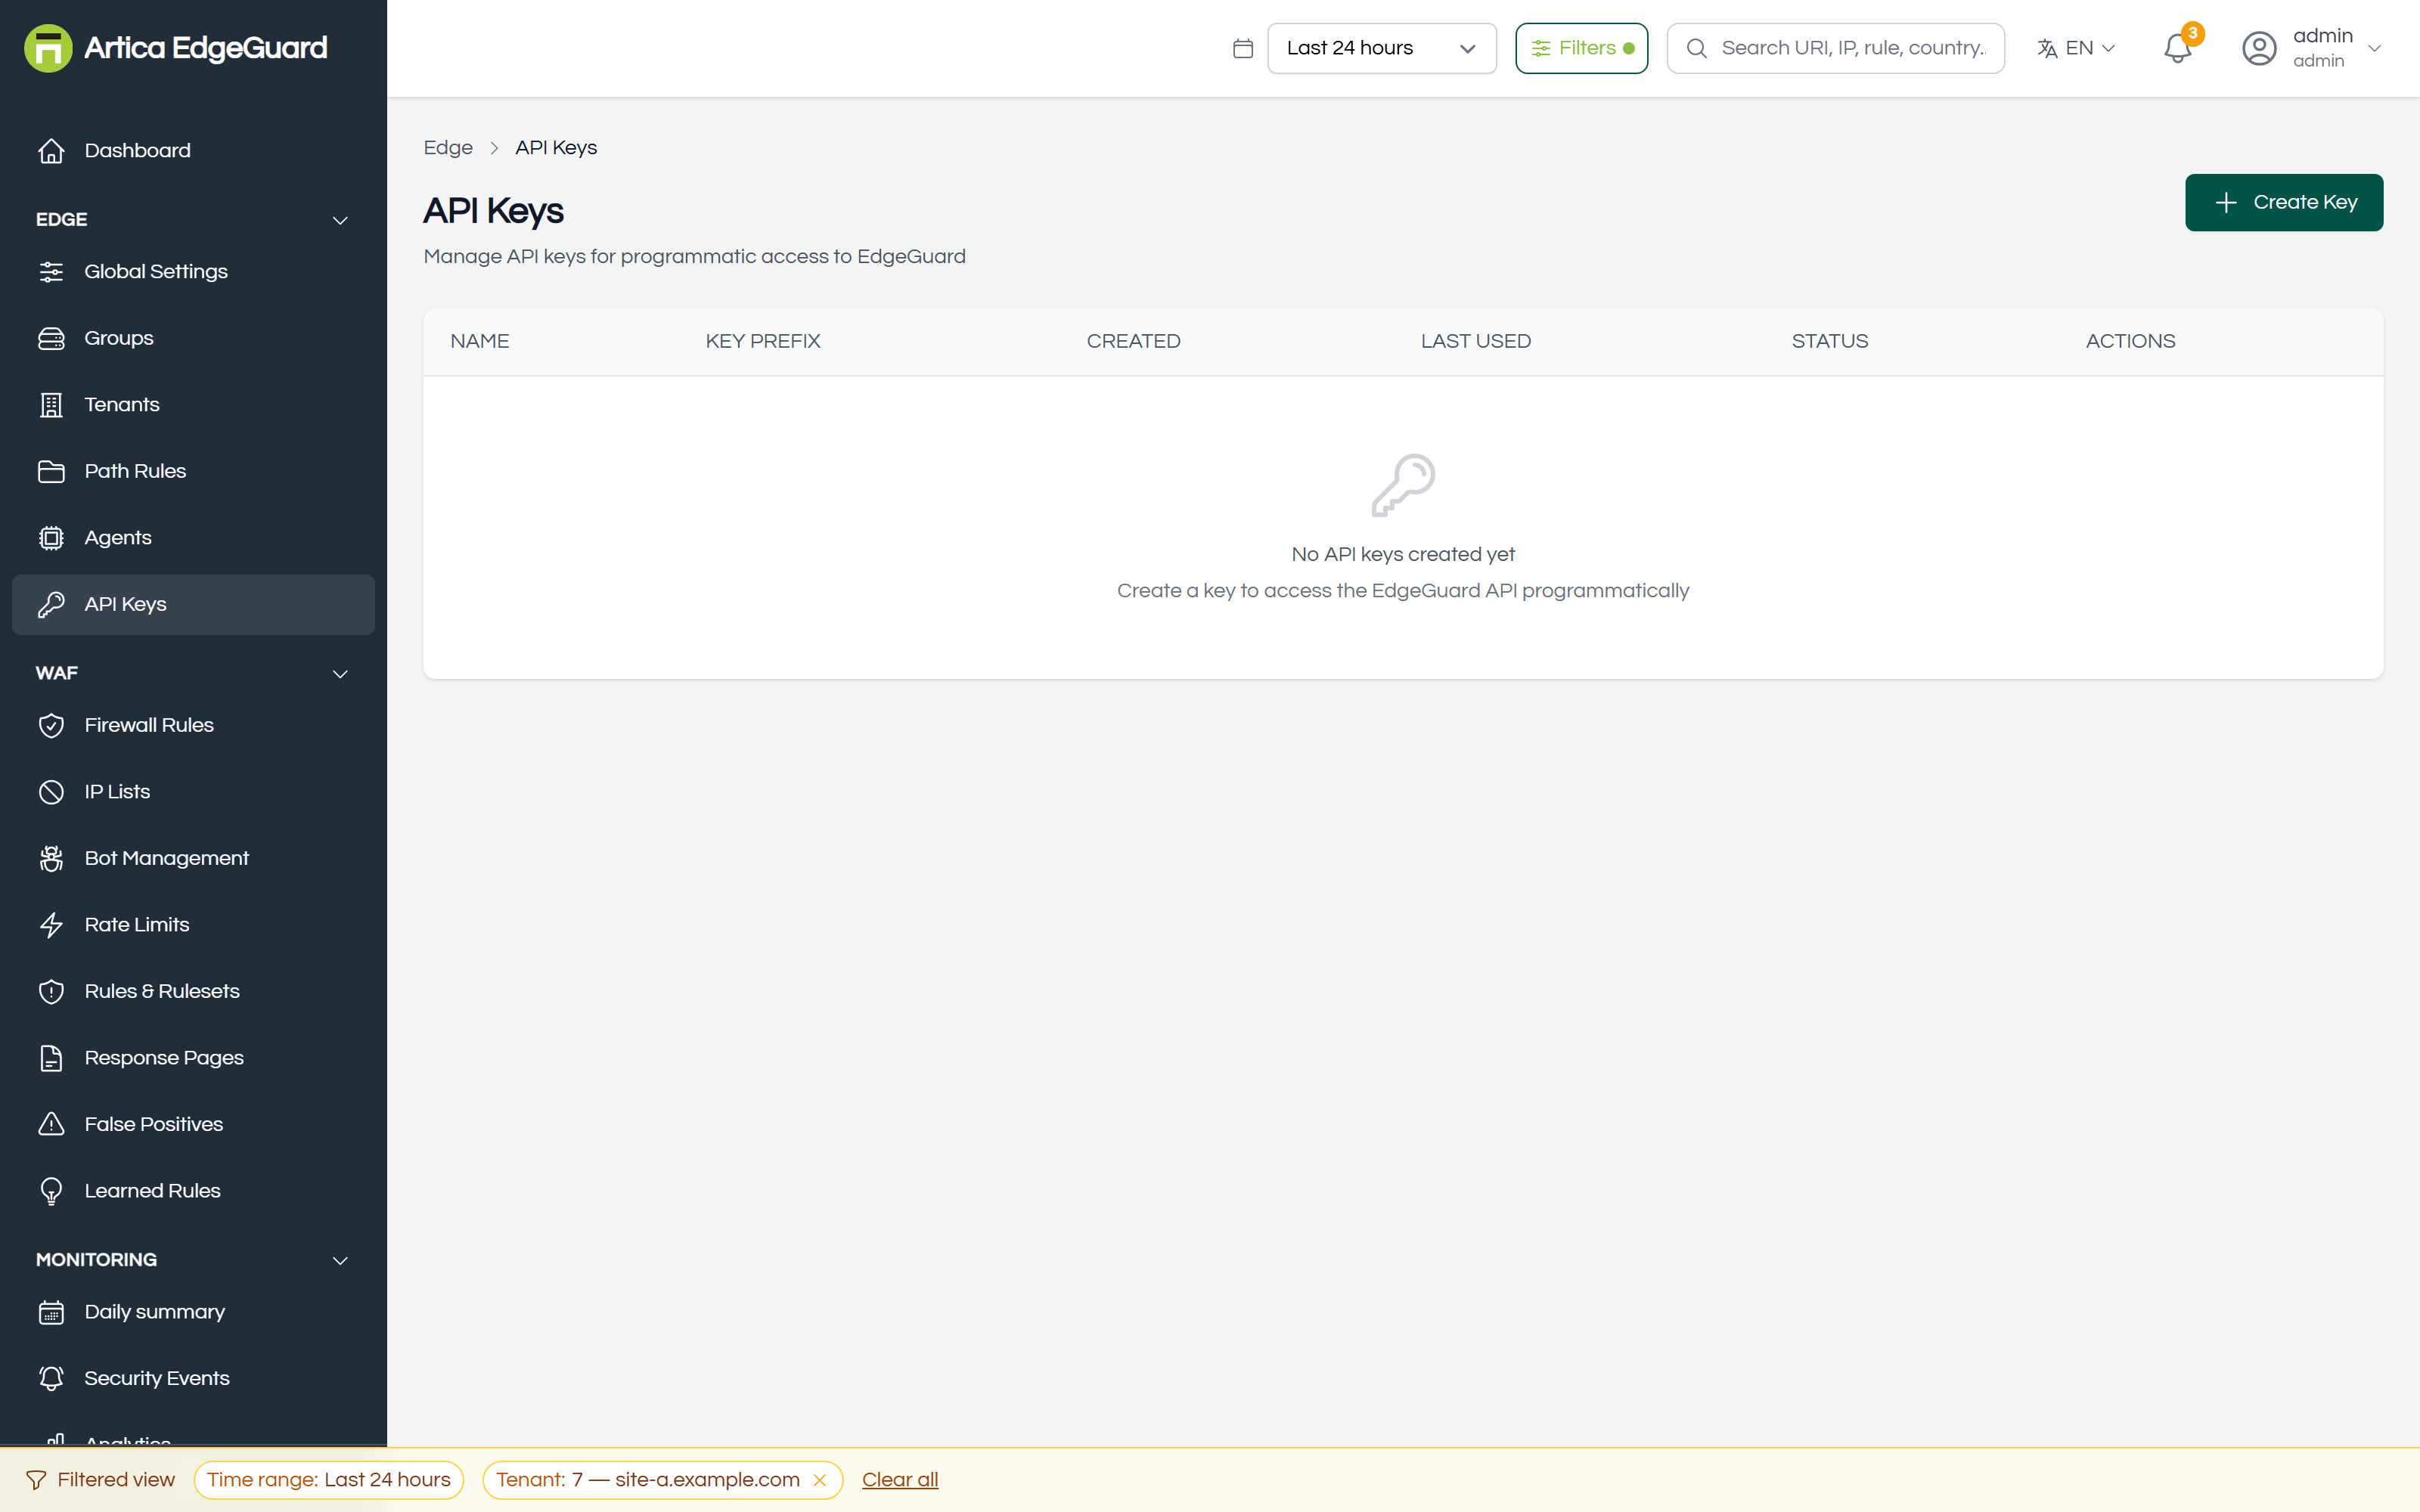
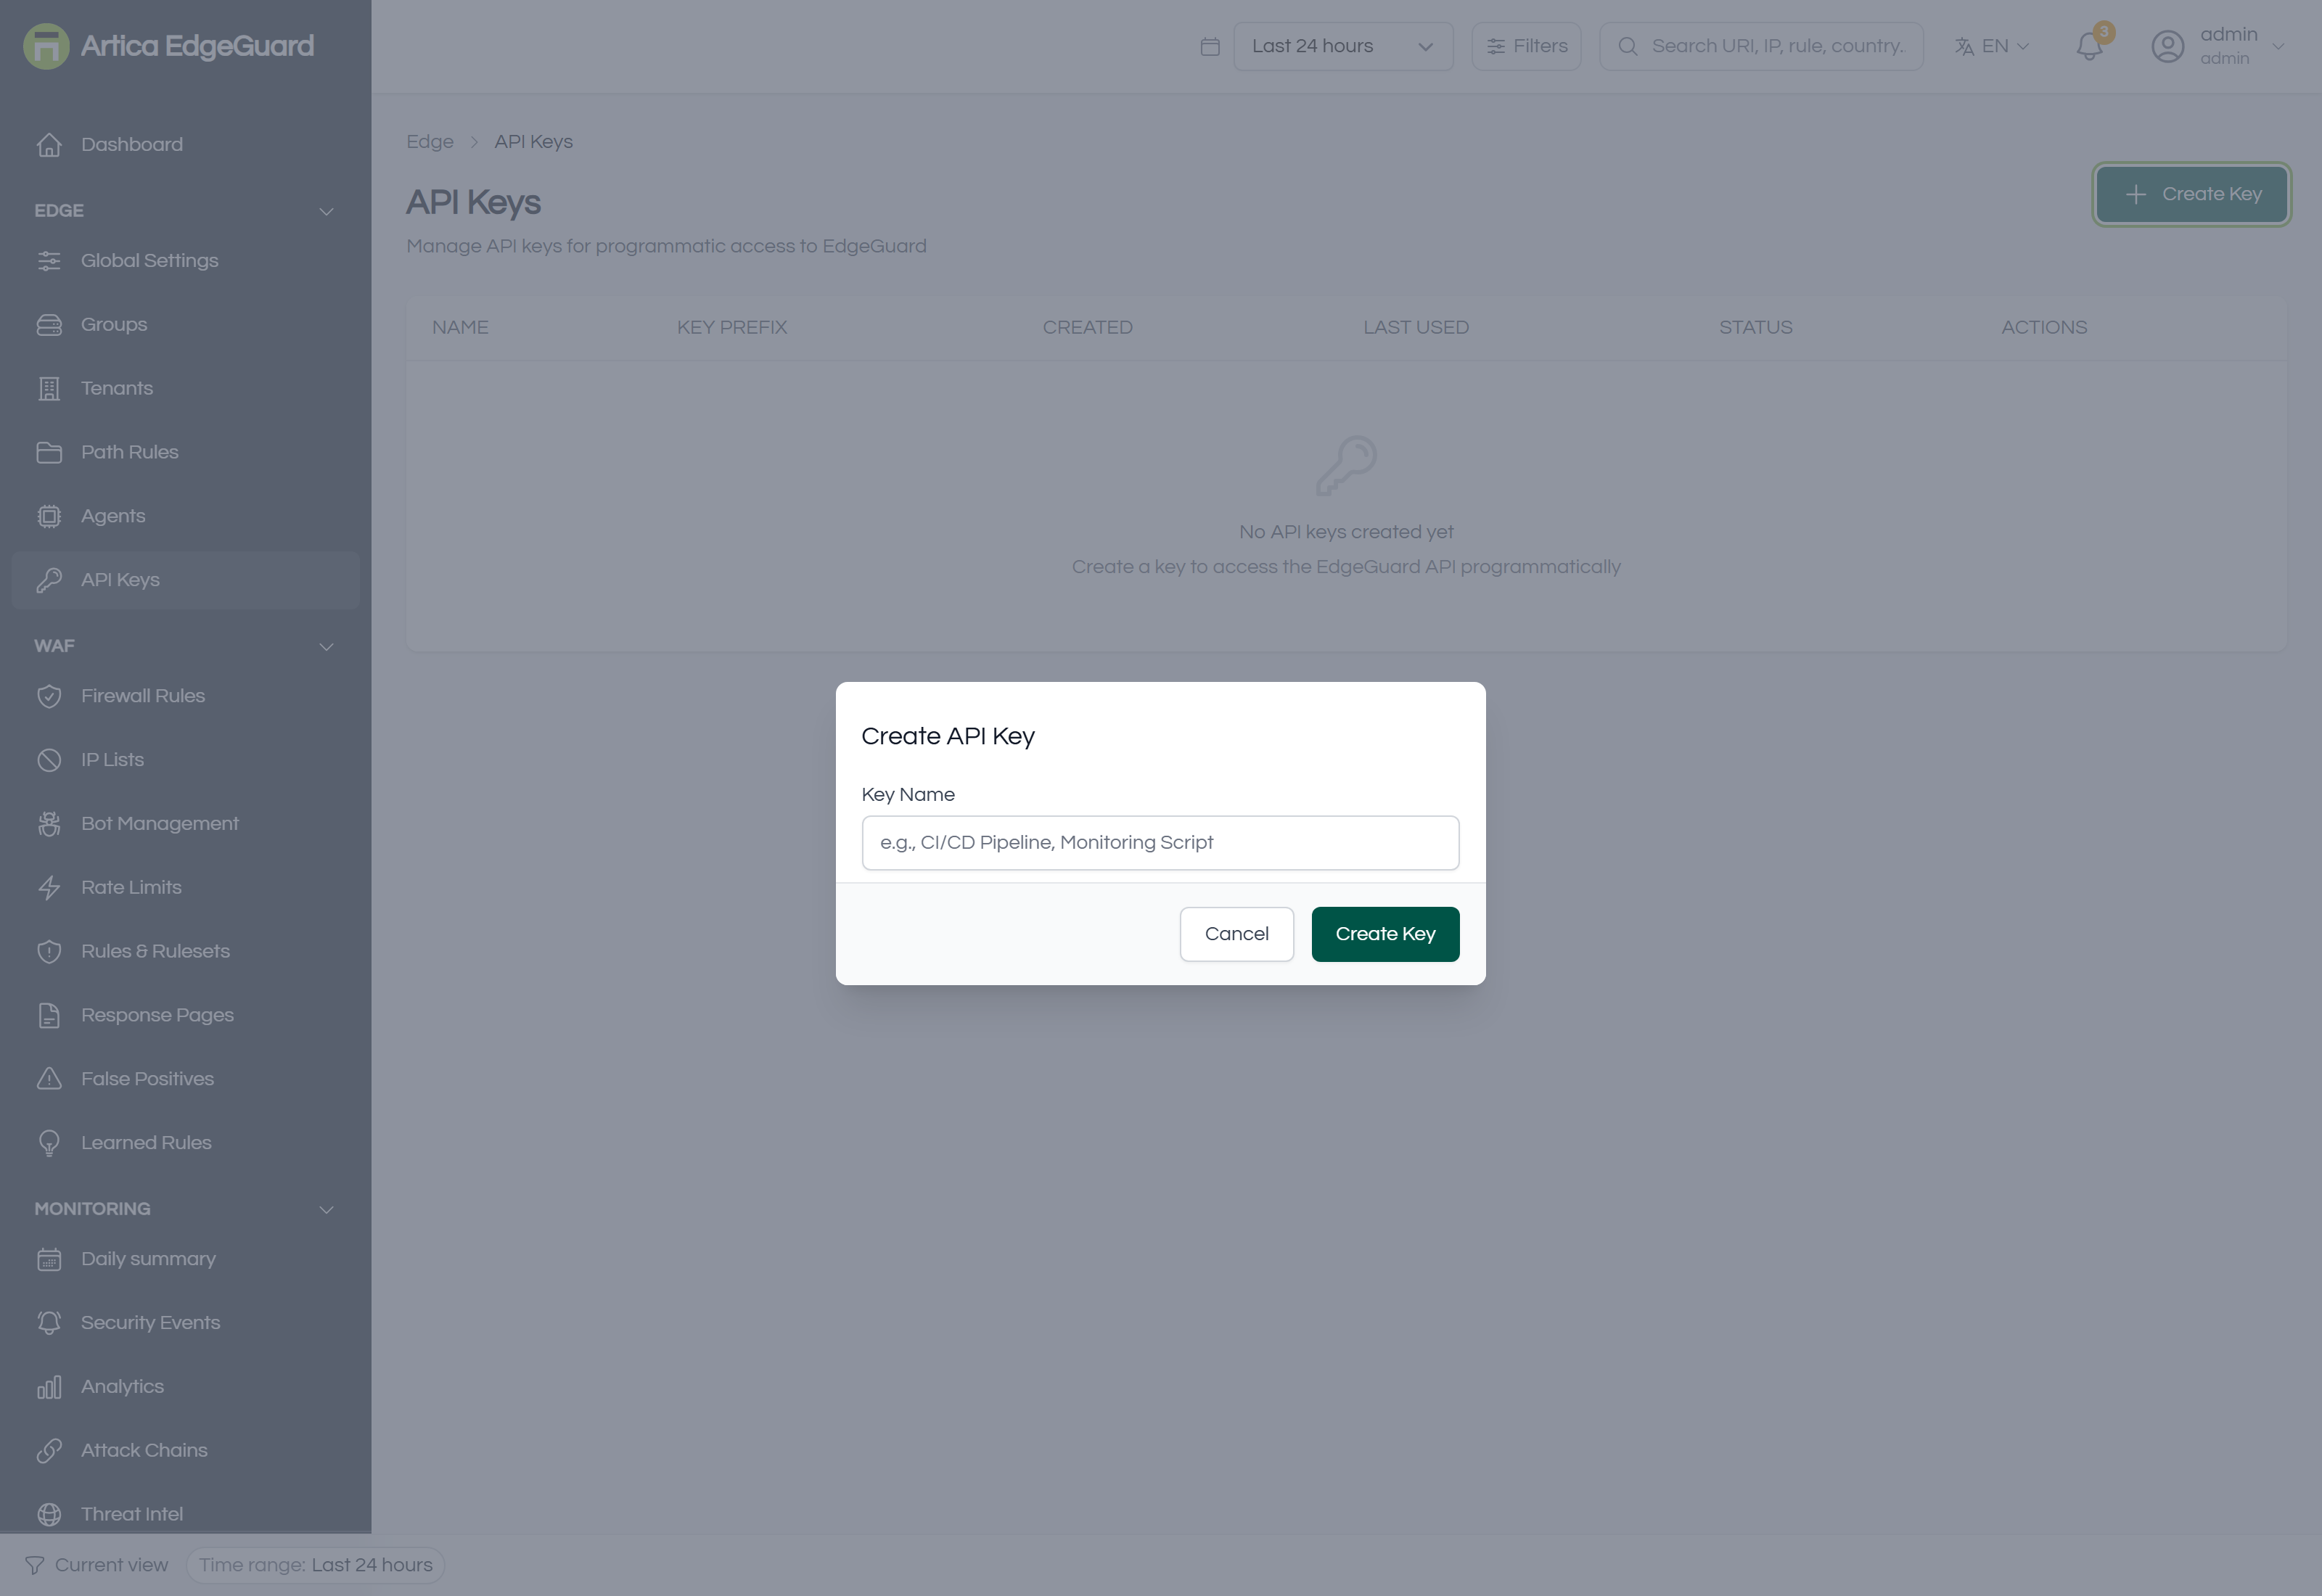
Full documentation: EdgeGuard — API Keys
¶ WAF
What is inspected and what is done about it.
¶ Firewall Rules
Conditions you write yourself — country, continent, path, address, method, user agent, ASN — and the action to take. Evaluated before detection, so an allow rule here skips everything after it.
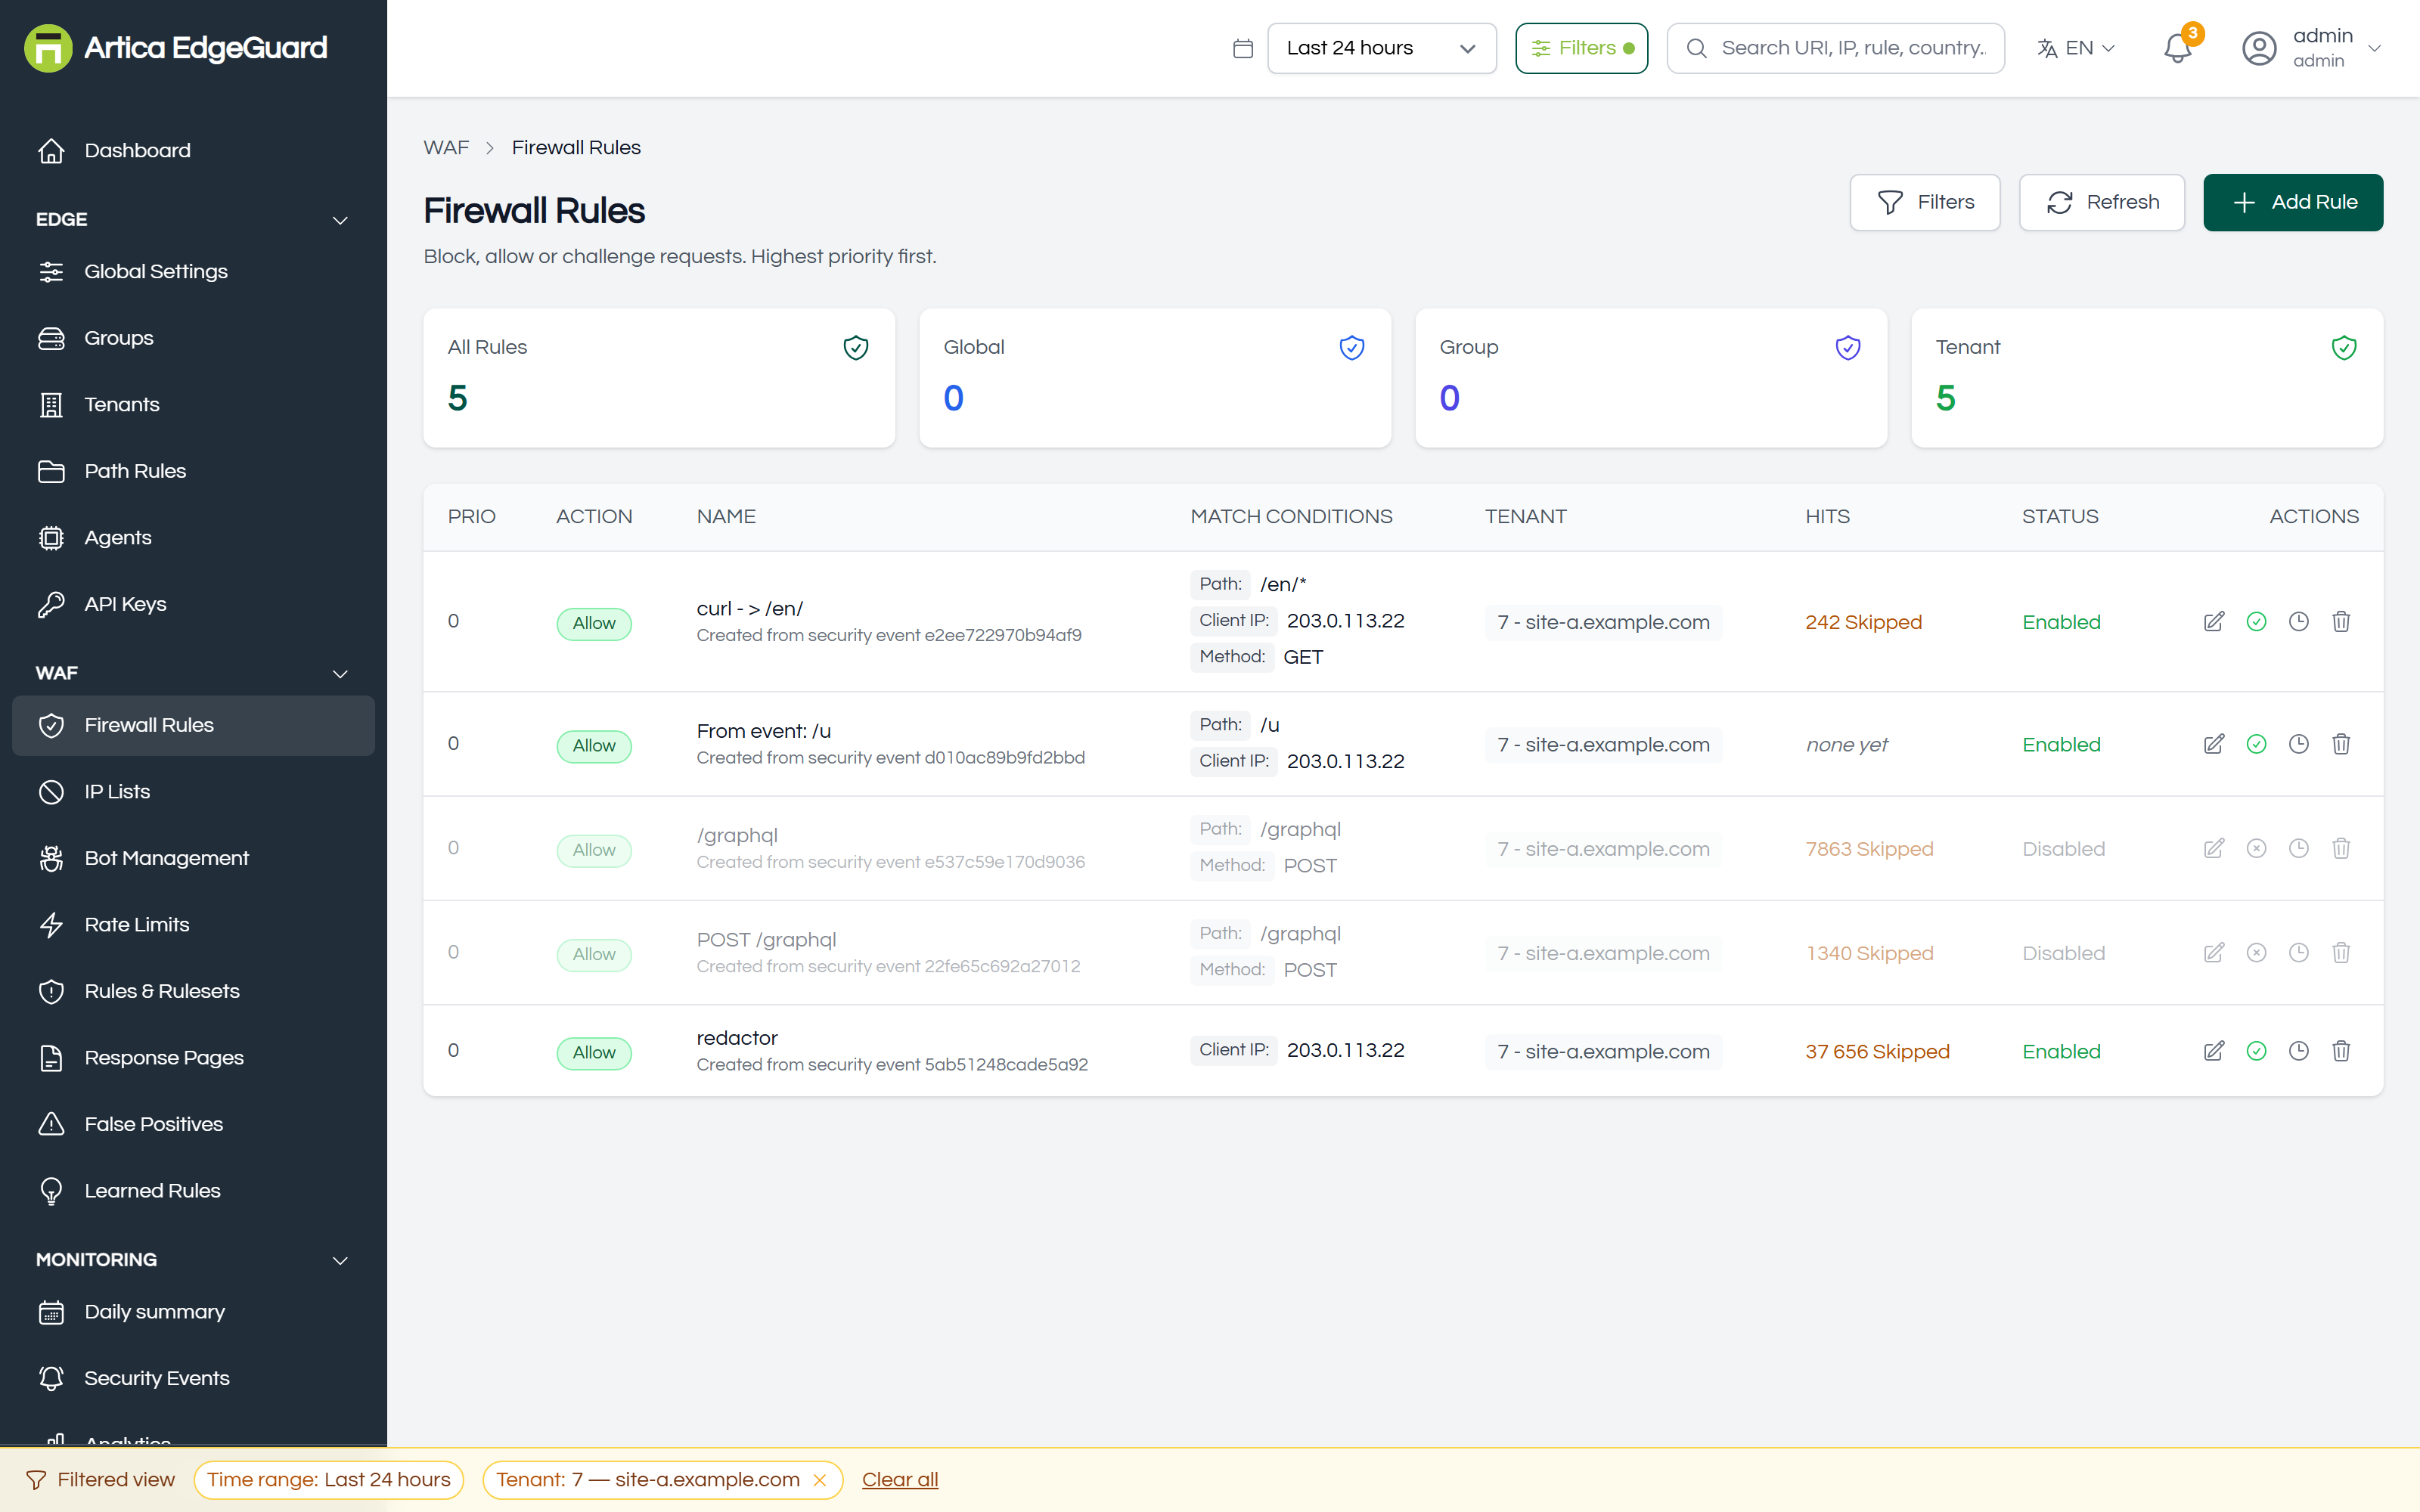
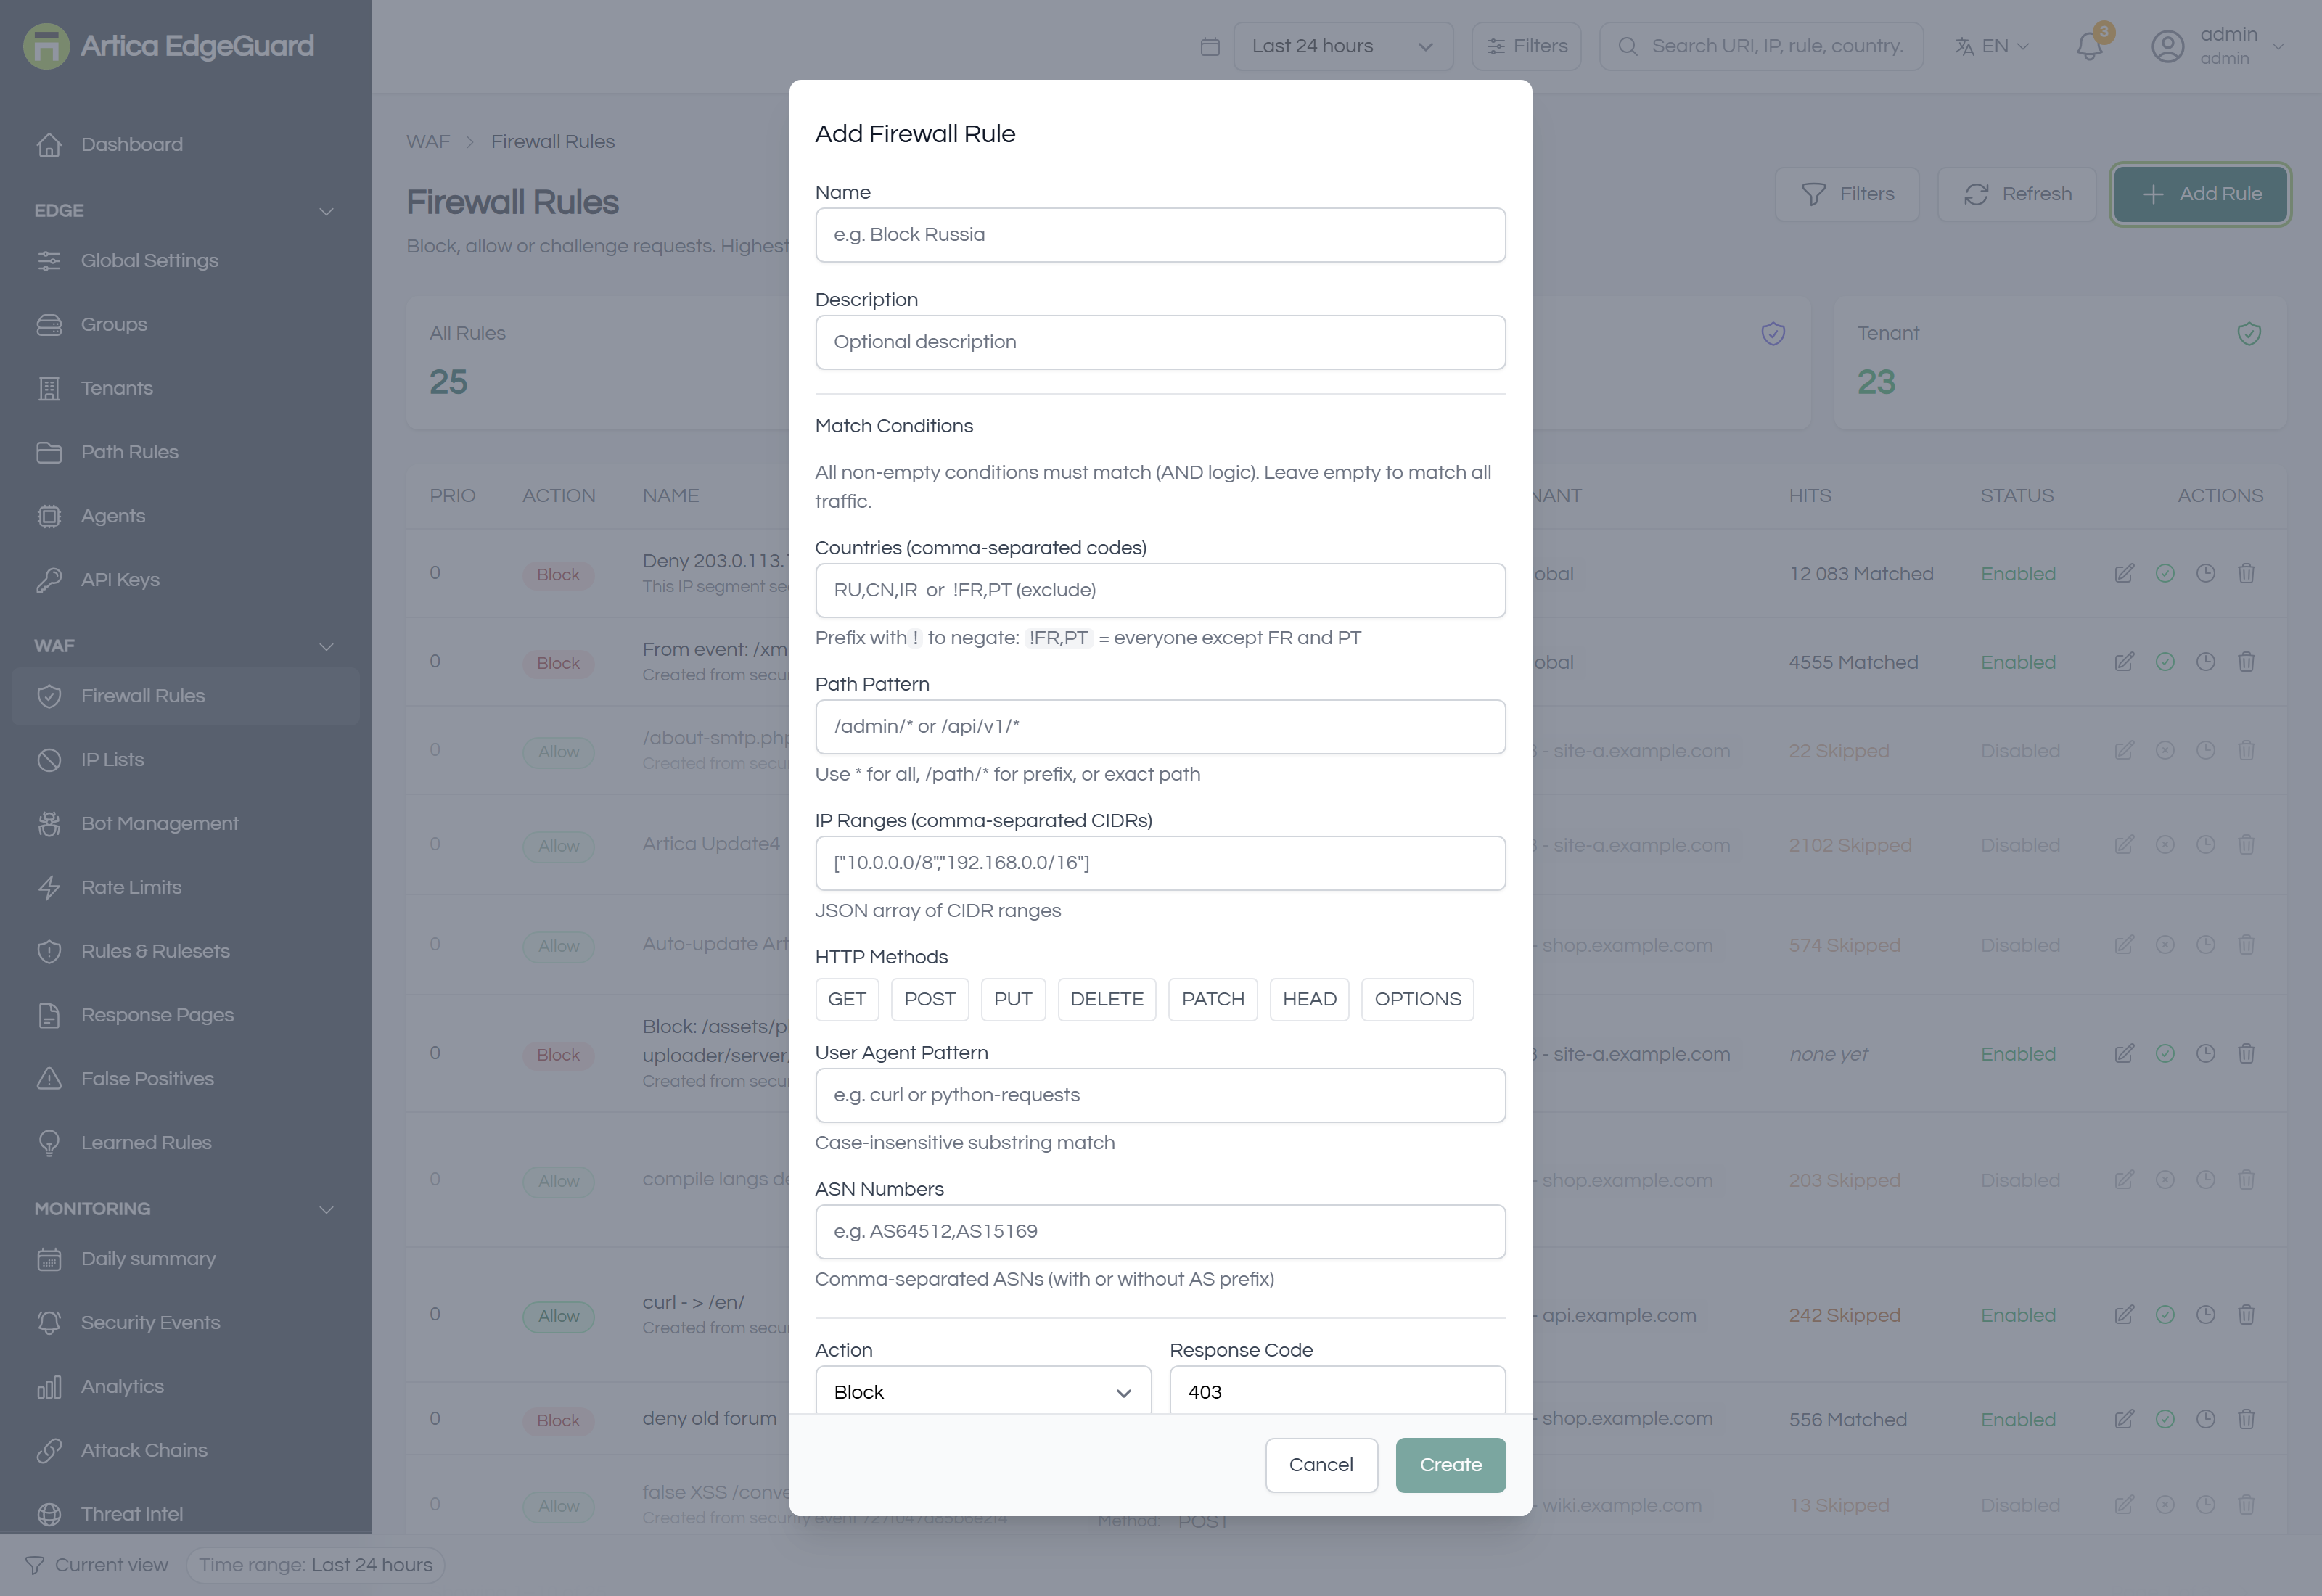
Full documentation: EdgeGuard — Firewall Rules
¶ IP Lists
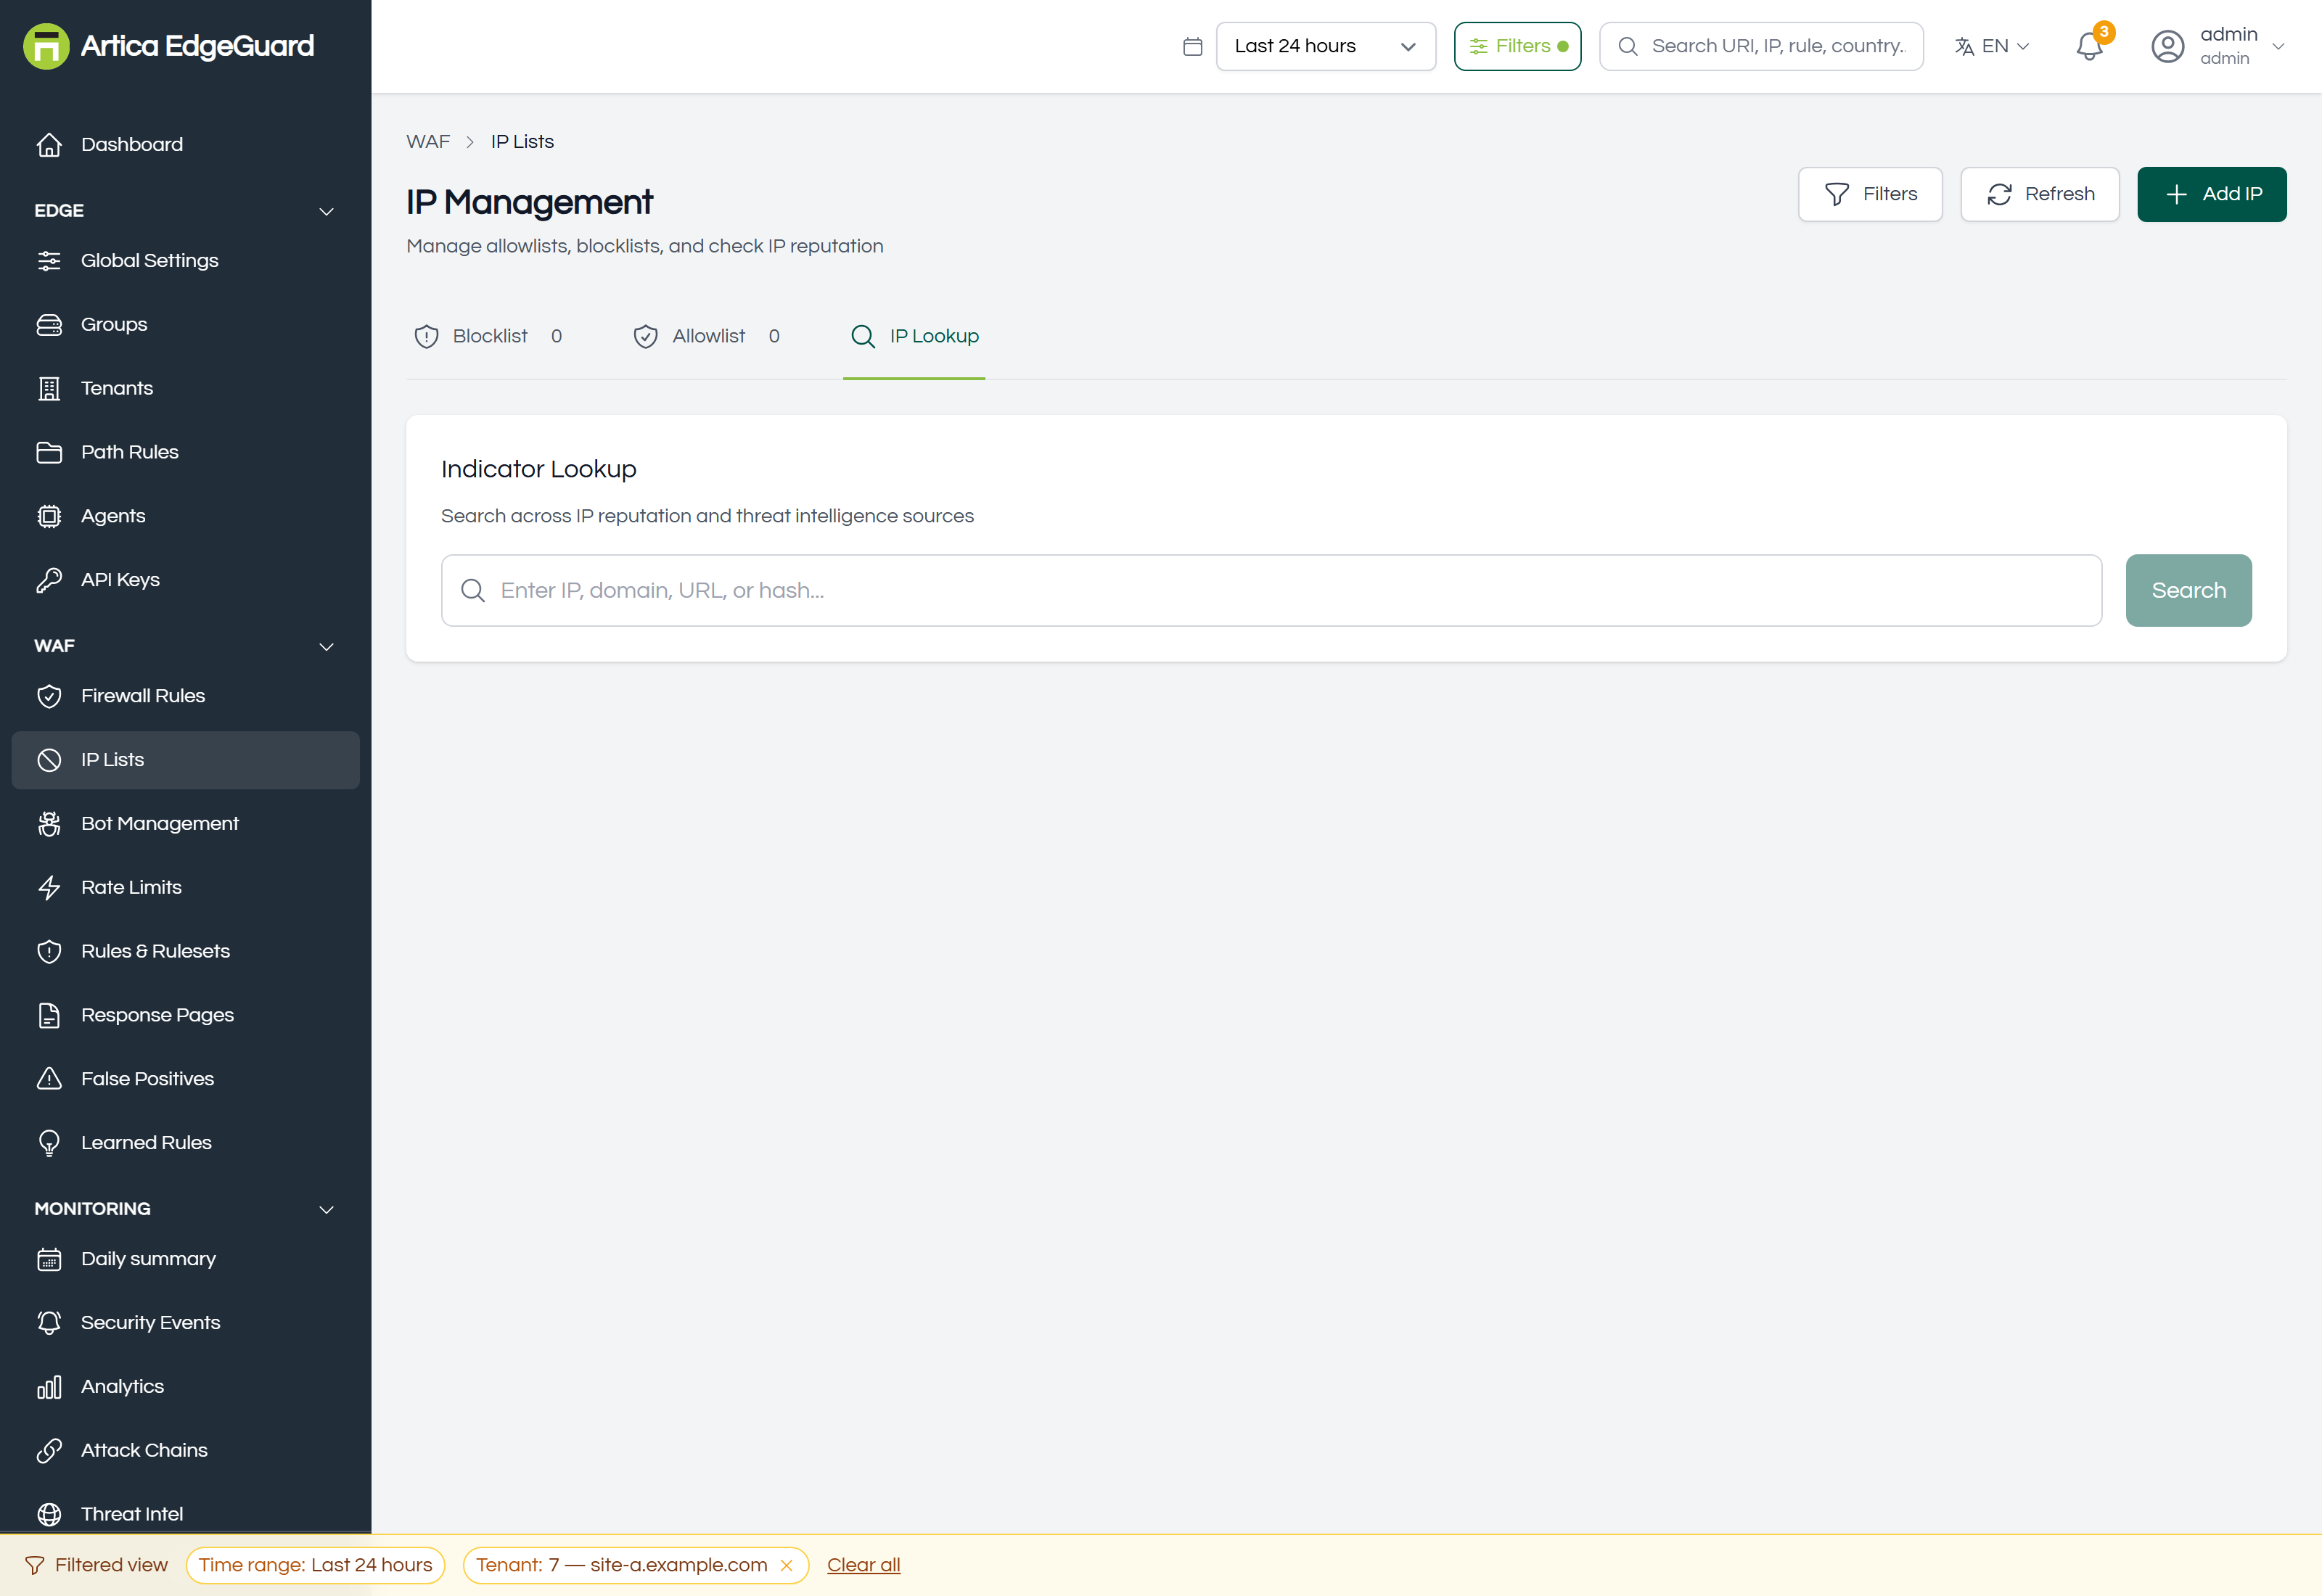
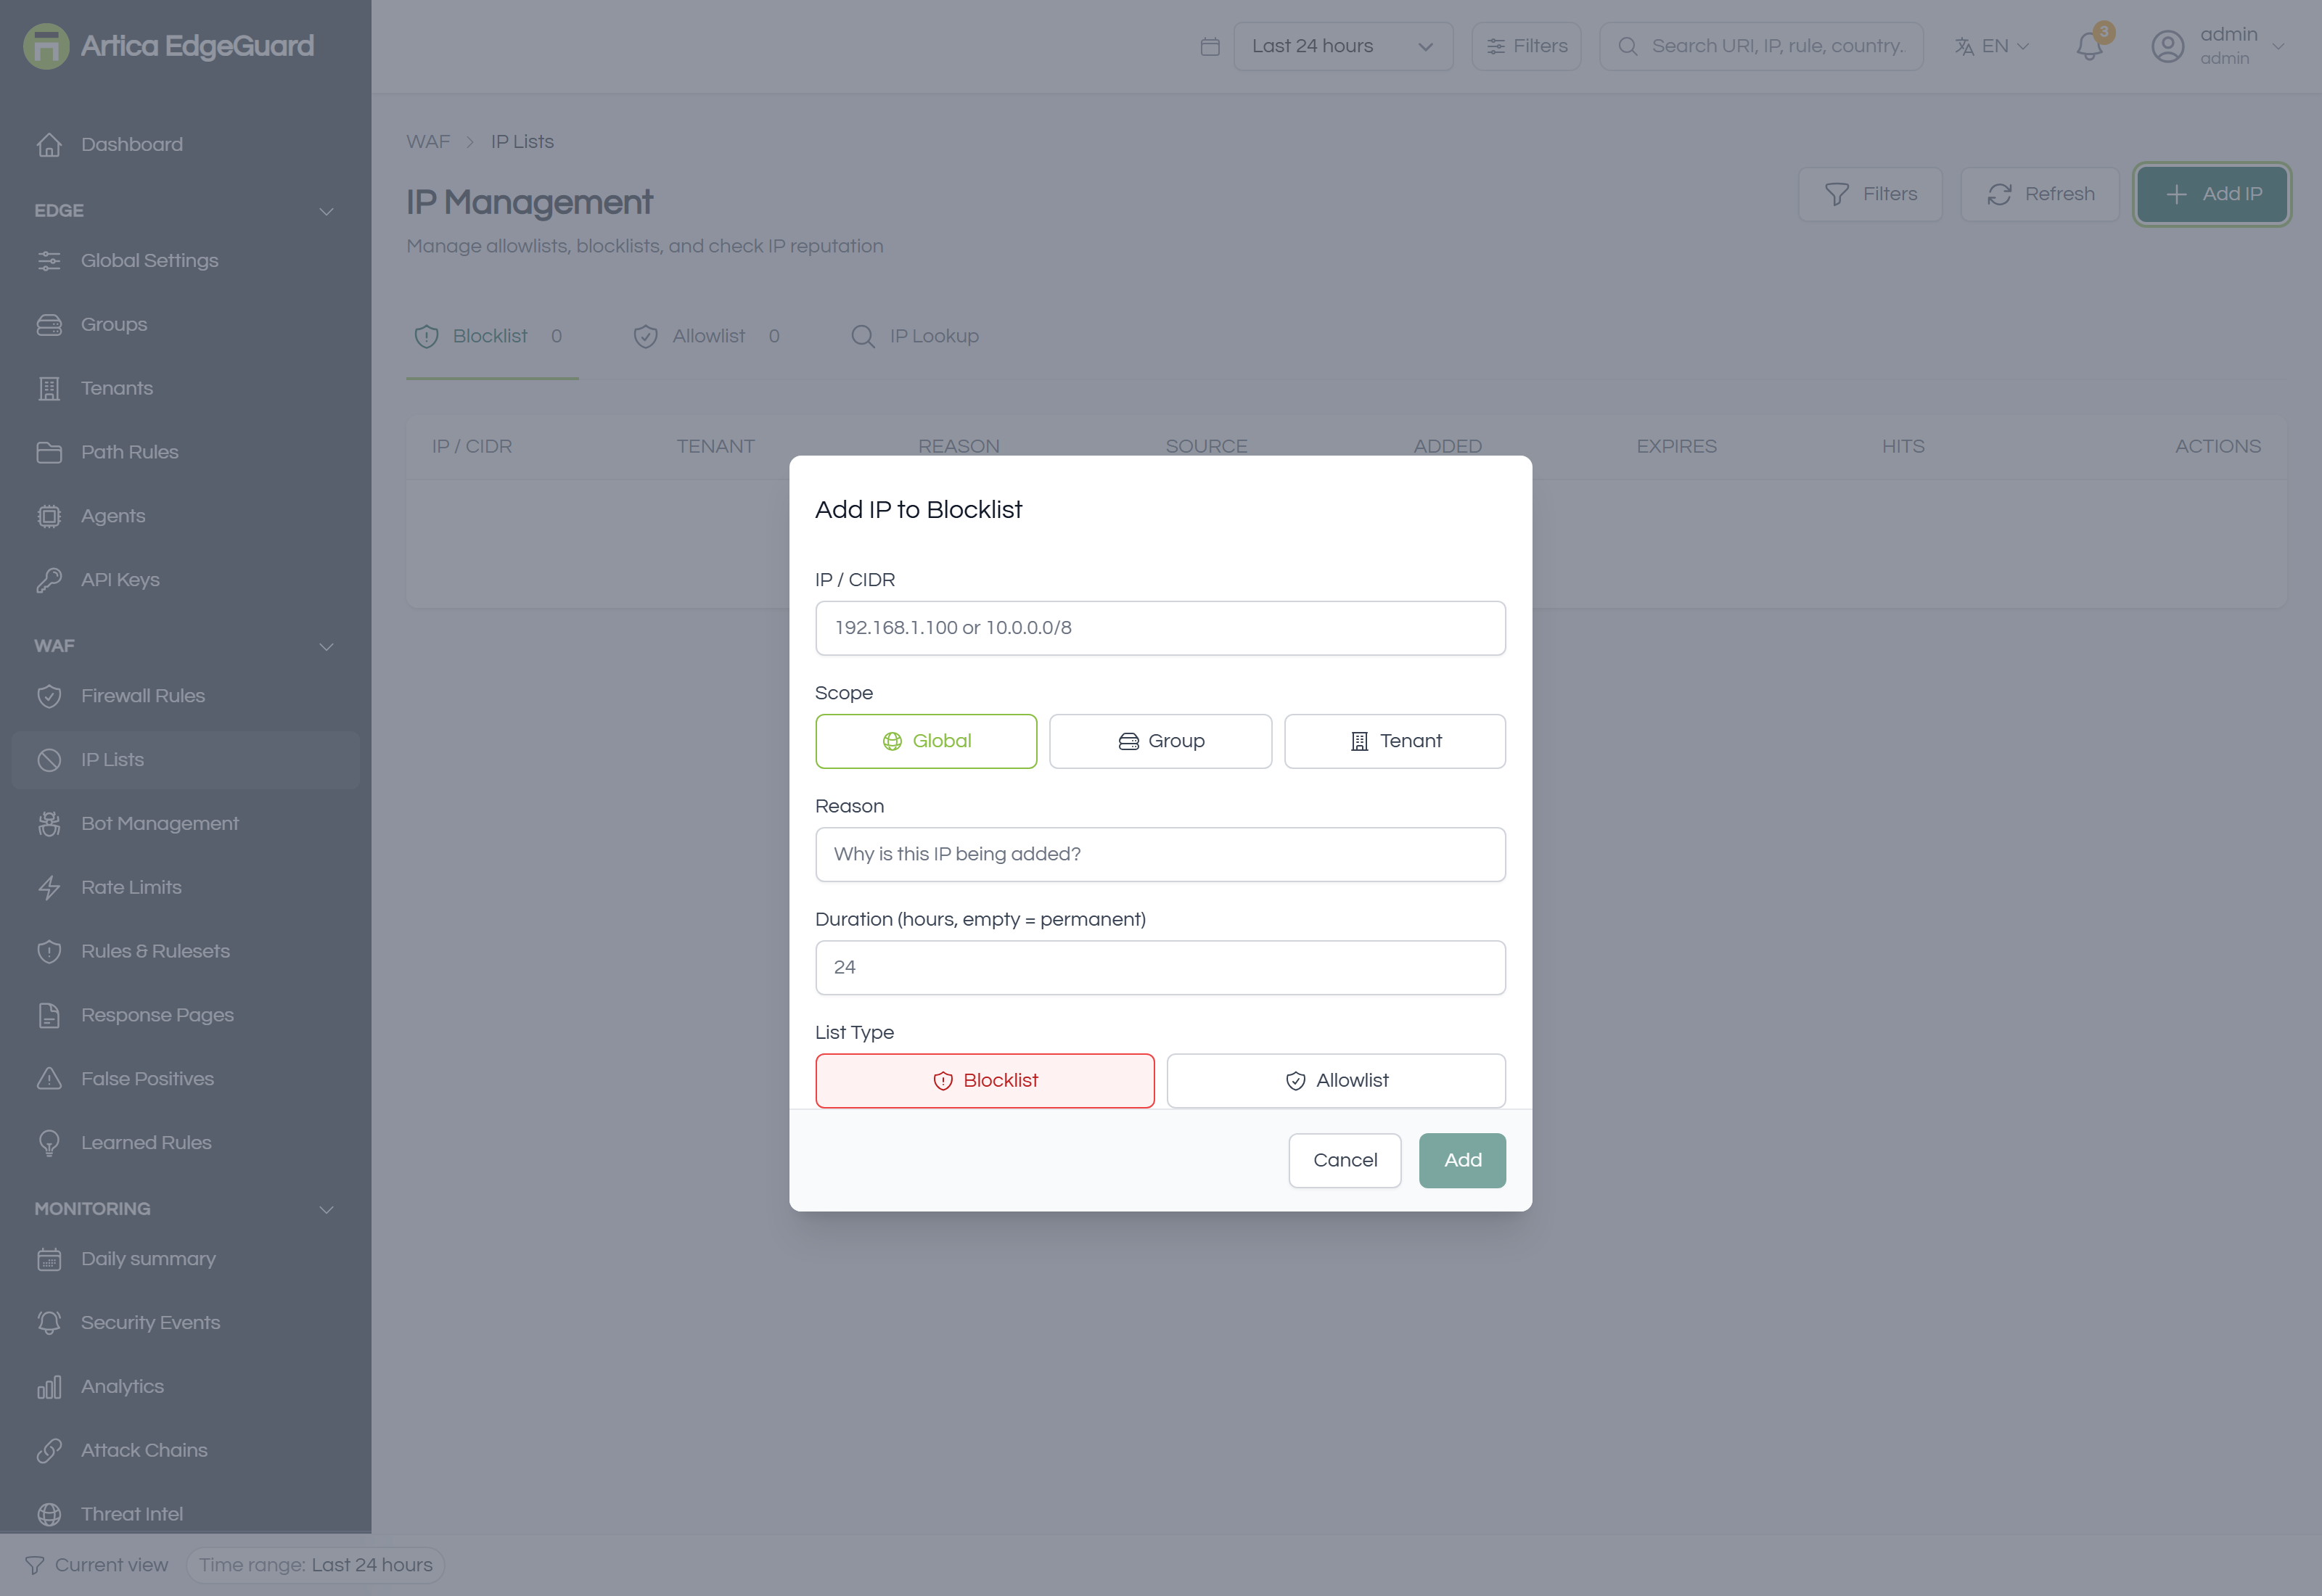
Allowlists and blocklists, with expiry. Evaluated before everything else, which is what makes an allowlist entry a decision to skip the WAF for that address.
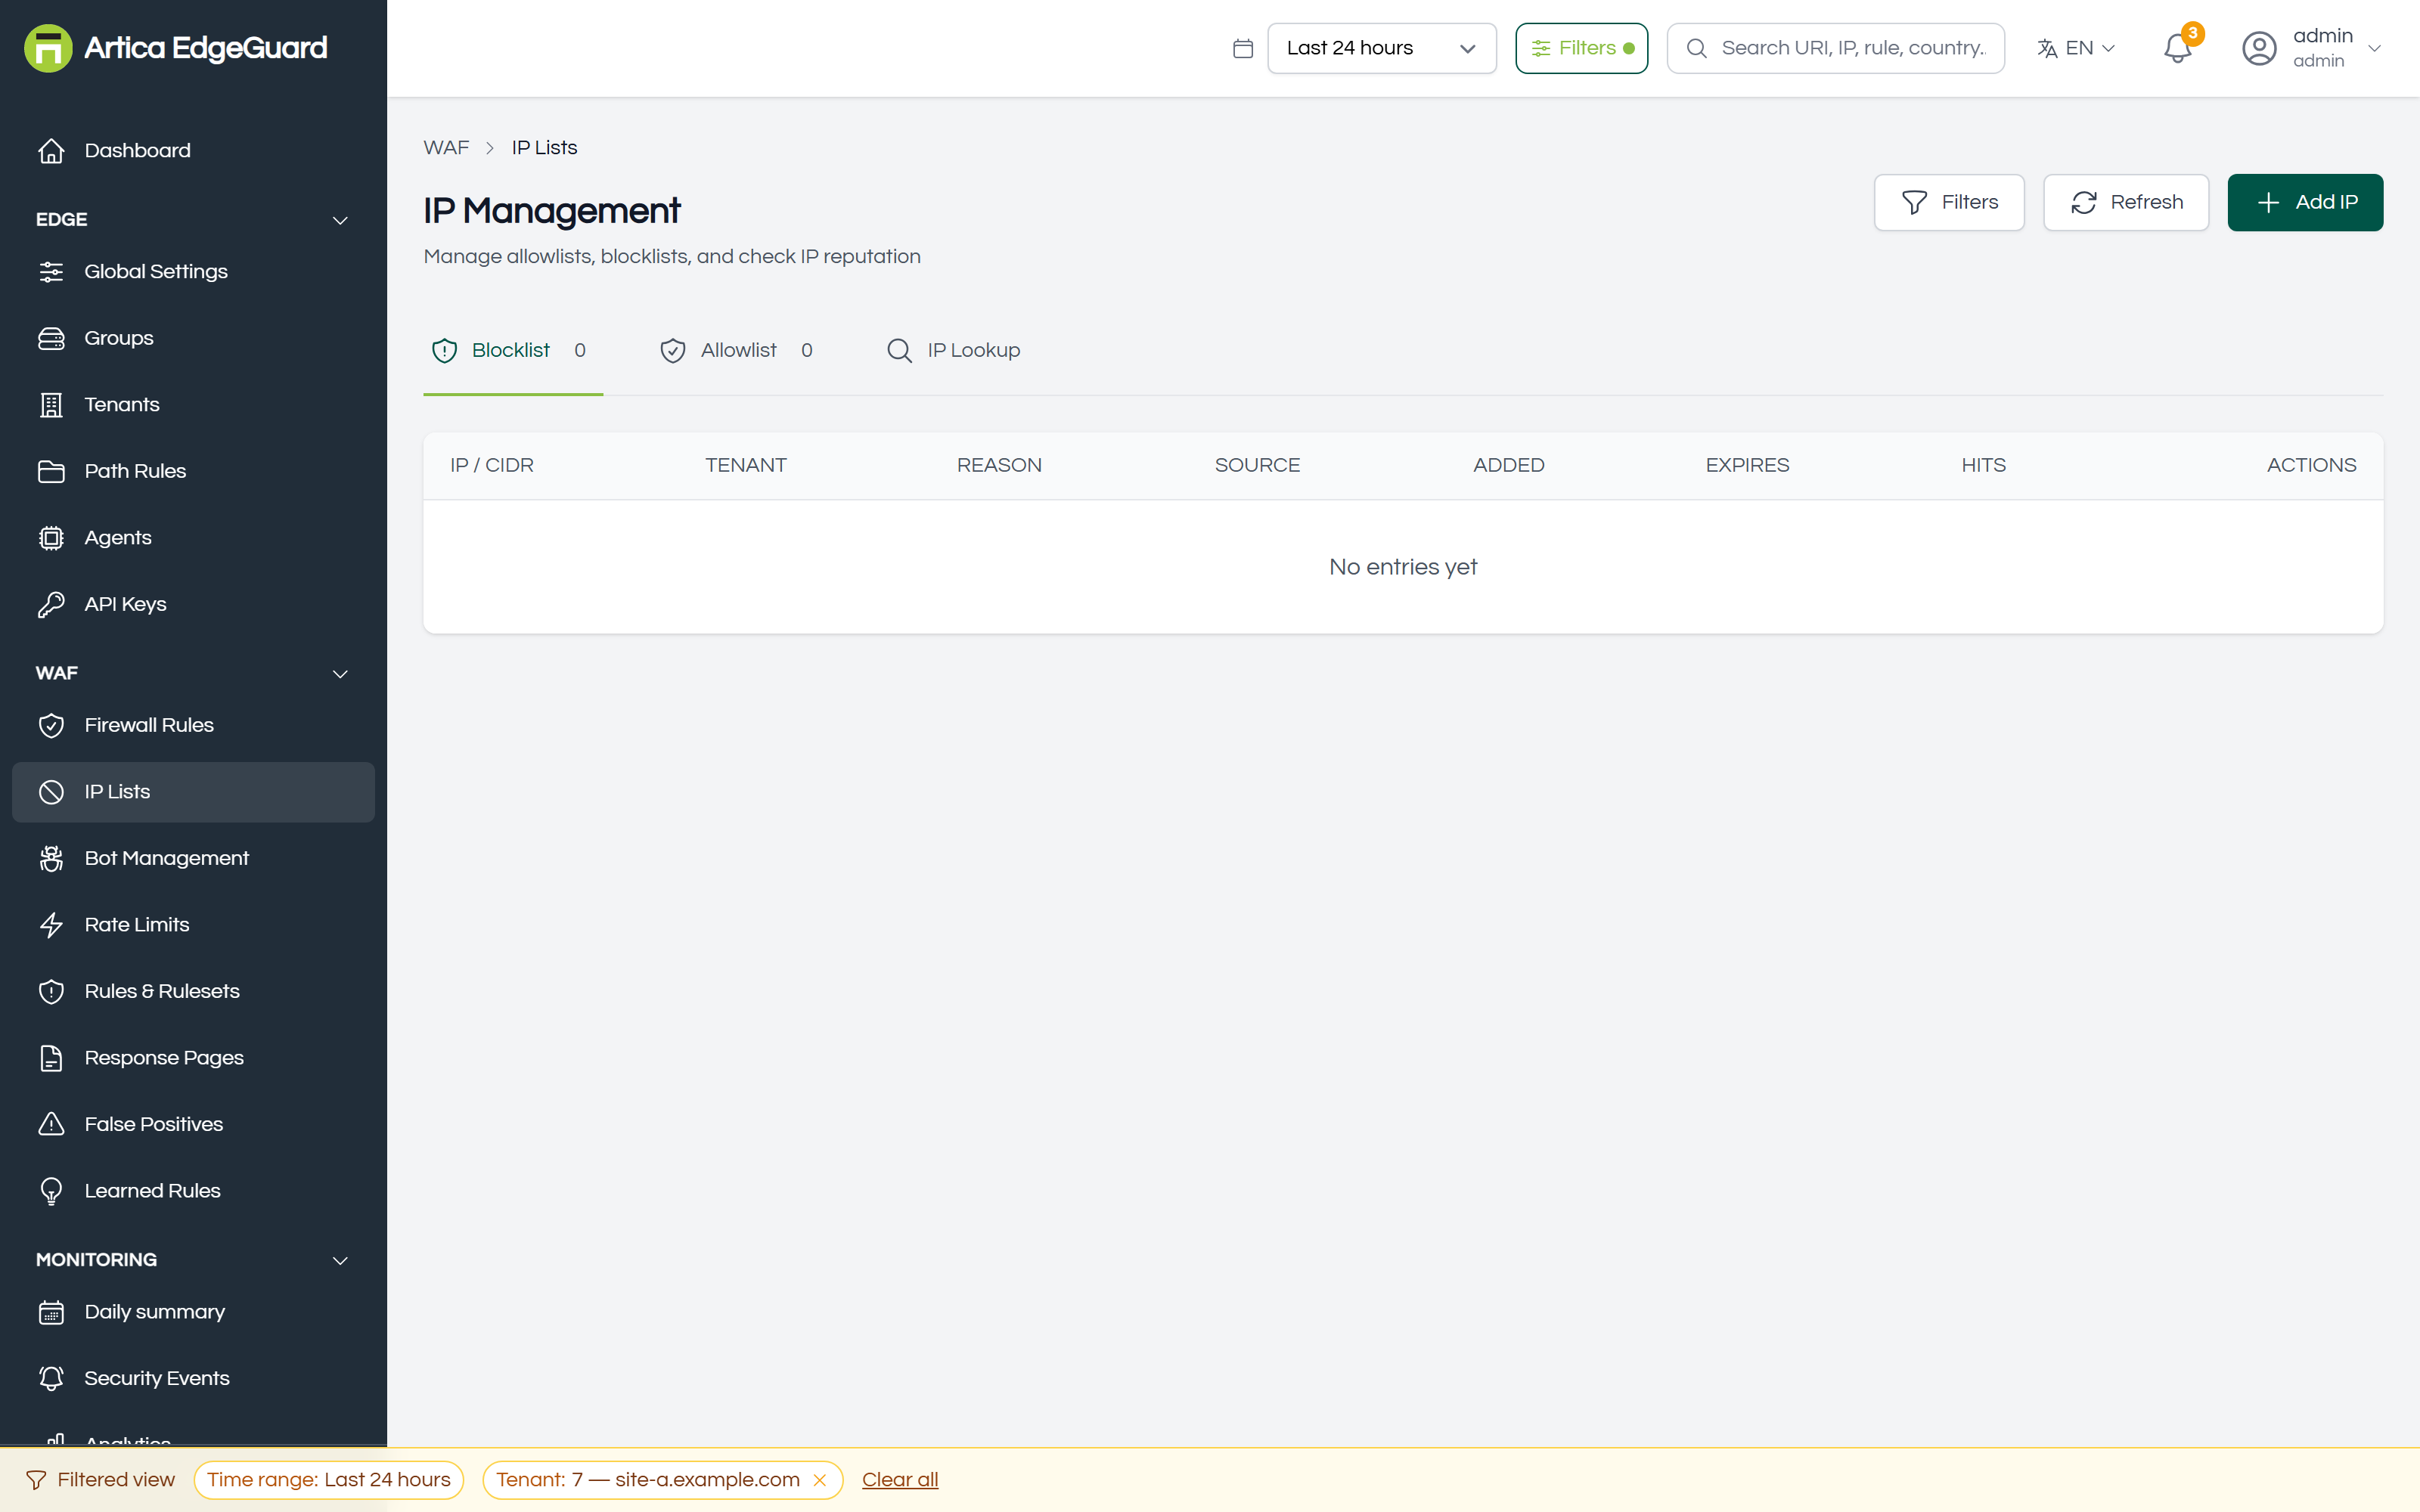
Full documentation: EdgeGuard — IP Lists
¶ Bot Management
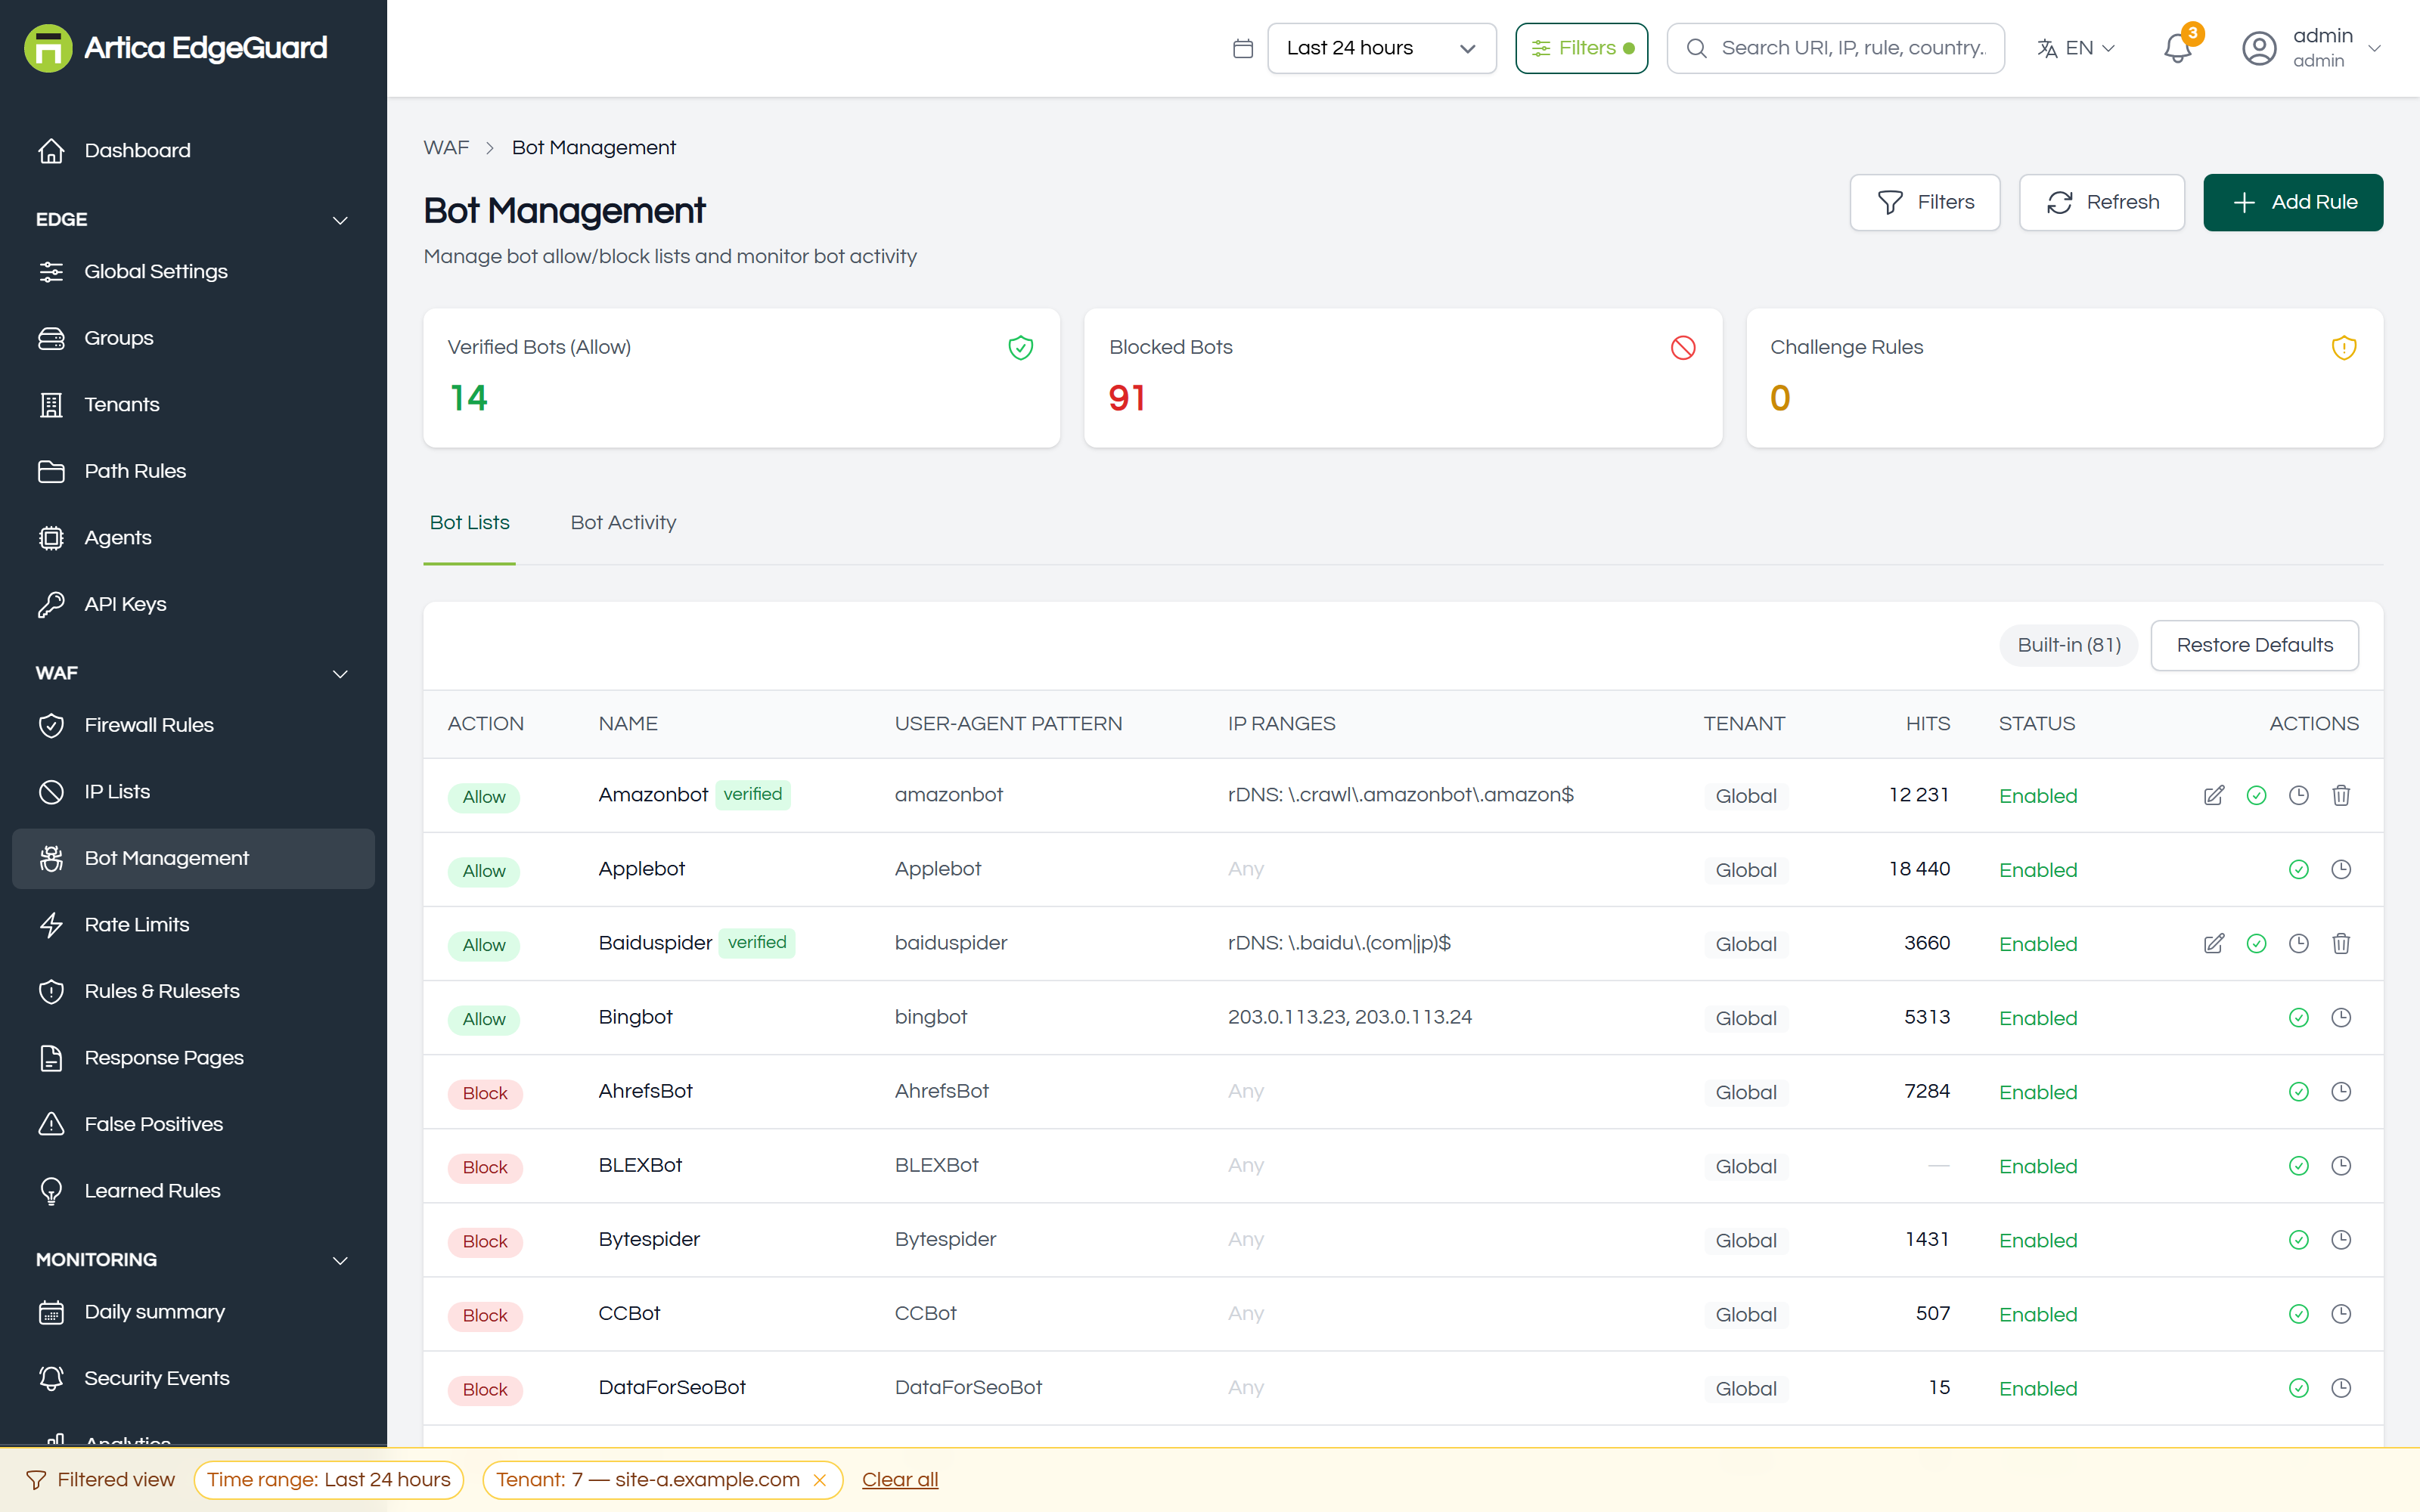
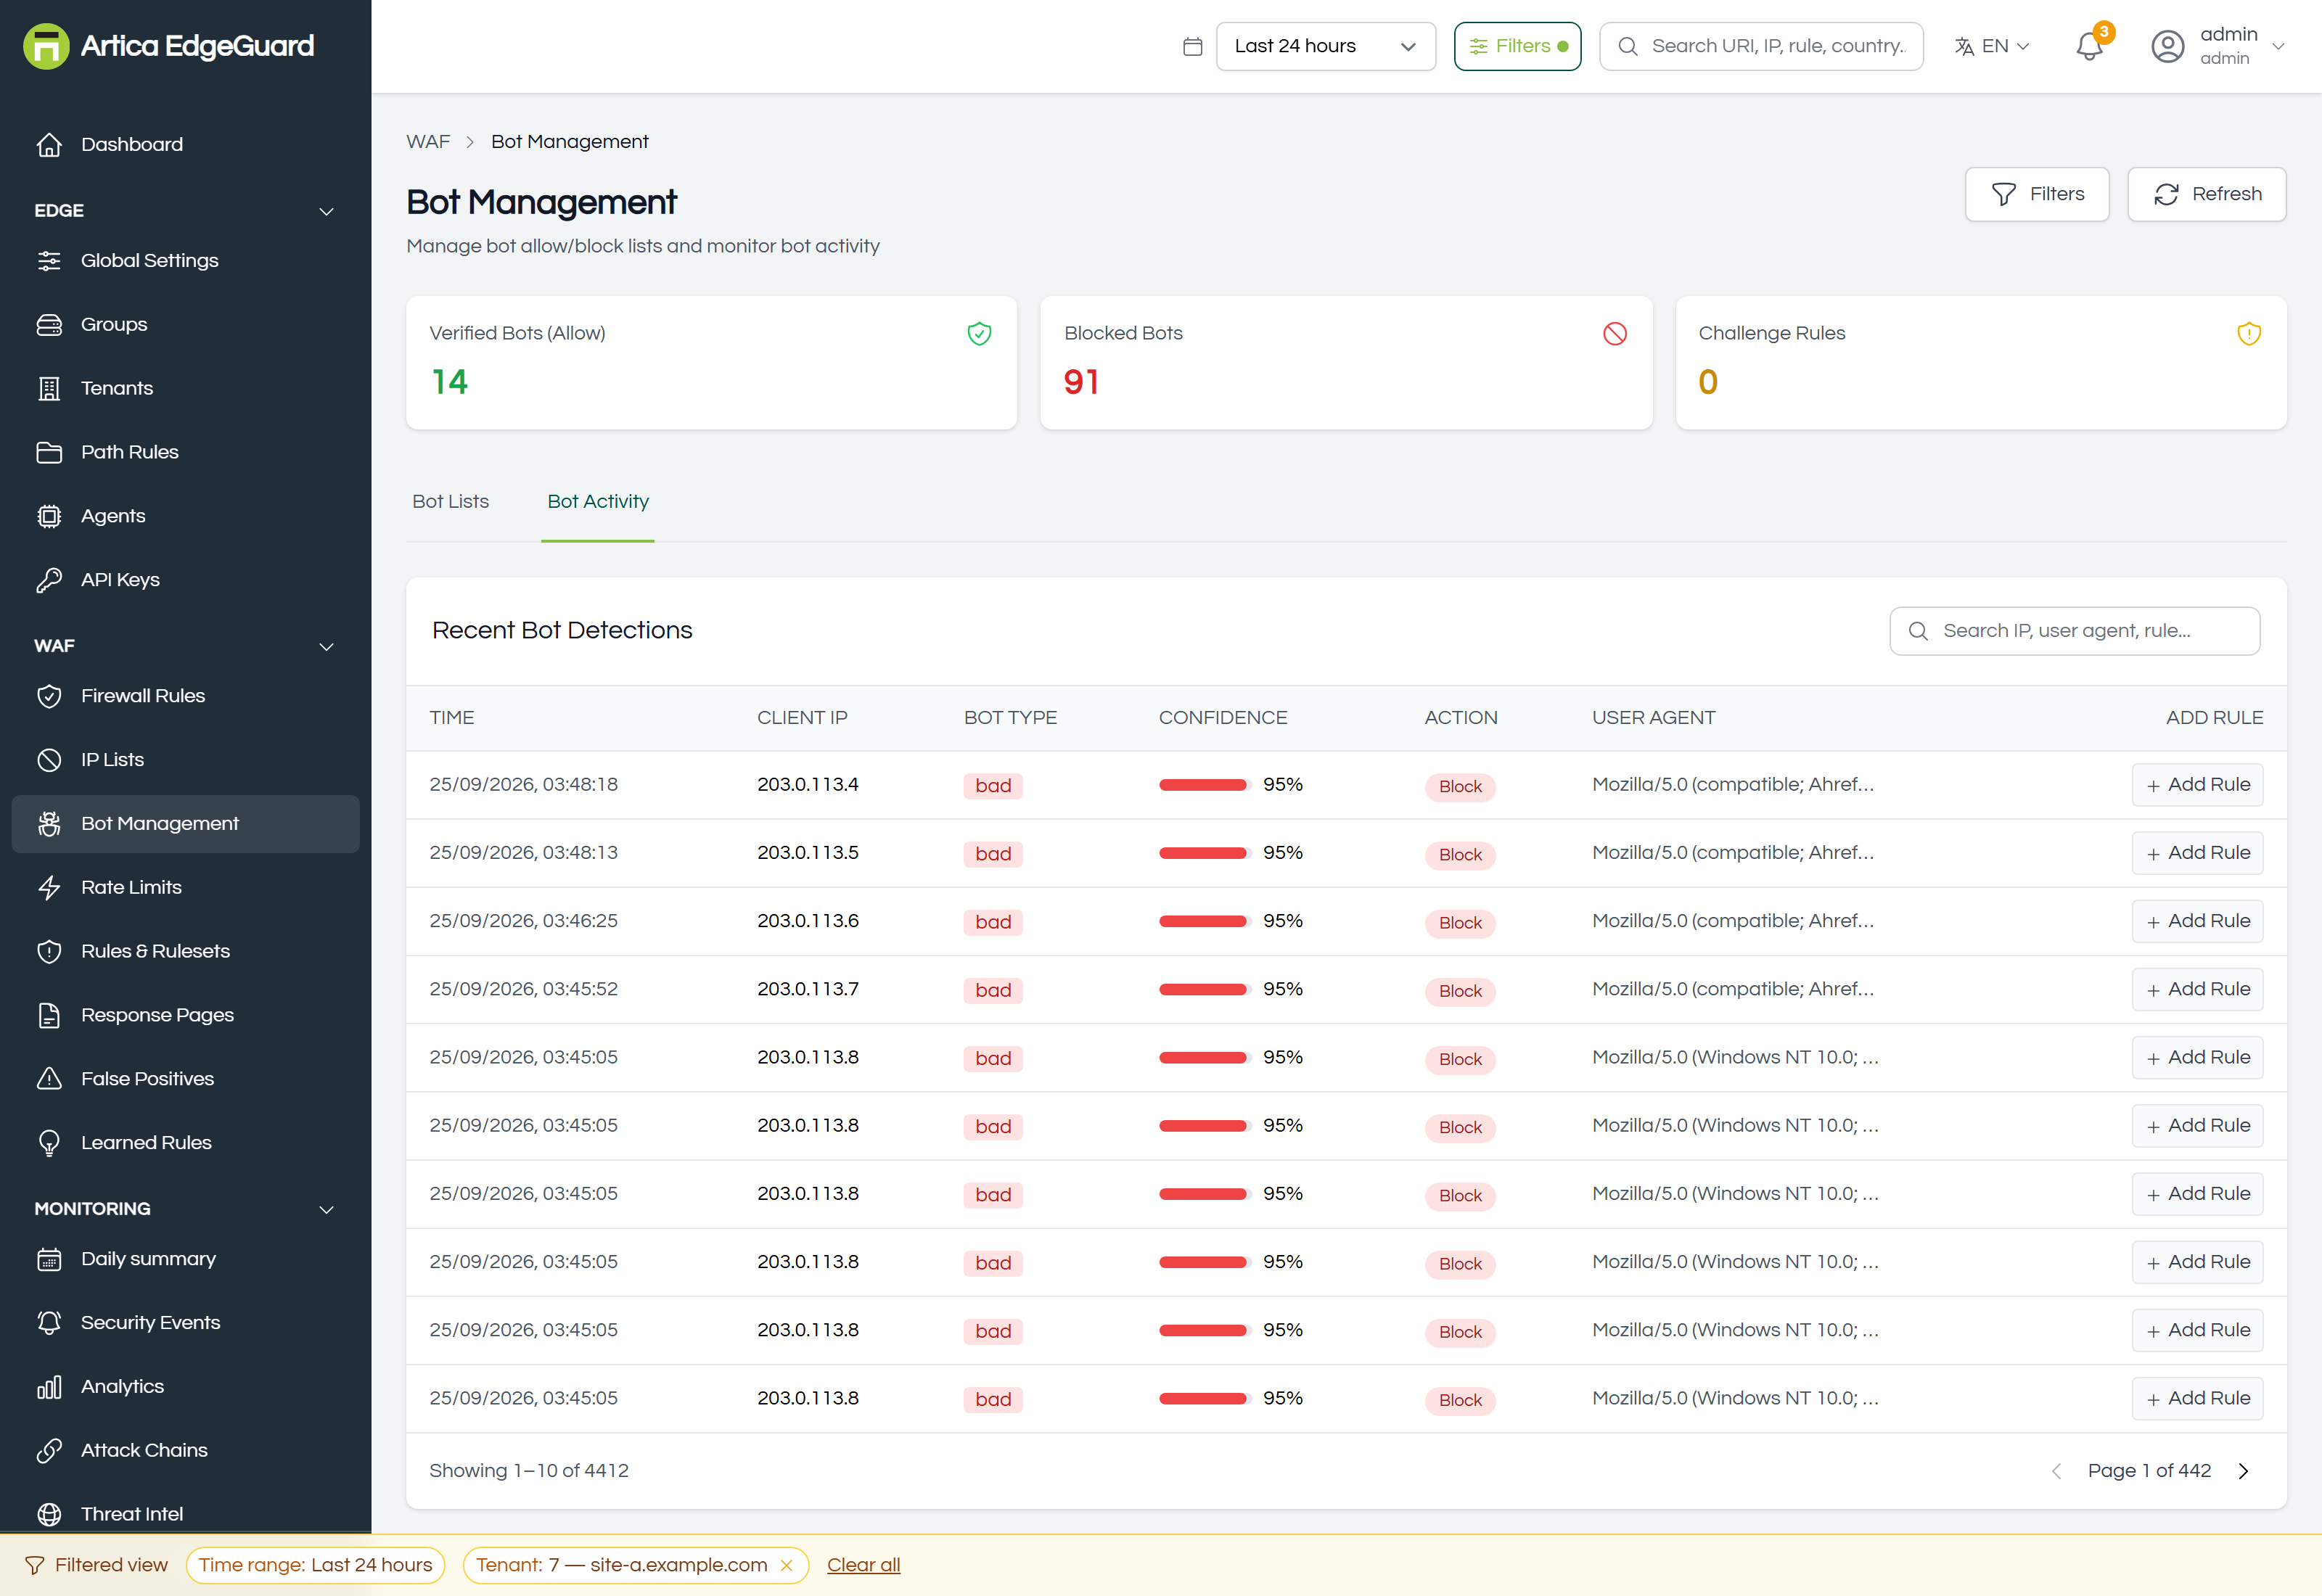
Telling a crawler from a scraper: verification by reverse DNS, allowlists for the crawlers you want, challenges for the rest.
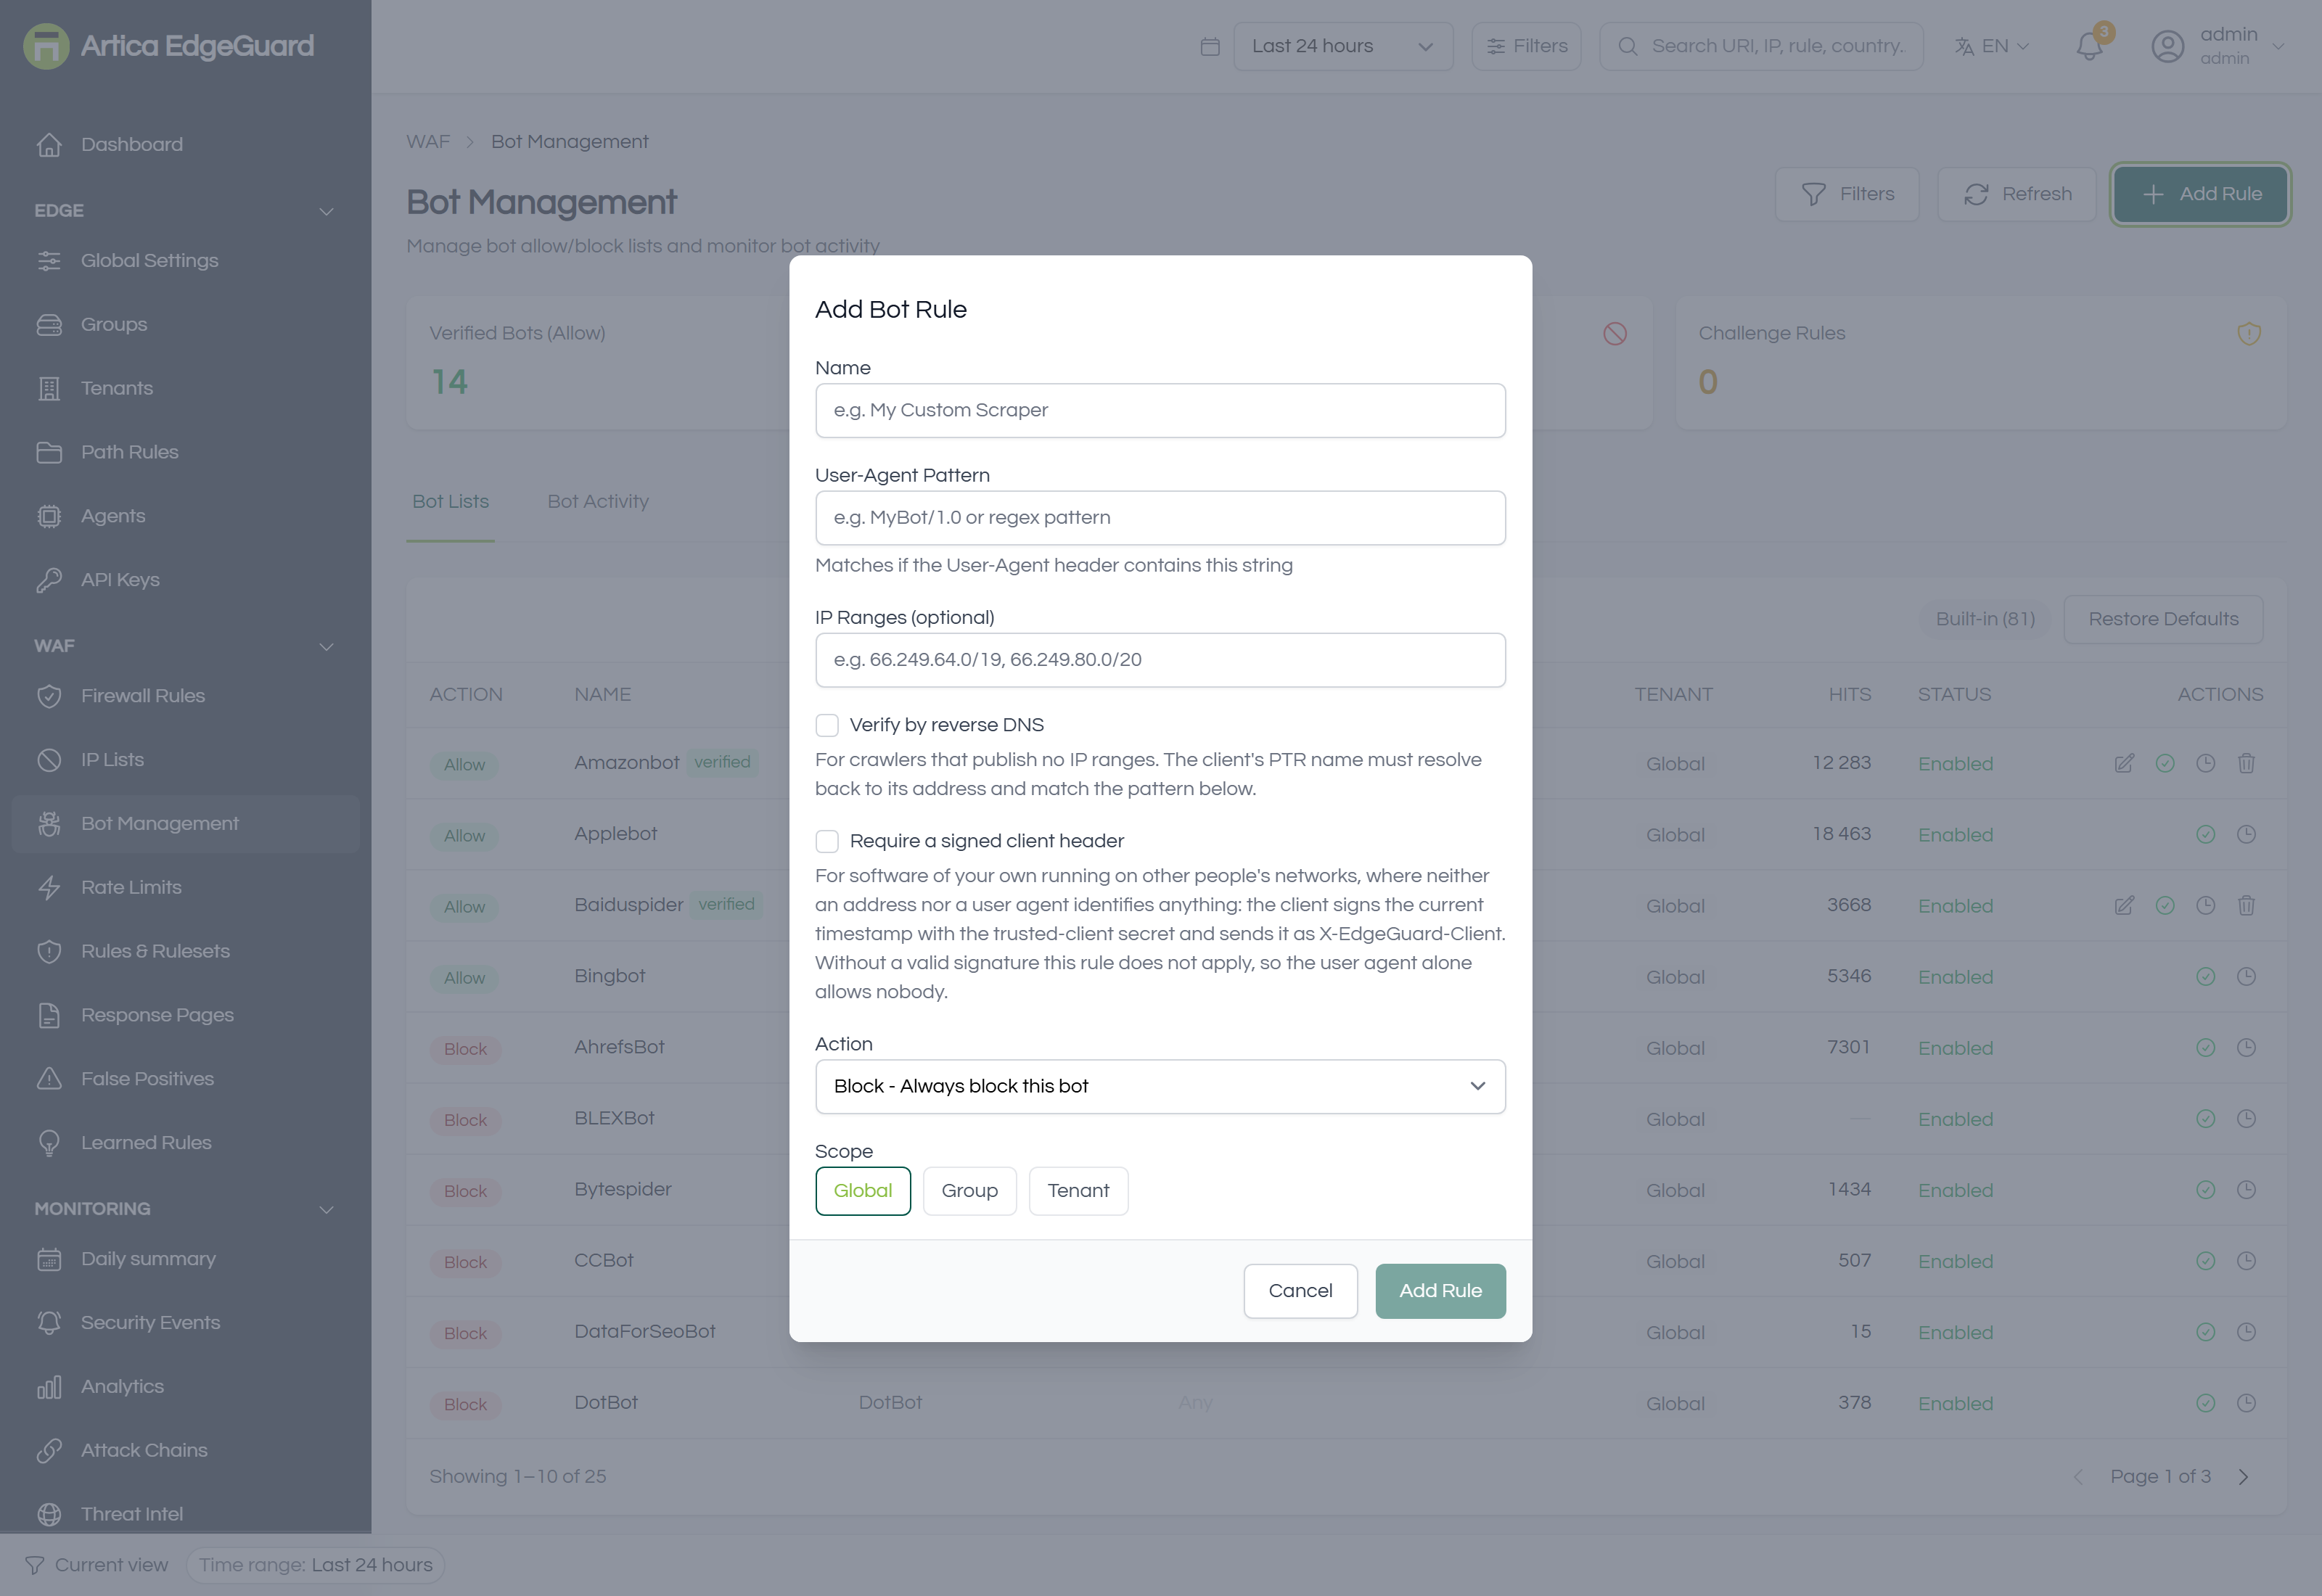
Full documentation: EdgeGuard — Bot Management
¶ Rate Limits
How often one client may ask, per site or per path. The allowance is counted over the window, not per second.
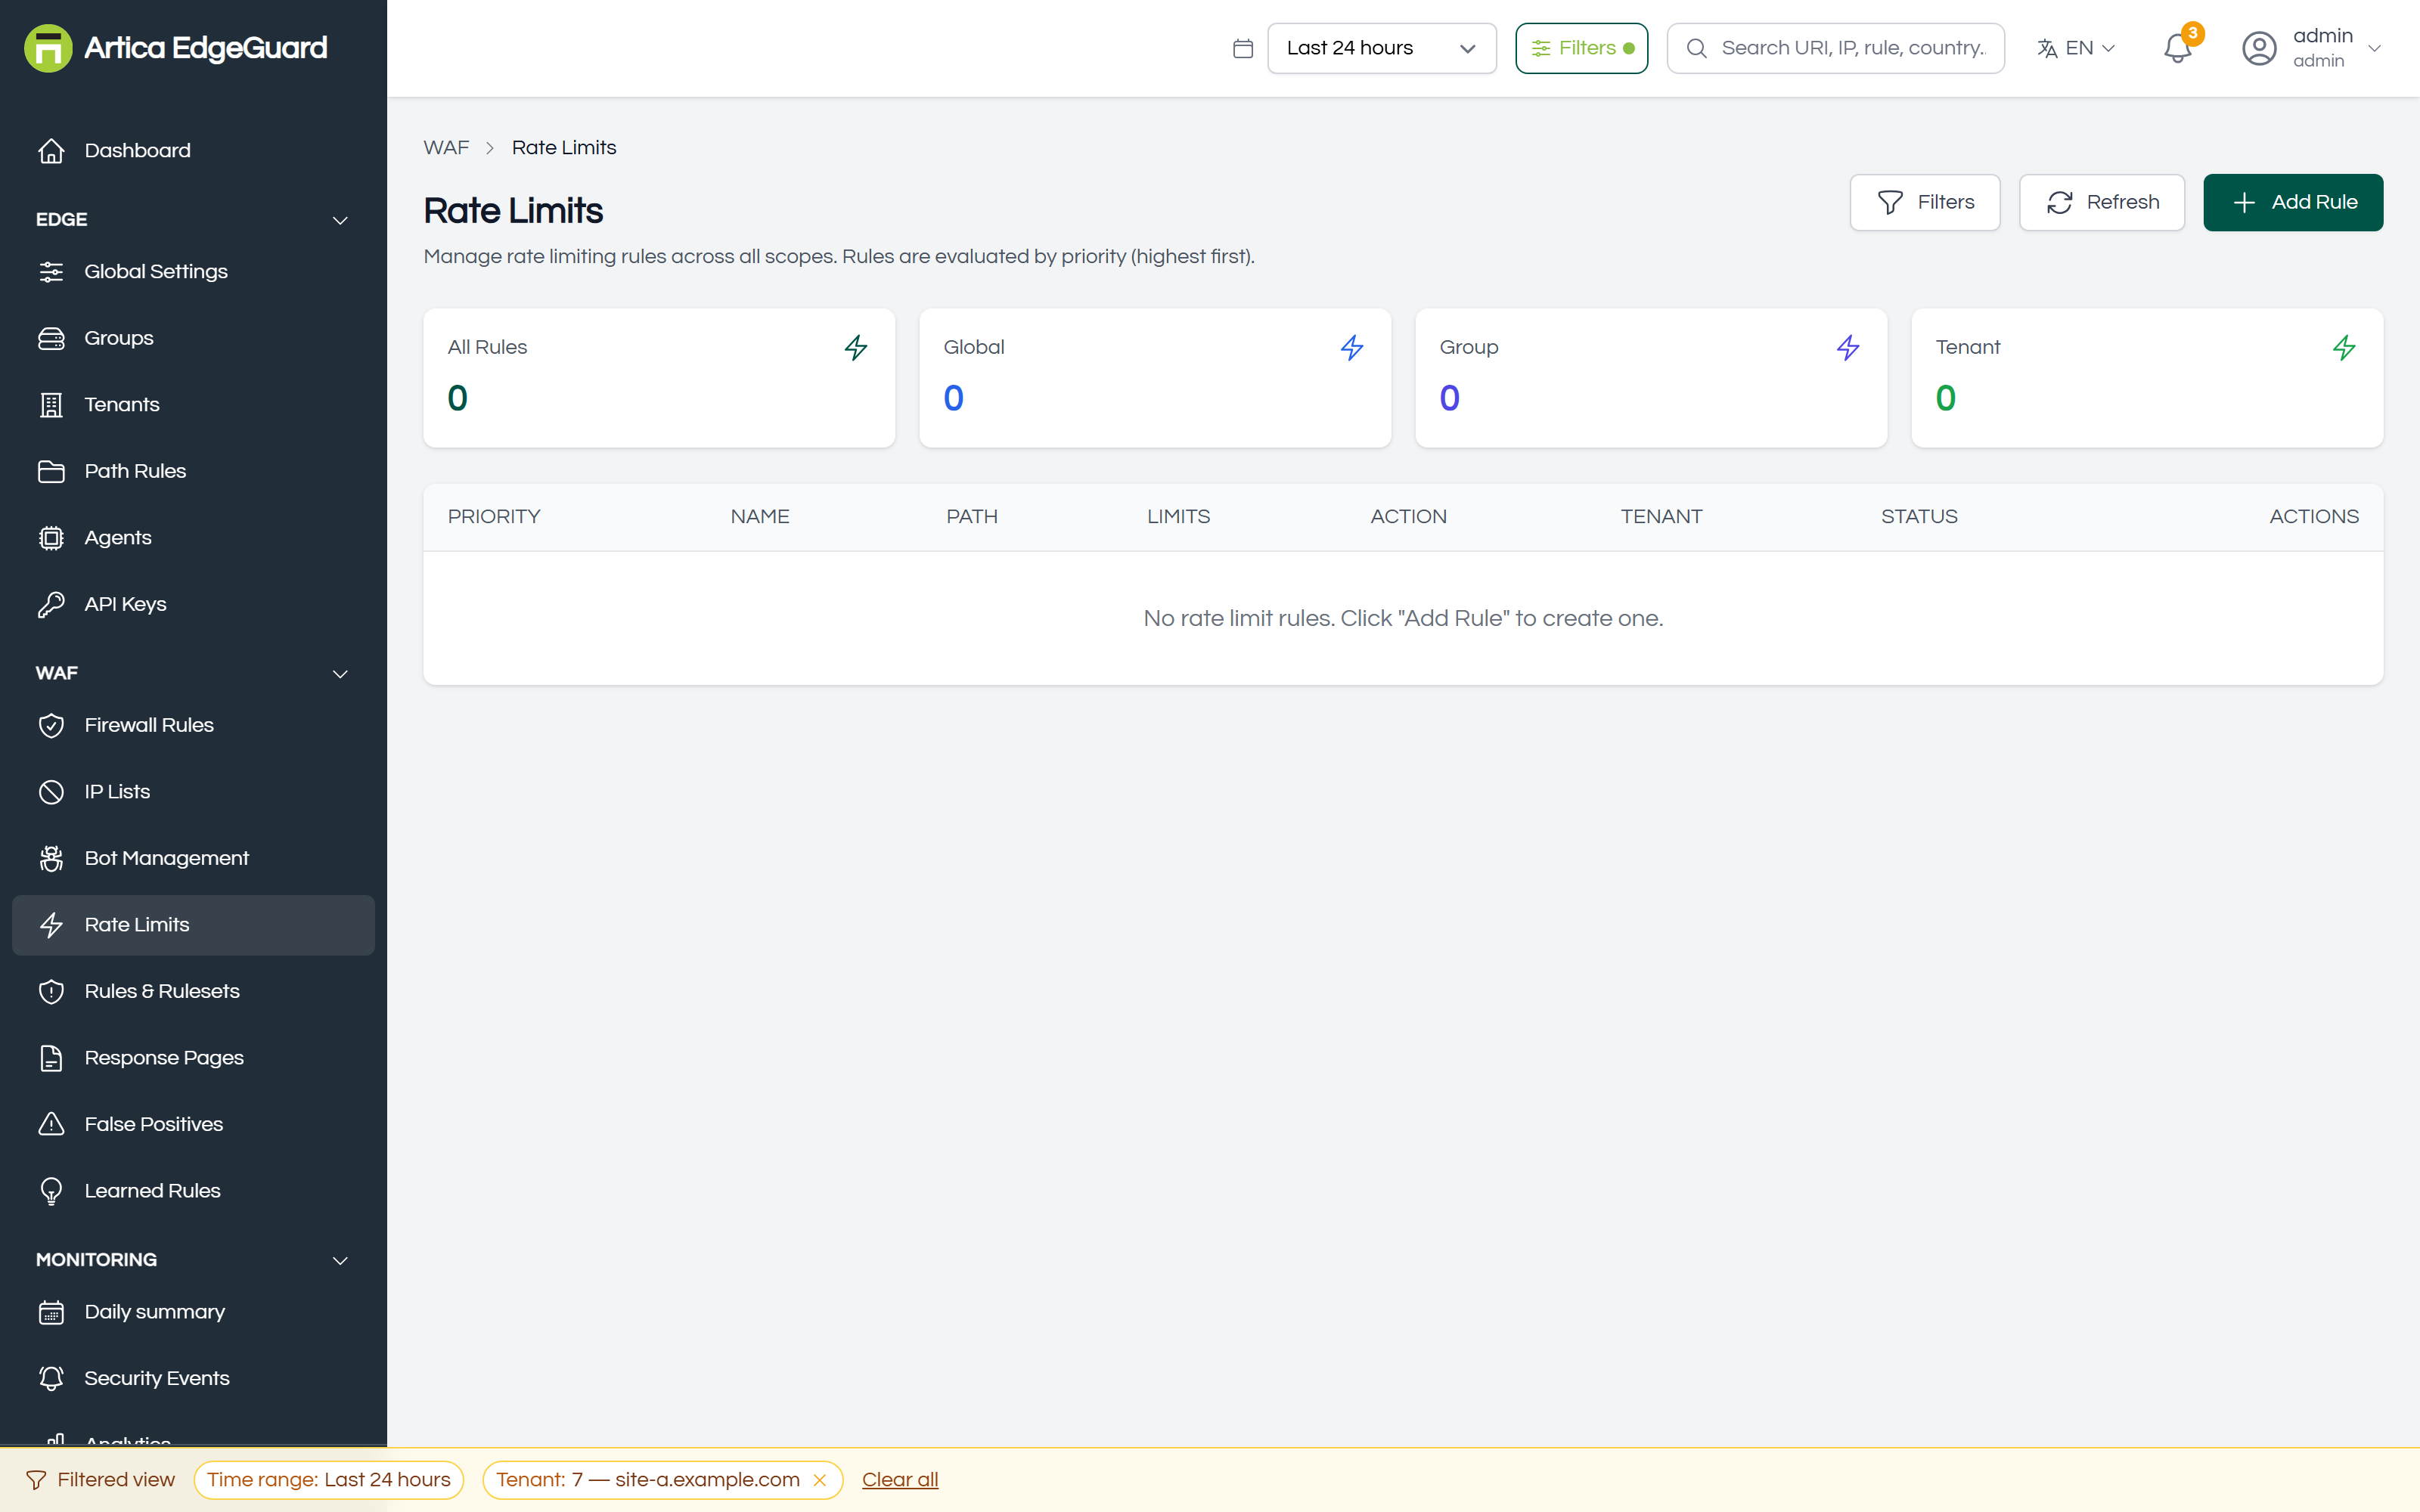
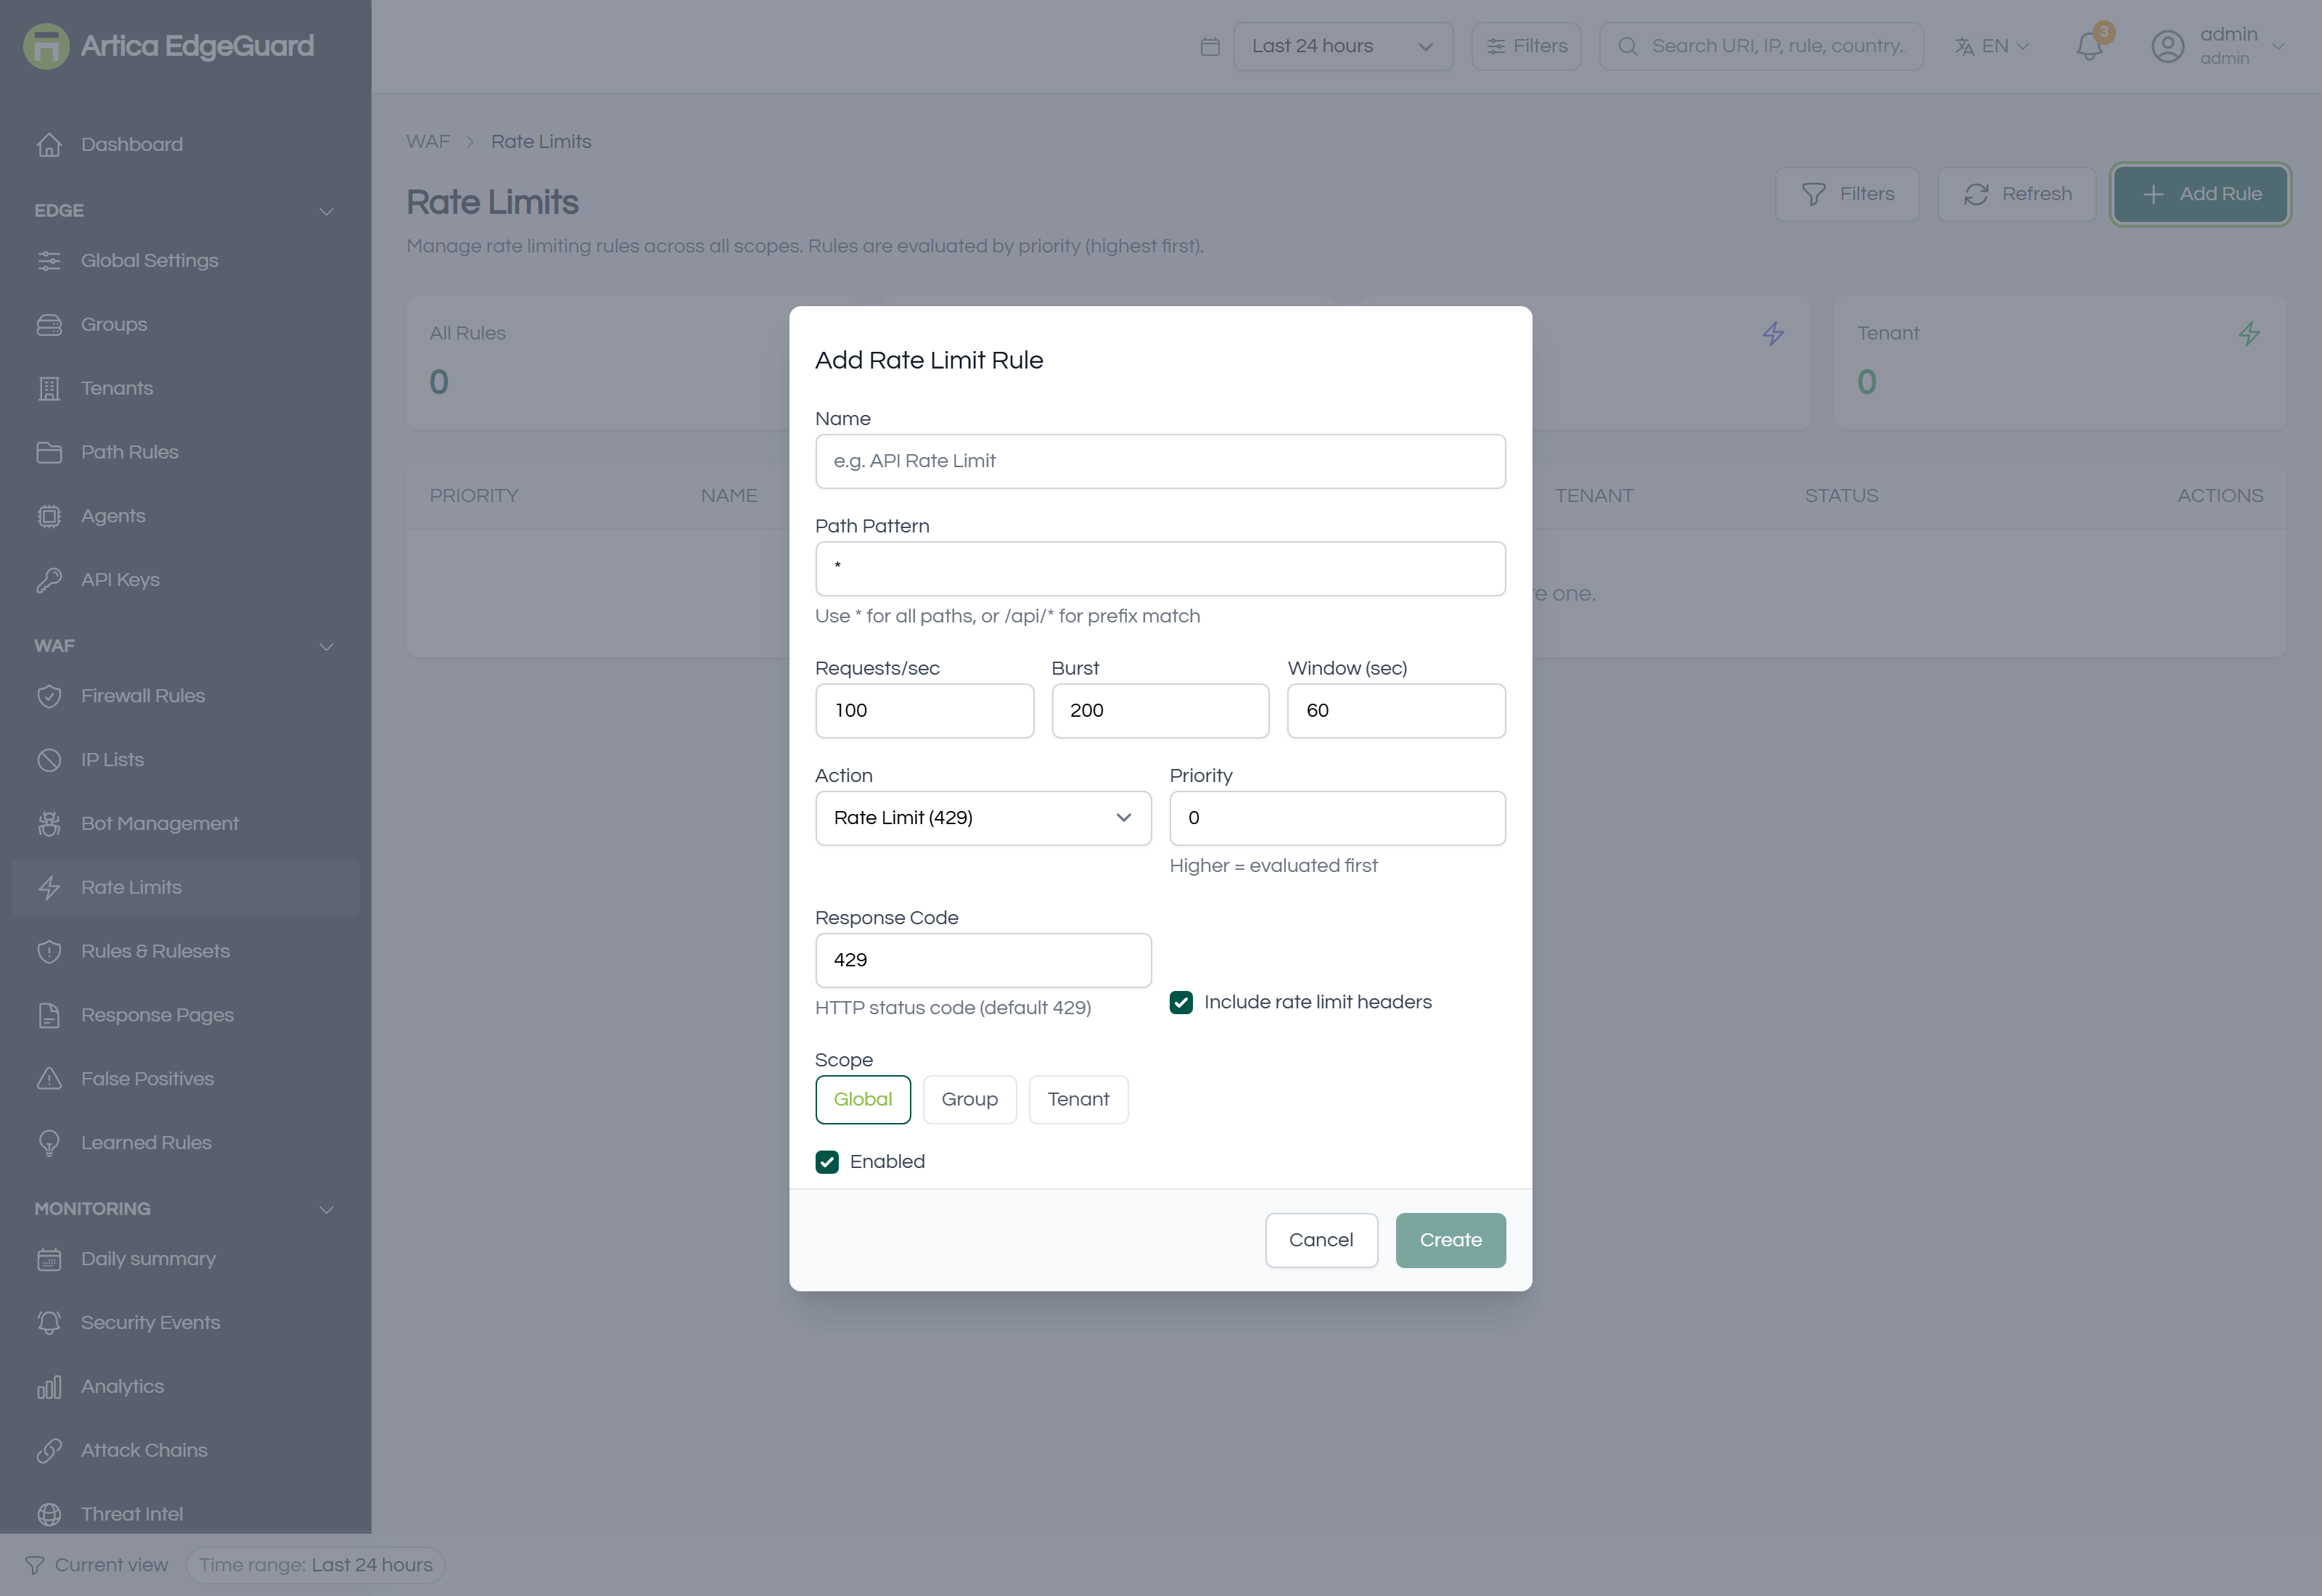
Full documentation: EdgeGuard — Rate Limits
¶ Rules & Rulesets
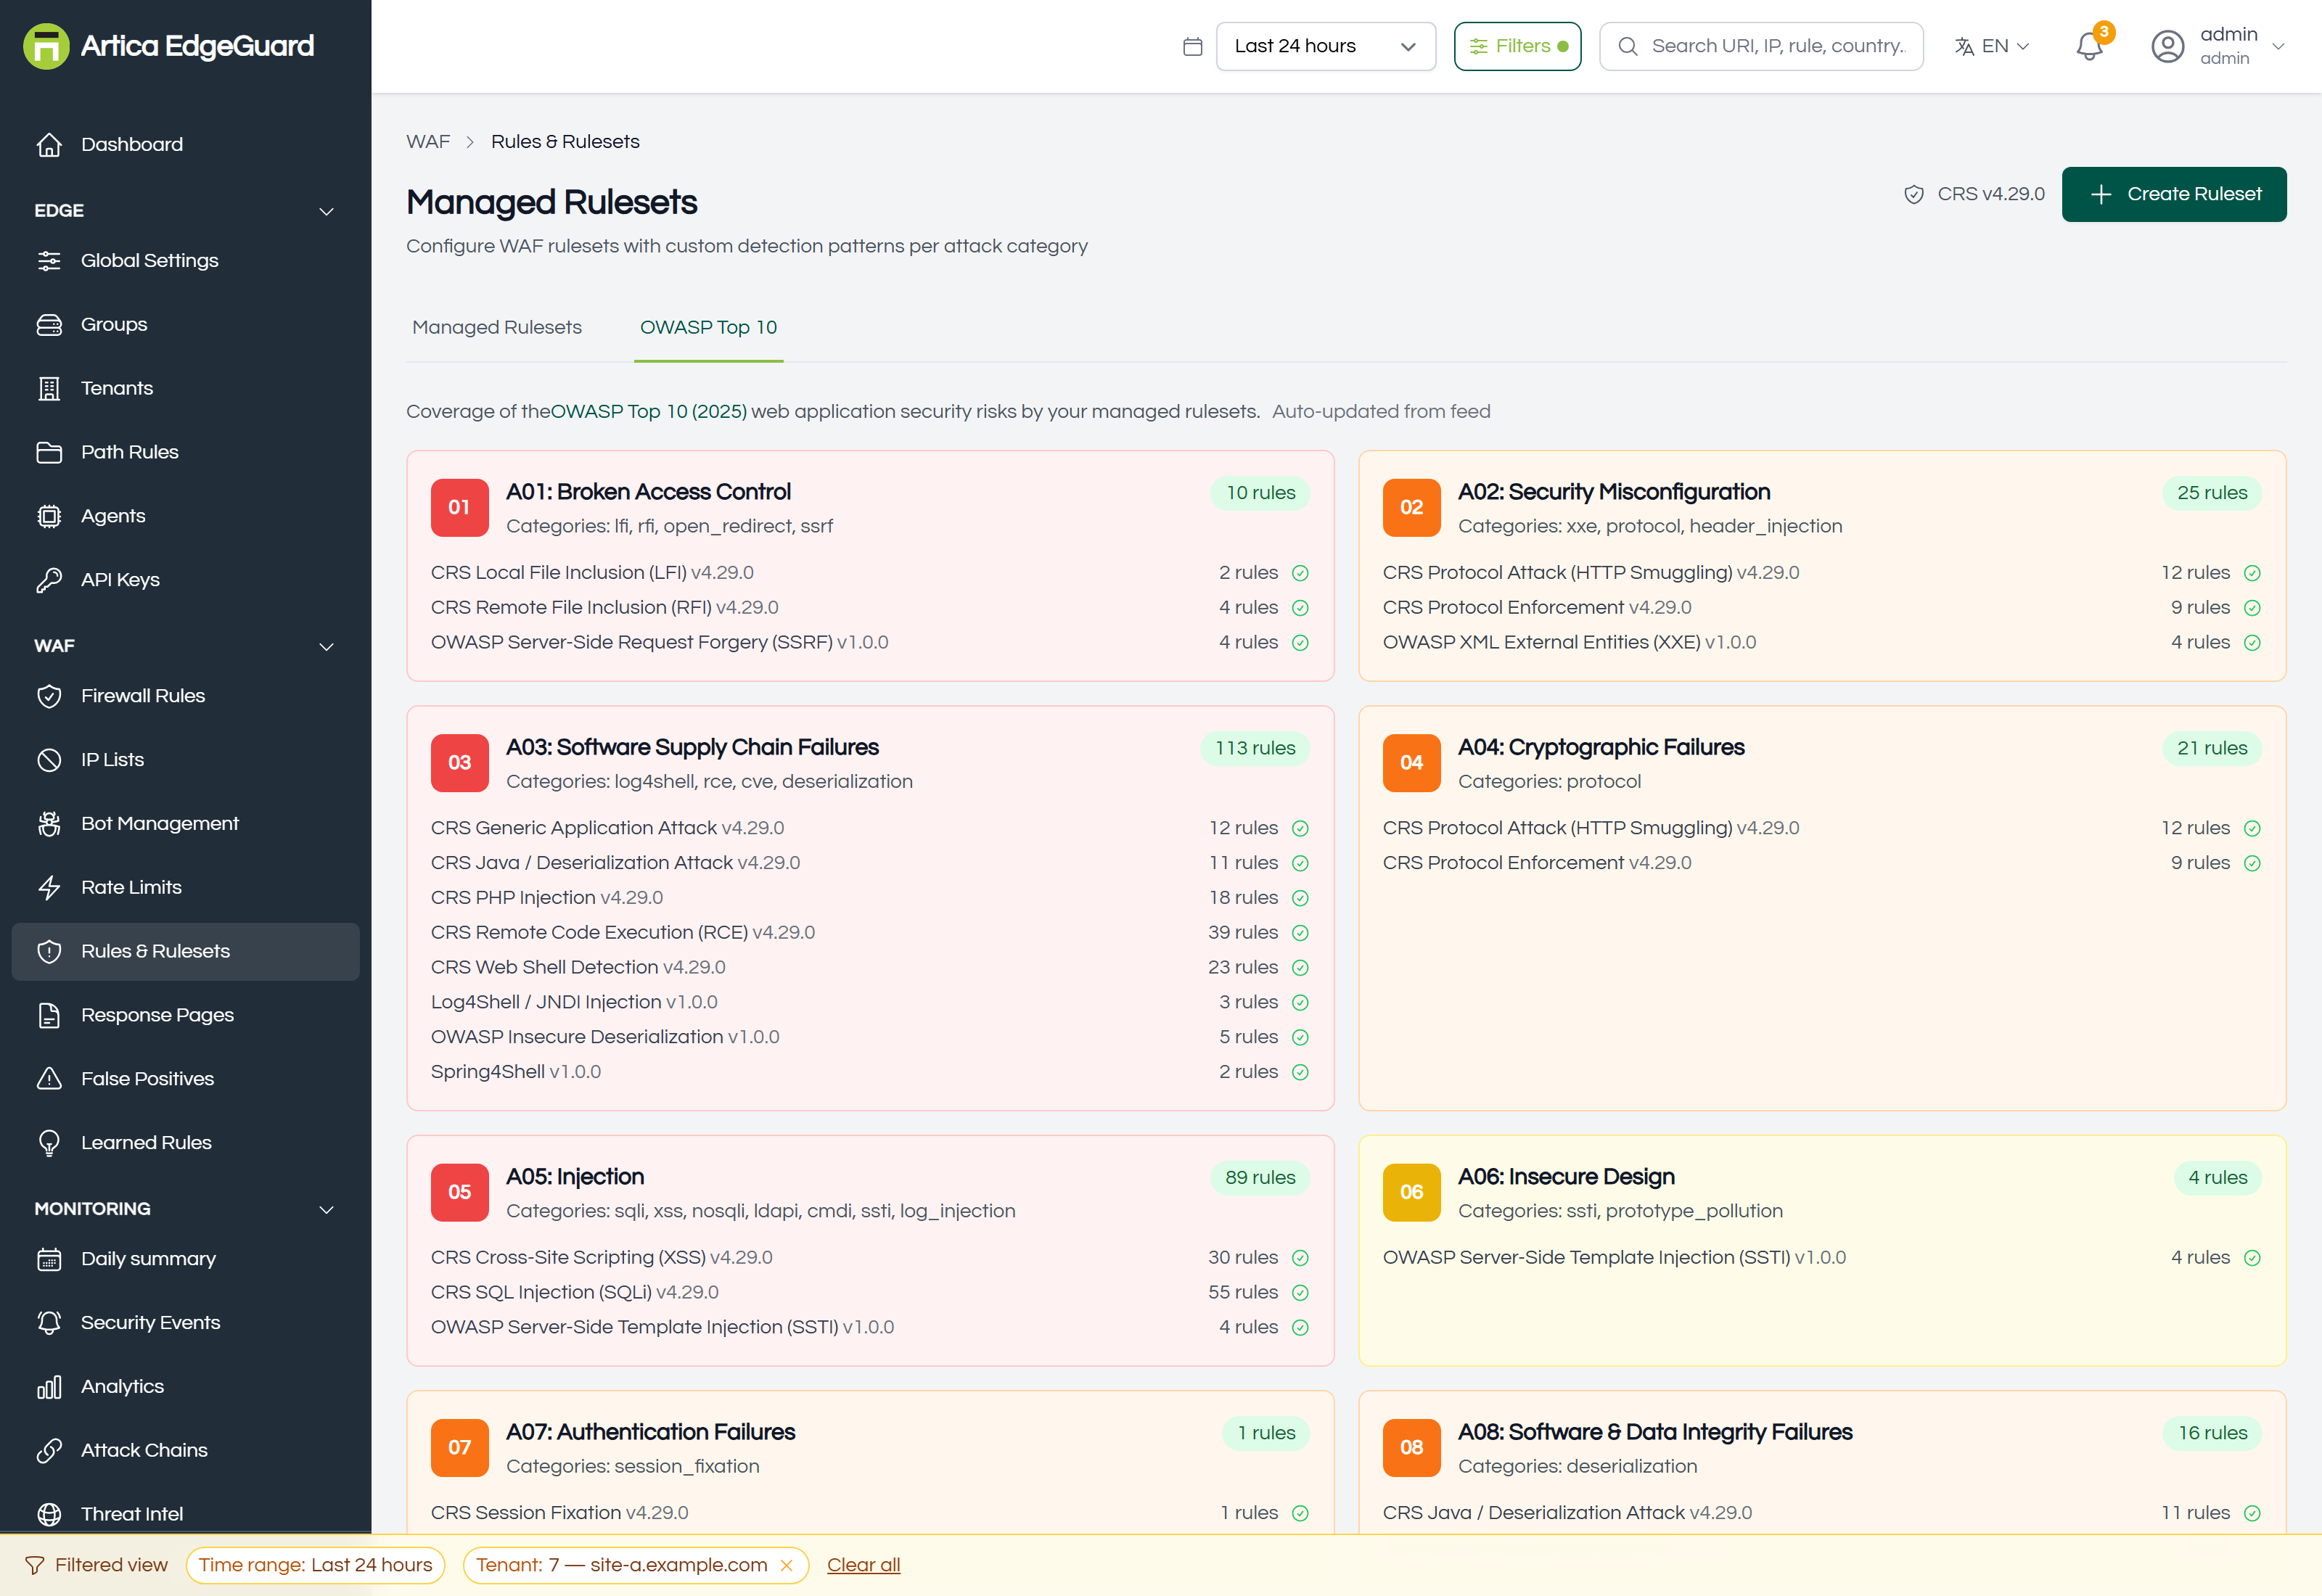
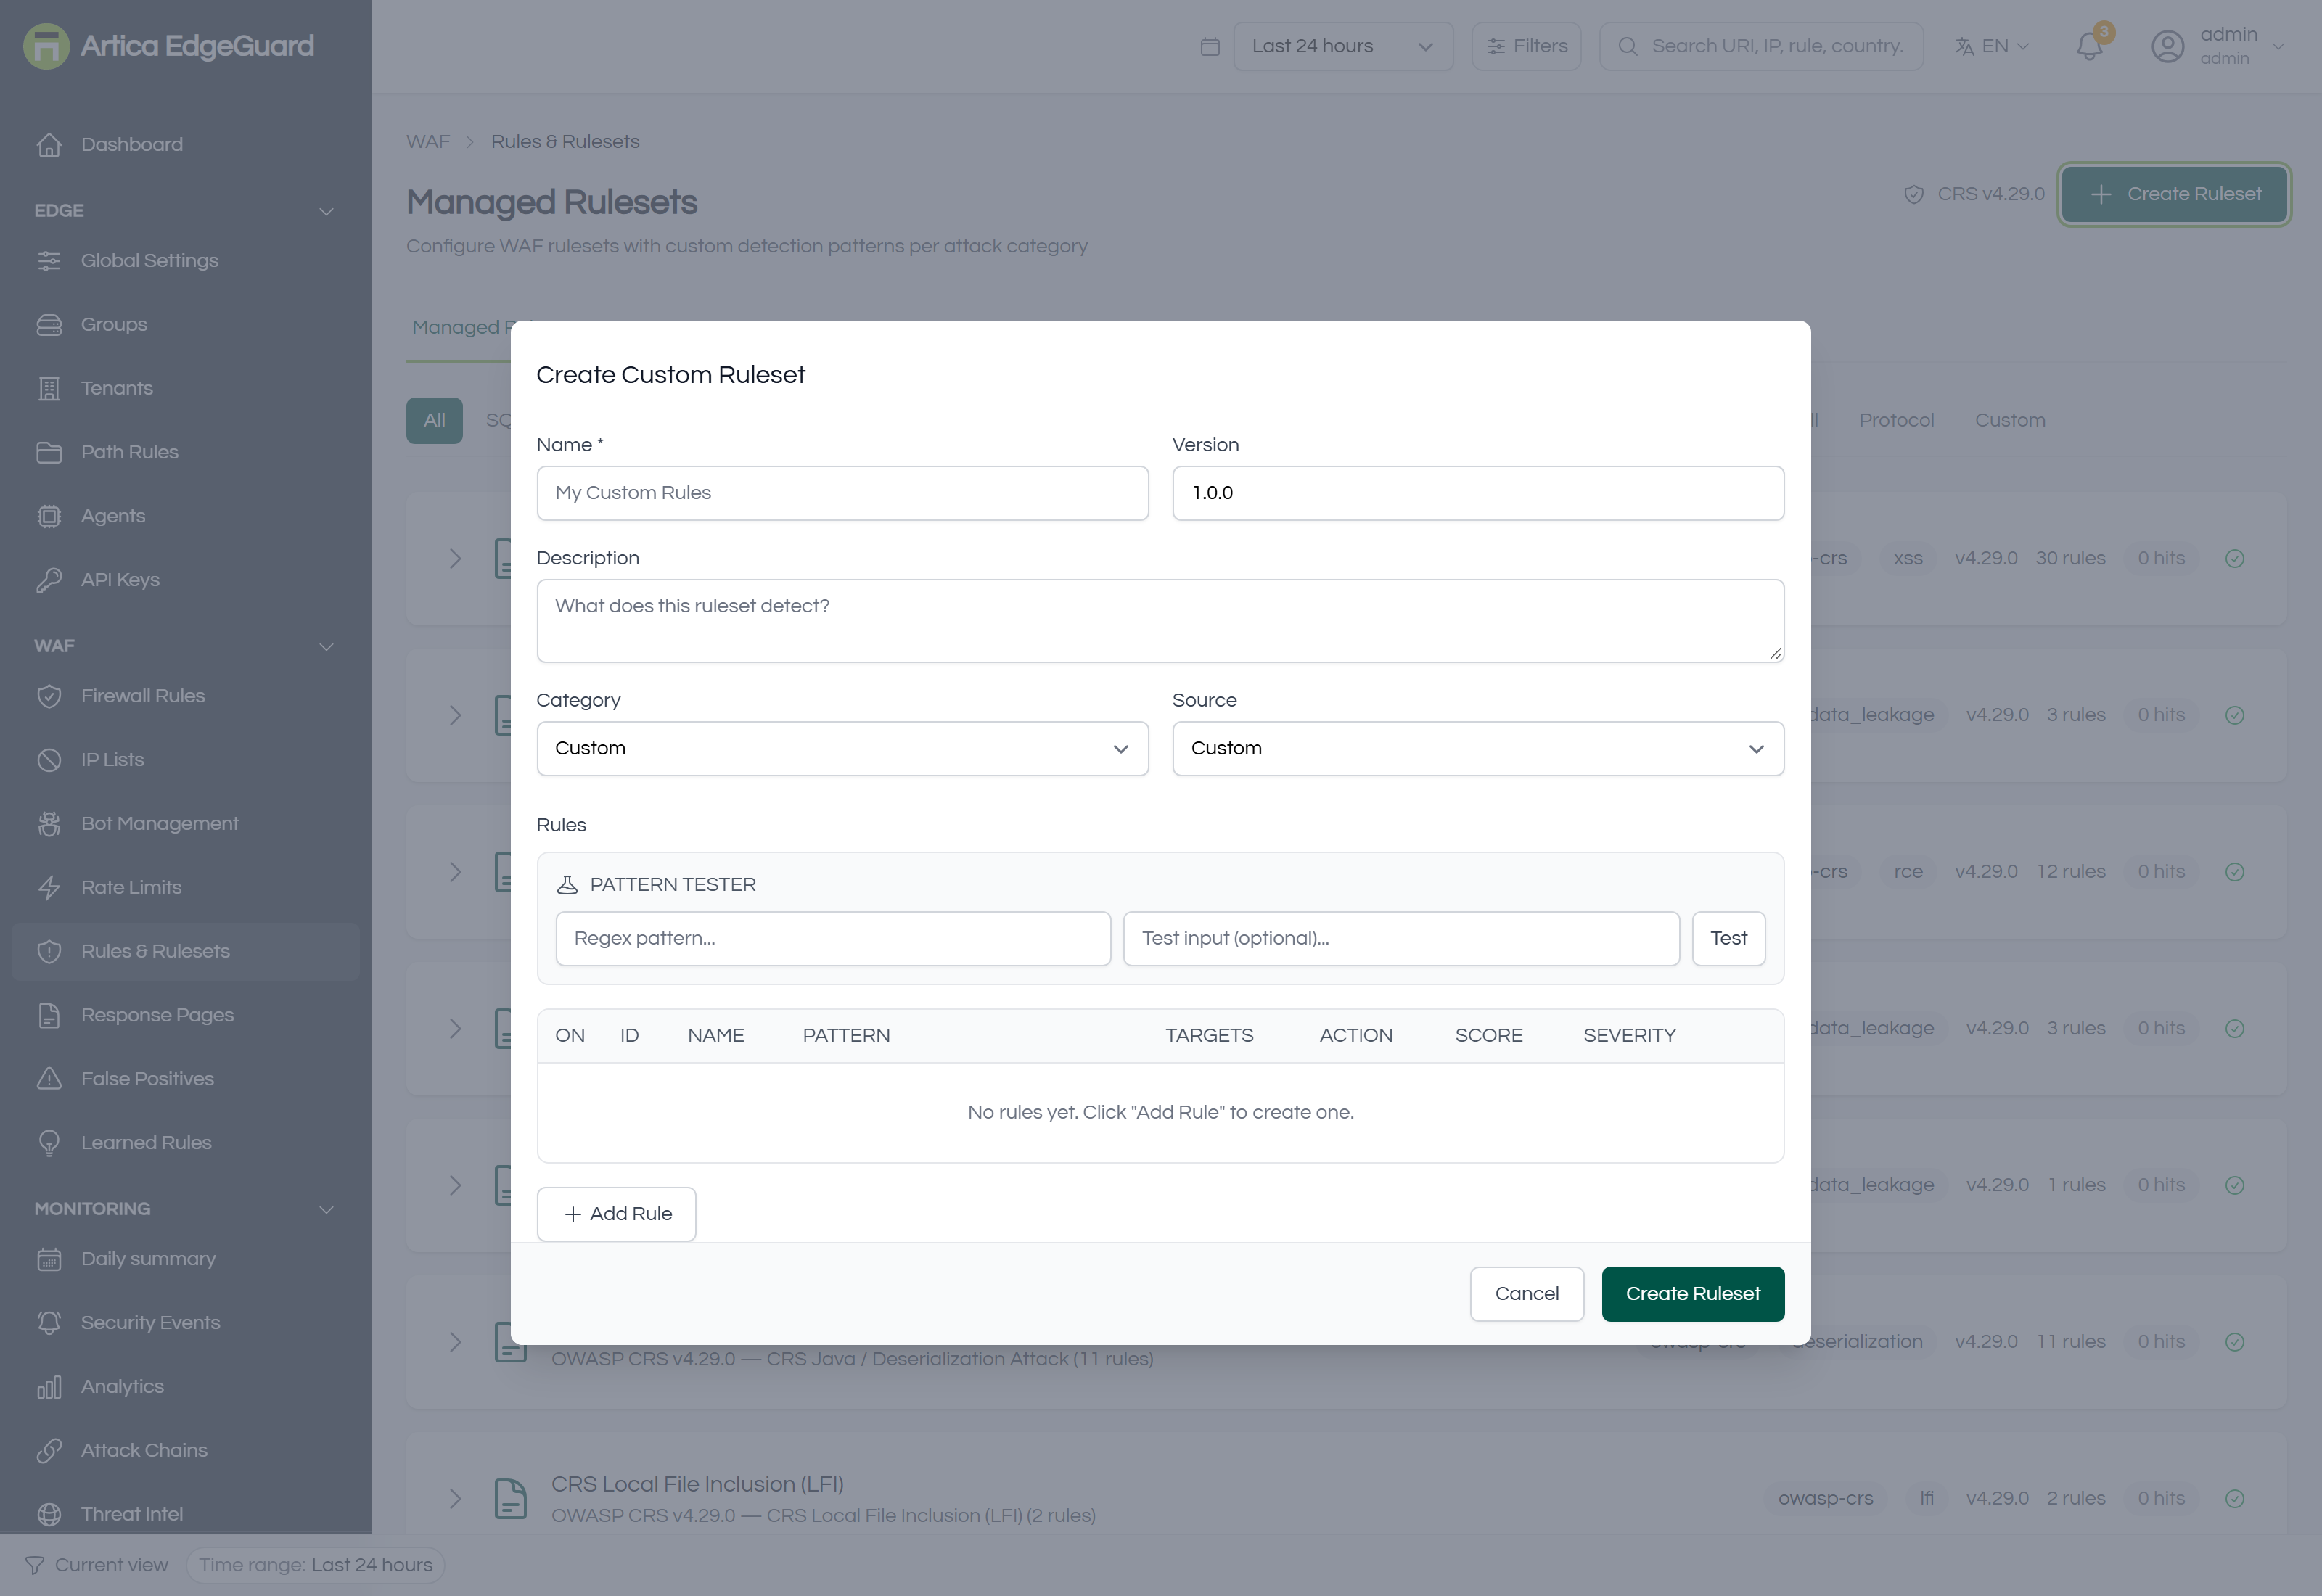
The managed rule sets: OWASP CRS and the EdgeGuard sets, paranoia levels, anomaly scoring, and what a category switch really turns off.
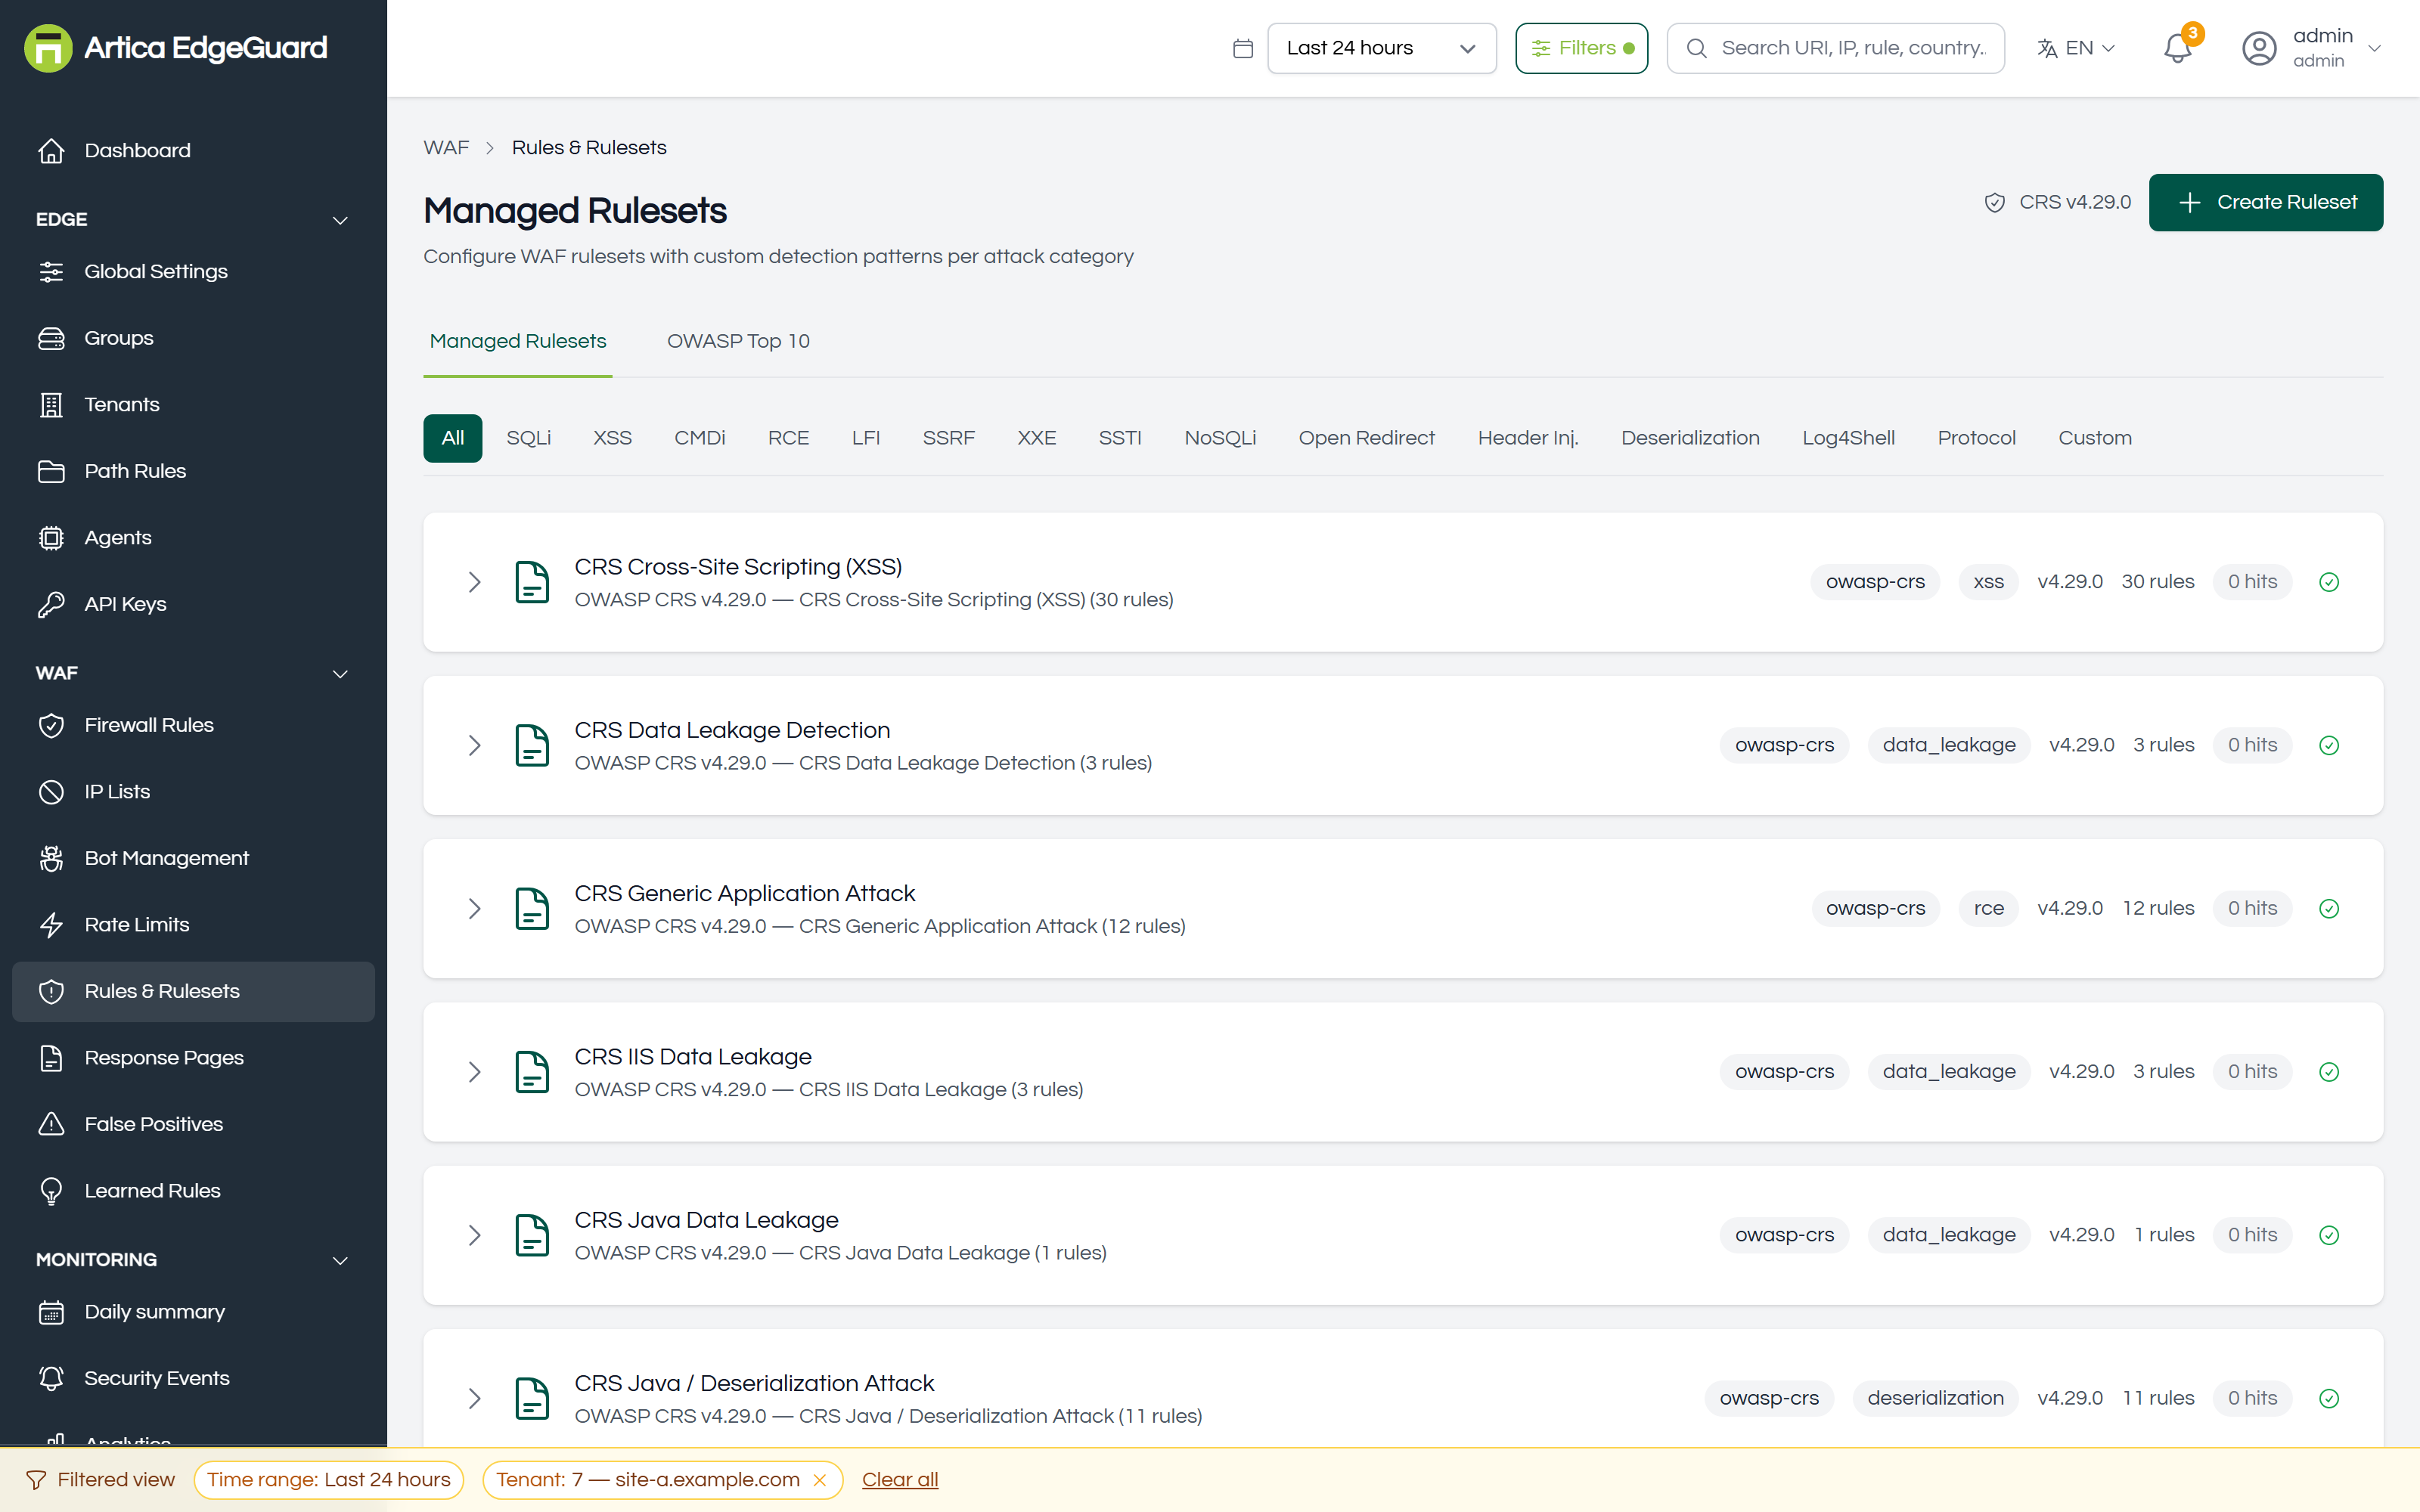
Full documentation: EdgeGuard — Rules & Rulesets
¶ Response Pages
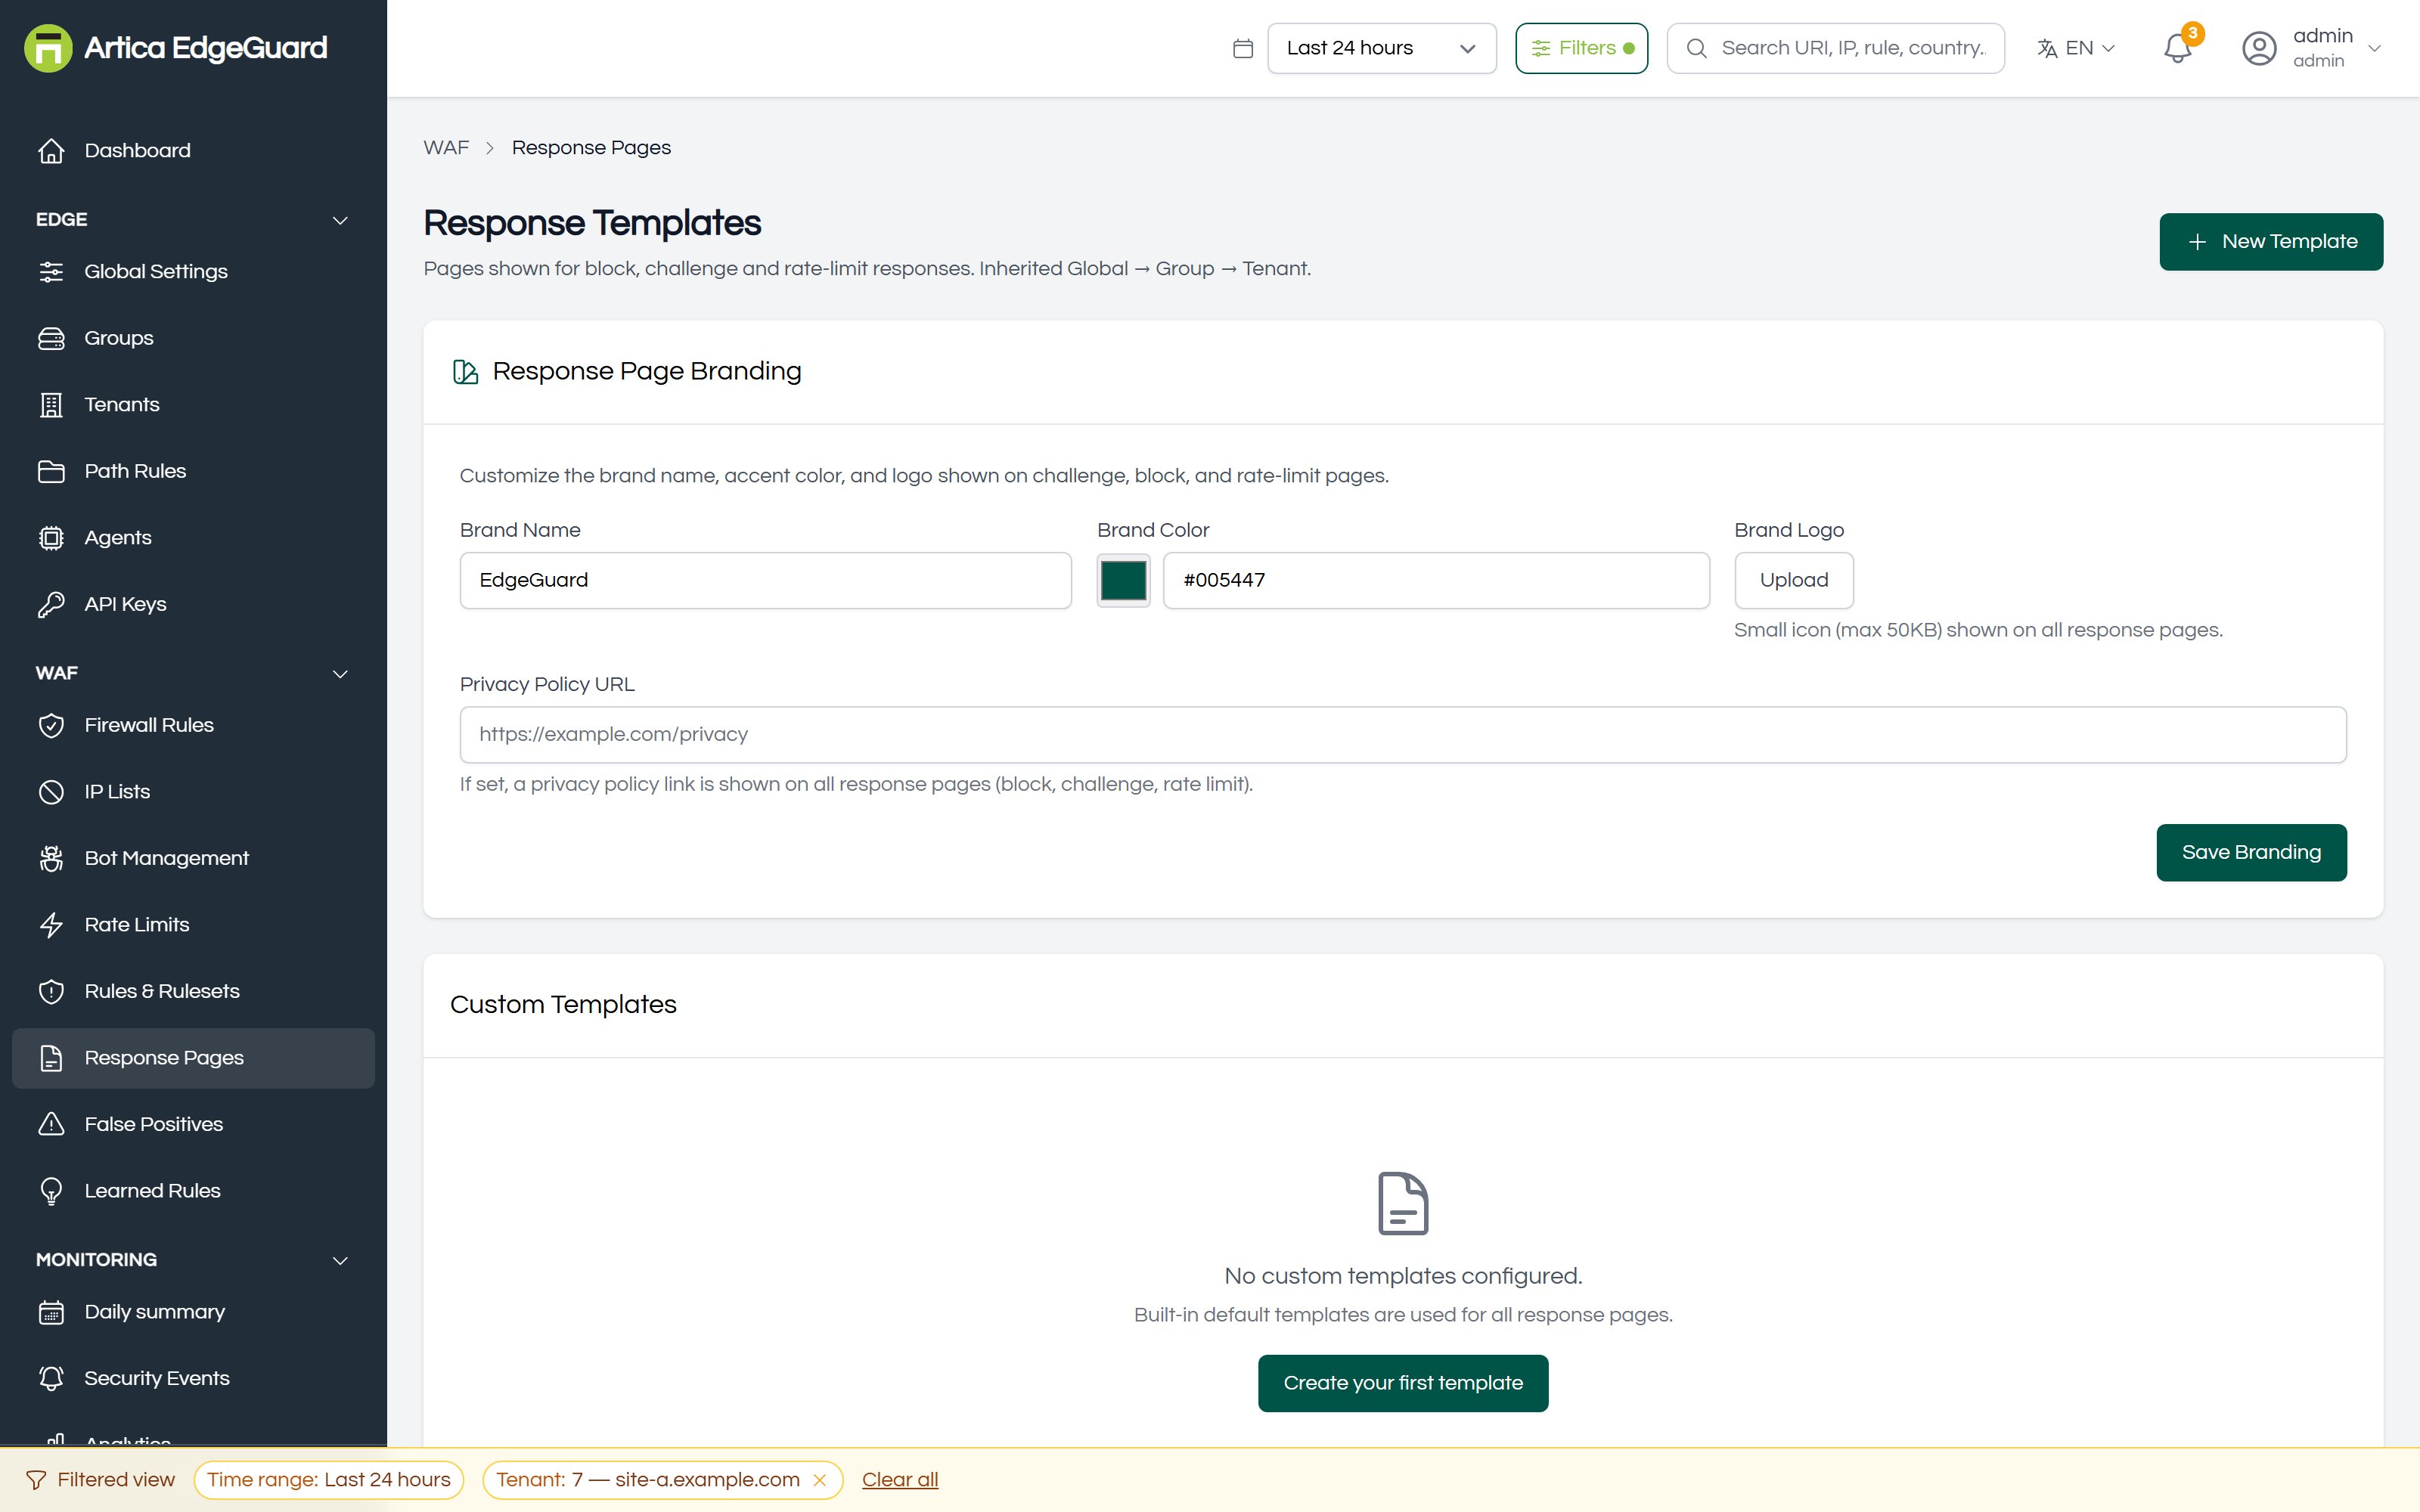
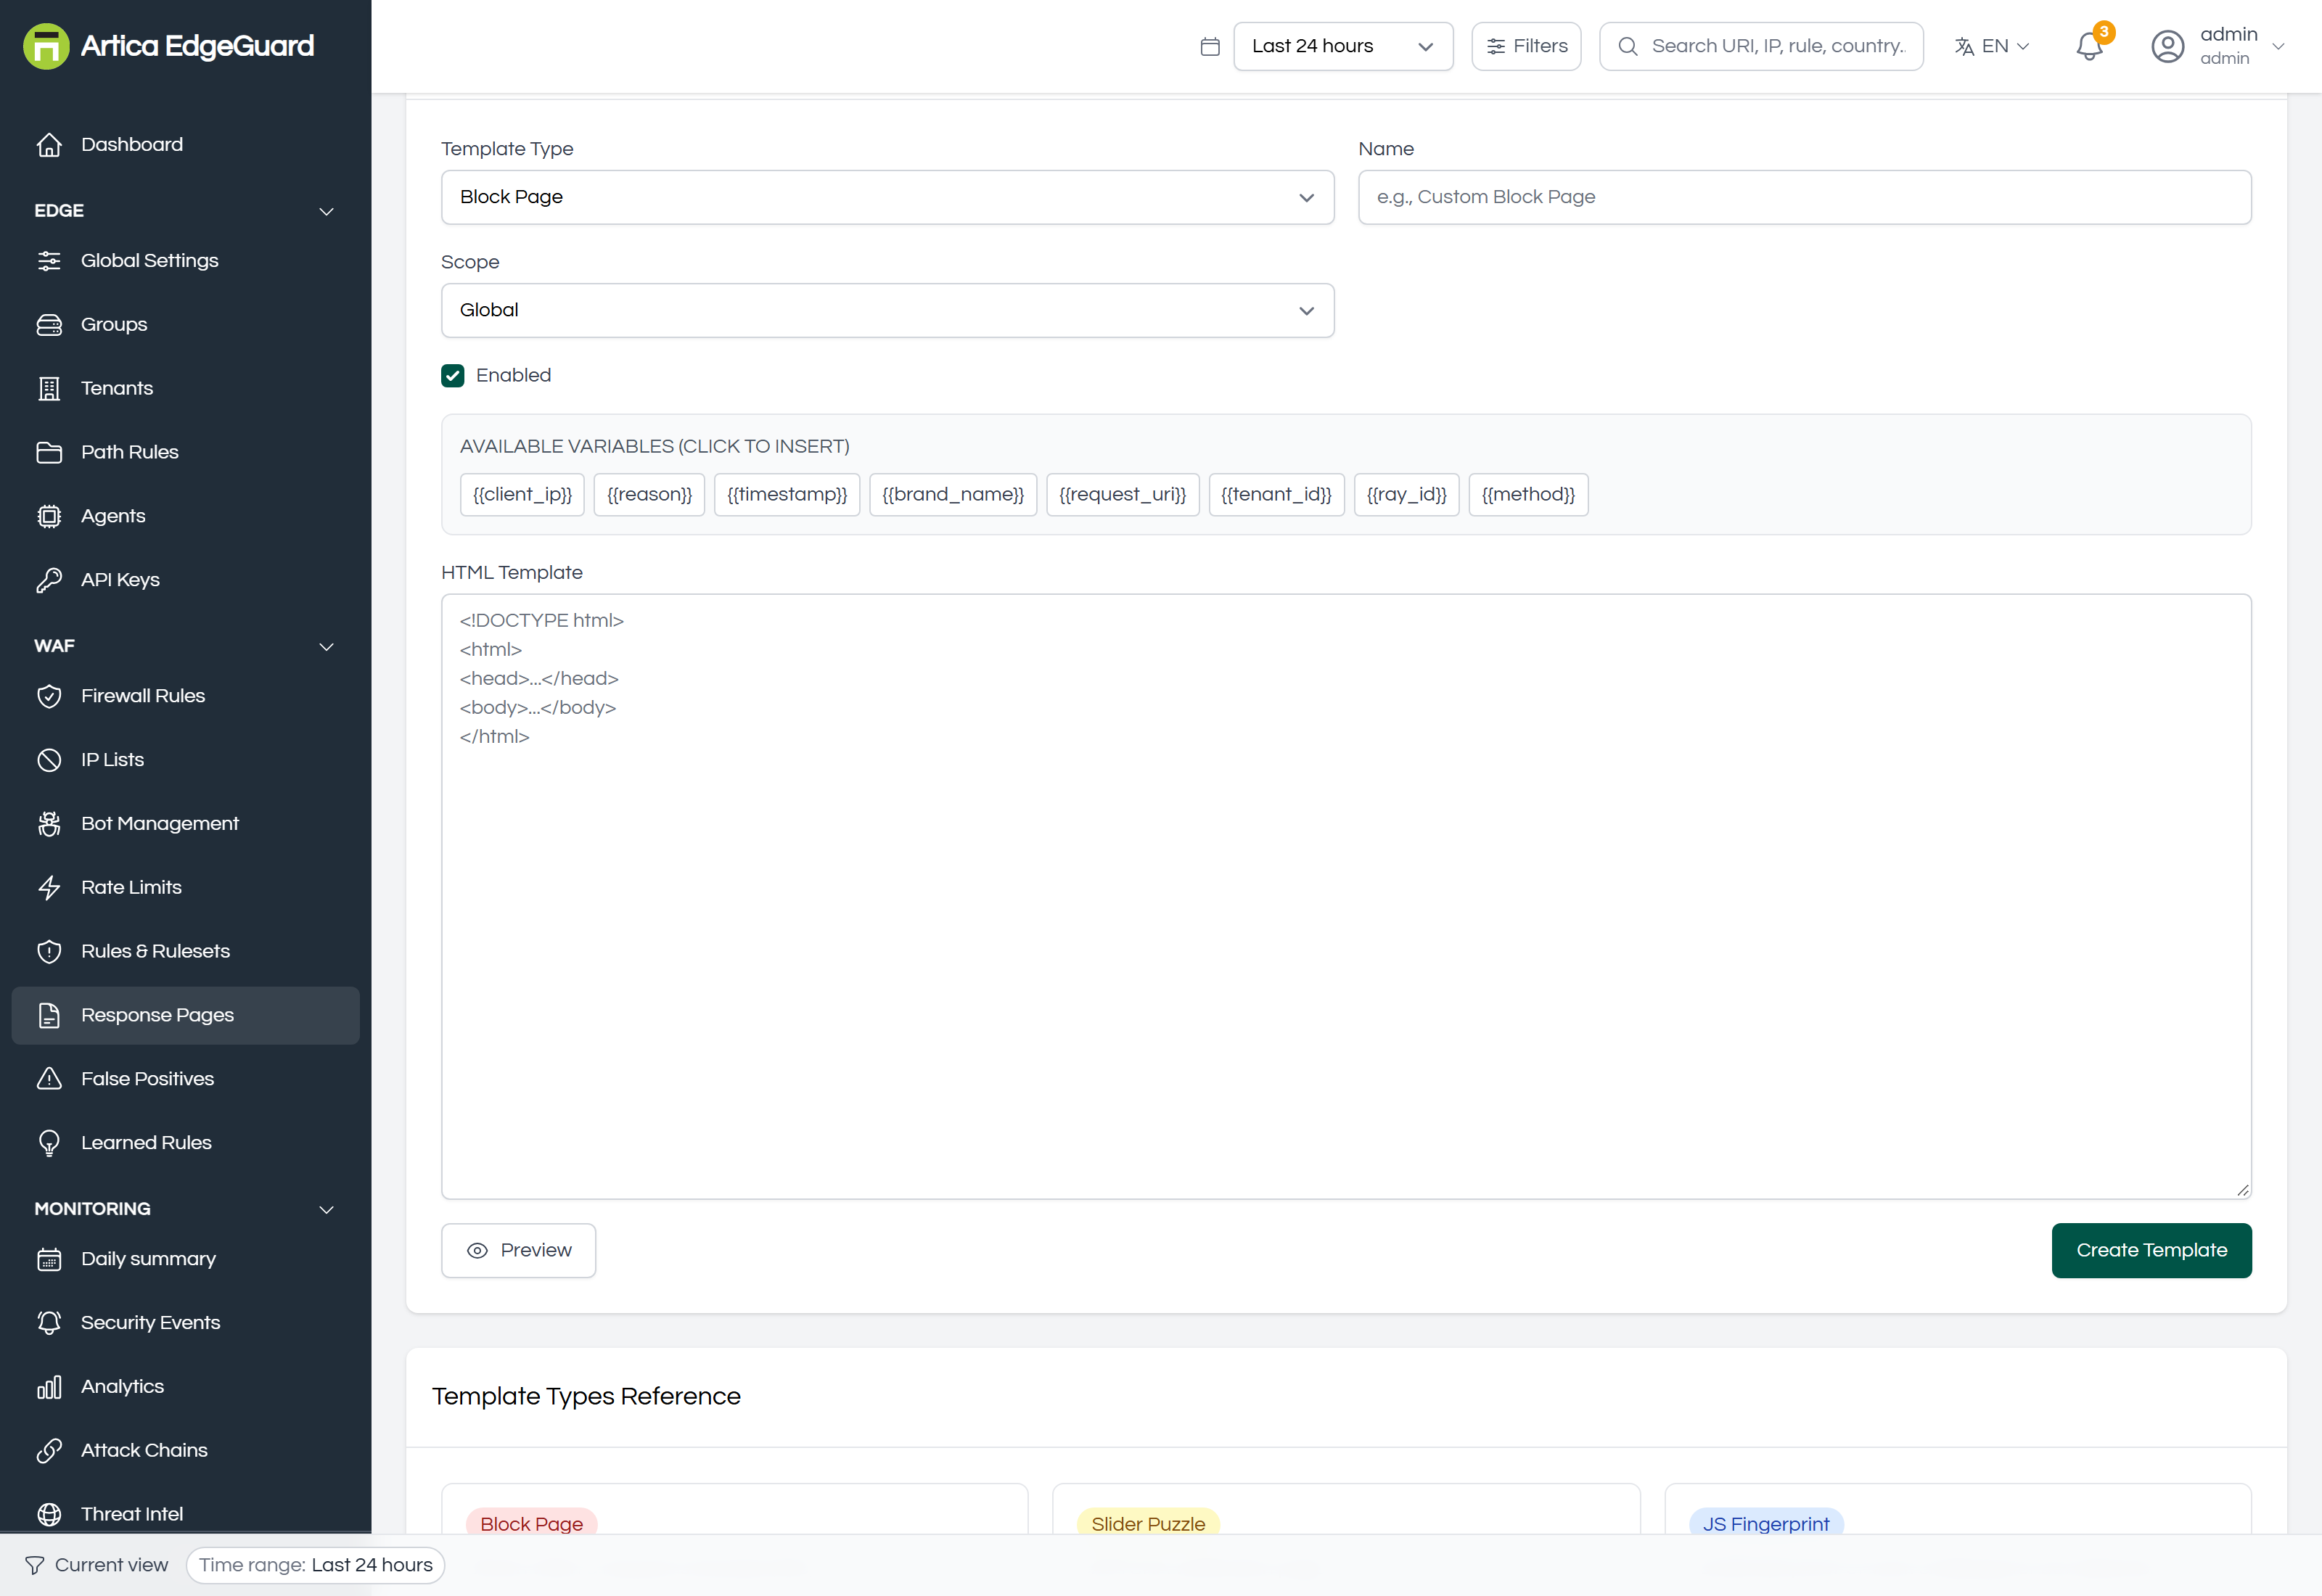
What a refused visitor sees. Per site, per action, carrying the EdgeGuard ID that makes a support call answerable.
Full documentation: EdgeGuard — Response Pages
¶ False Positives
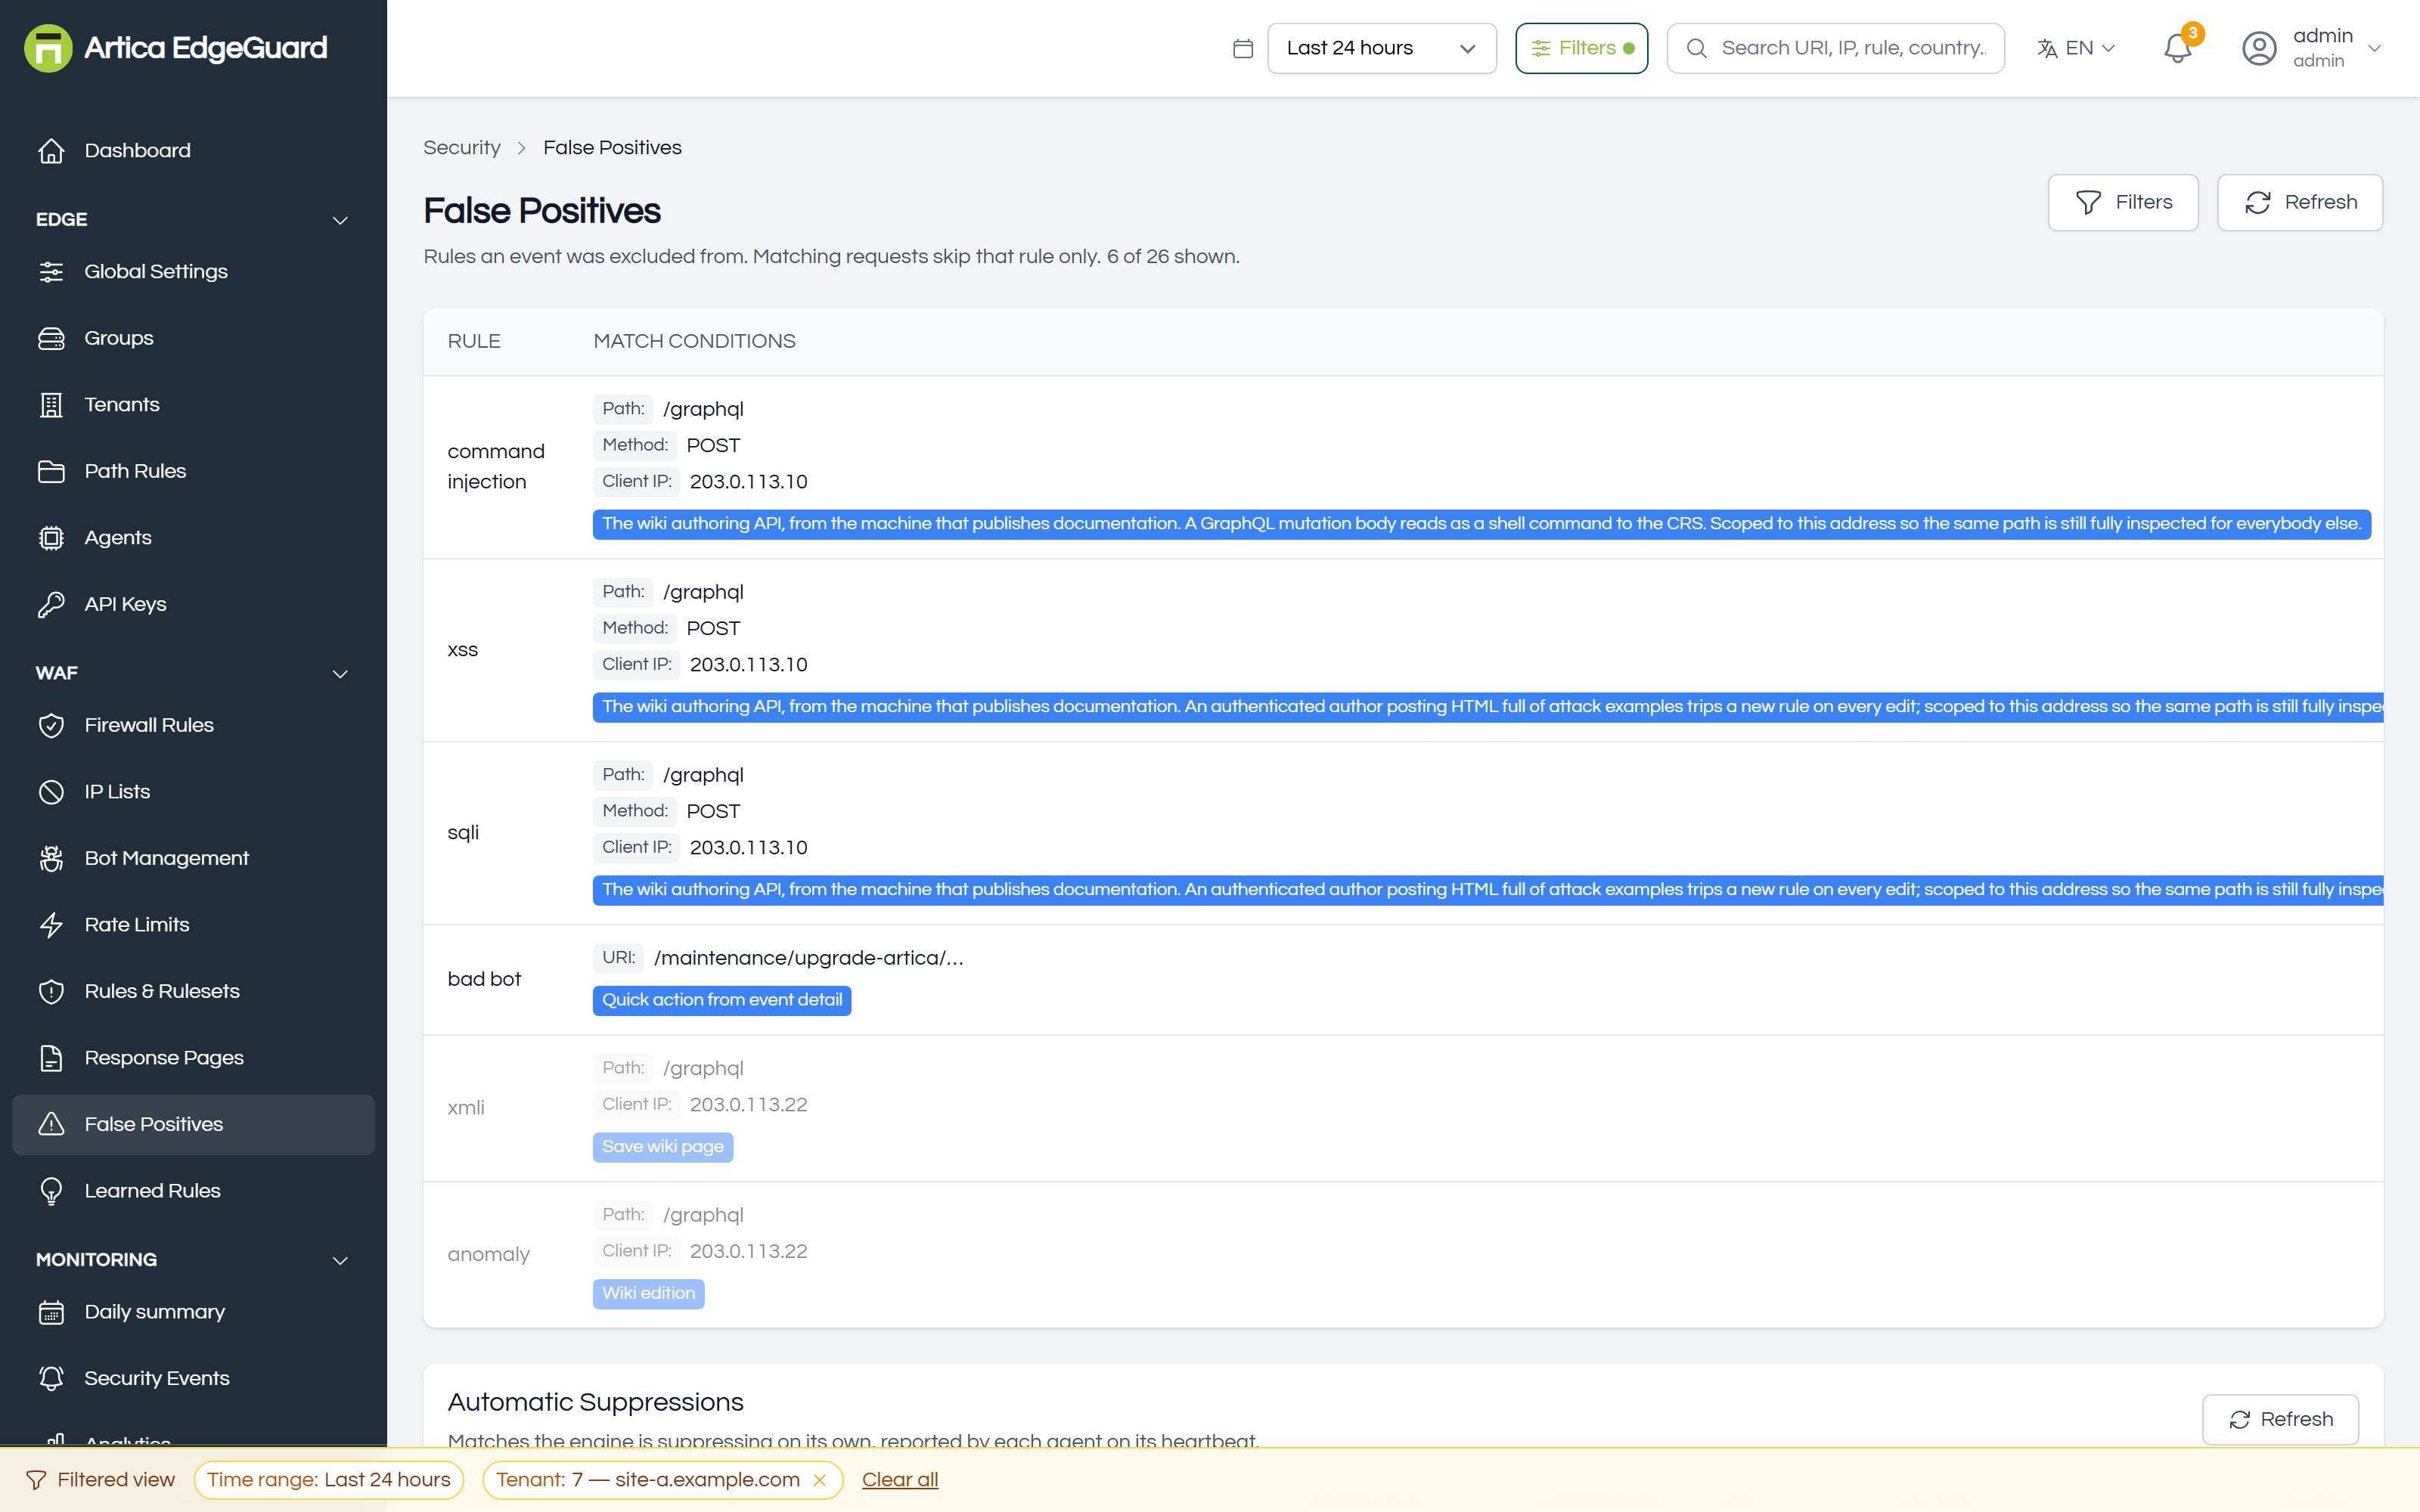
When a legitimate request is refused: find the rule, exclude the one field, and suppress the noise — reversibly, in four states.
Full documentation: EdgeGuard — False Positives
¶ Learned Rules
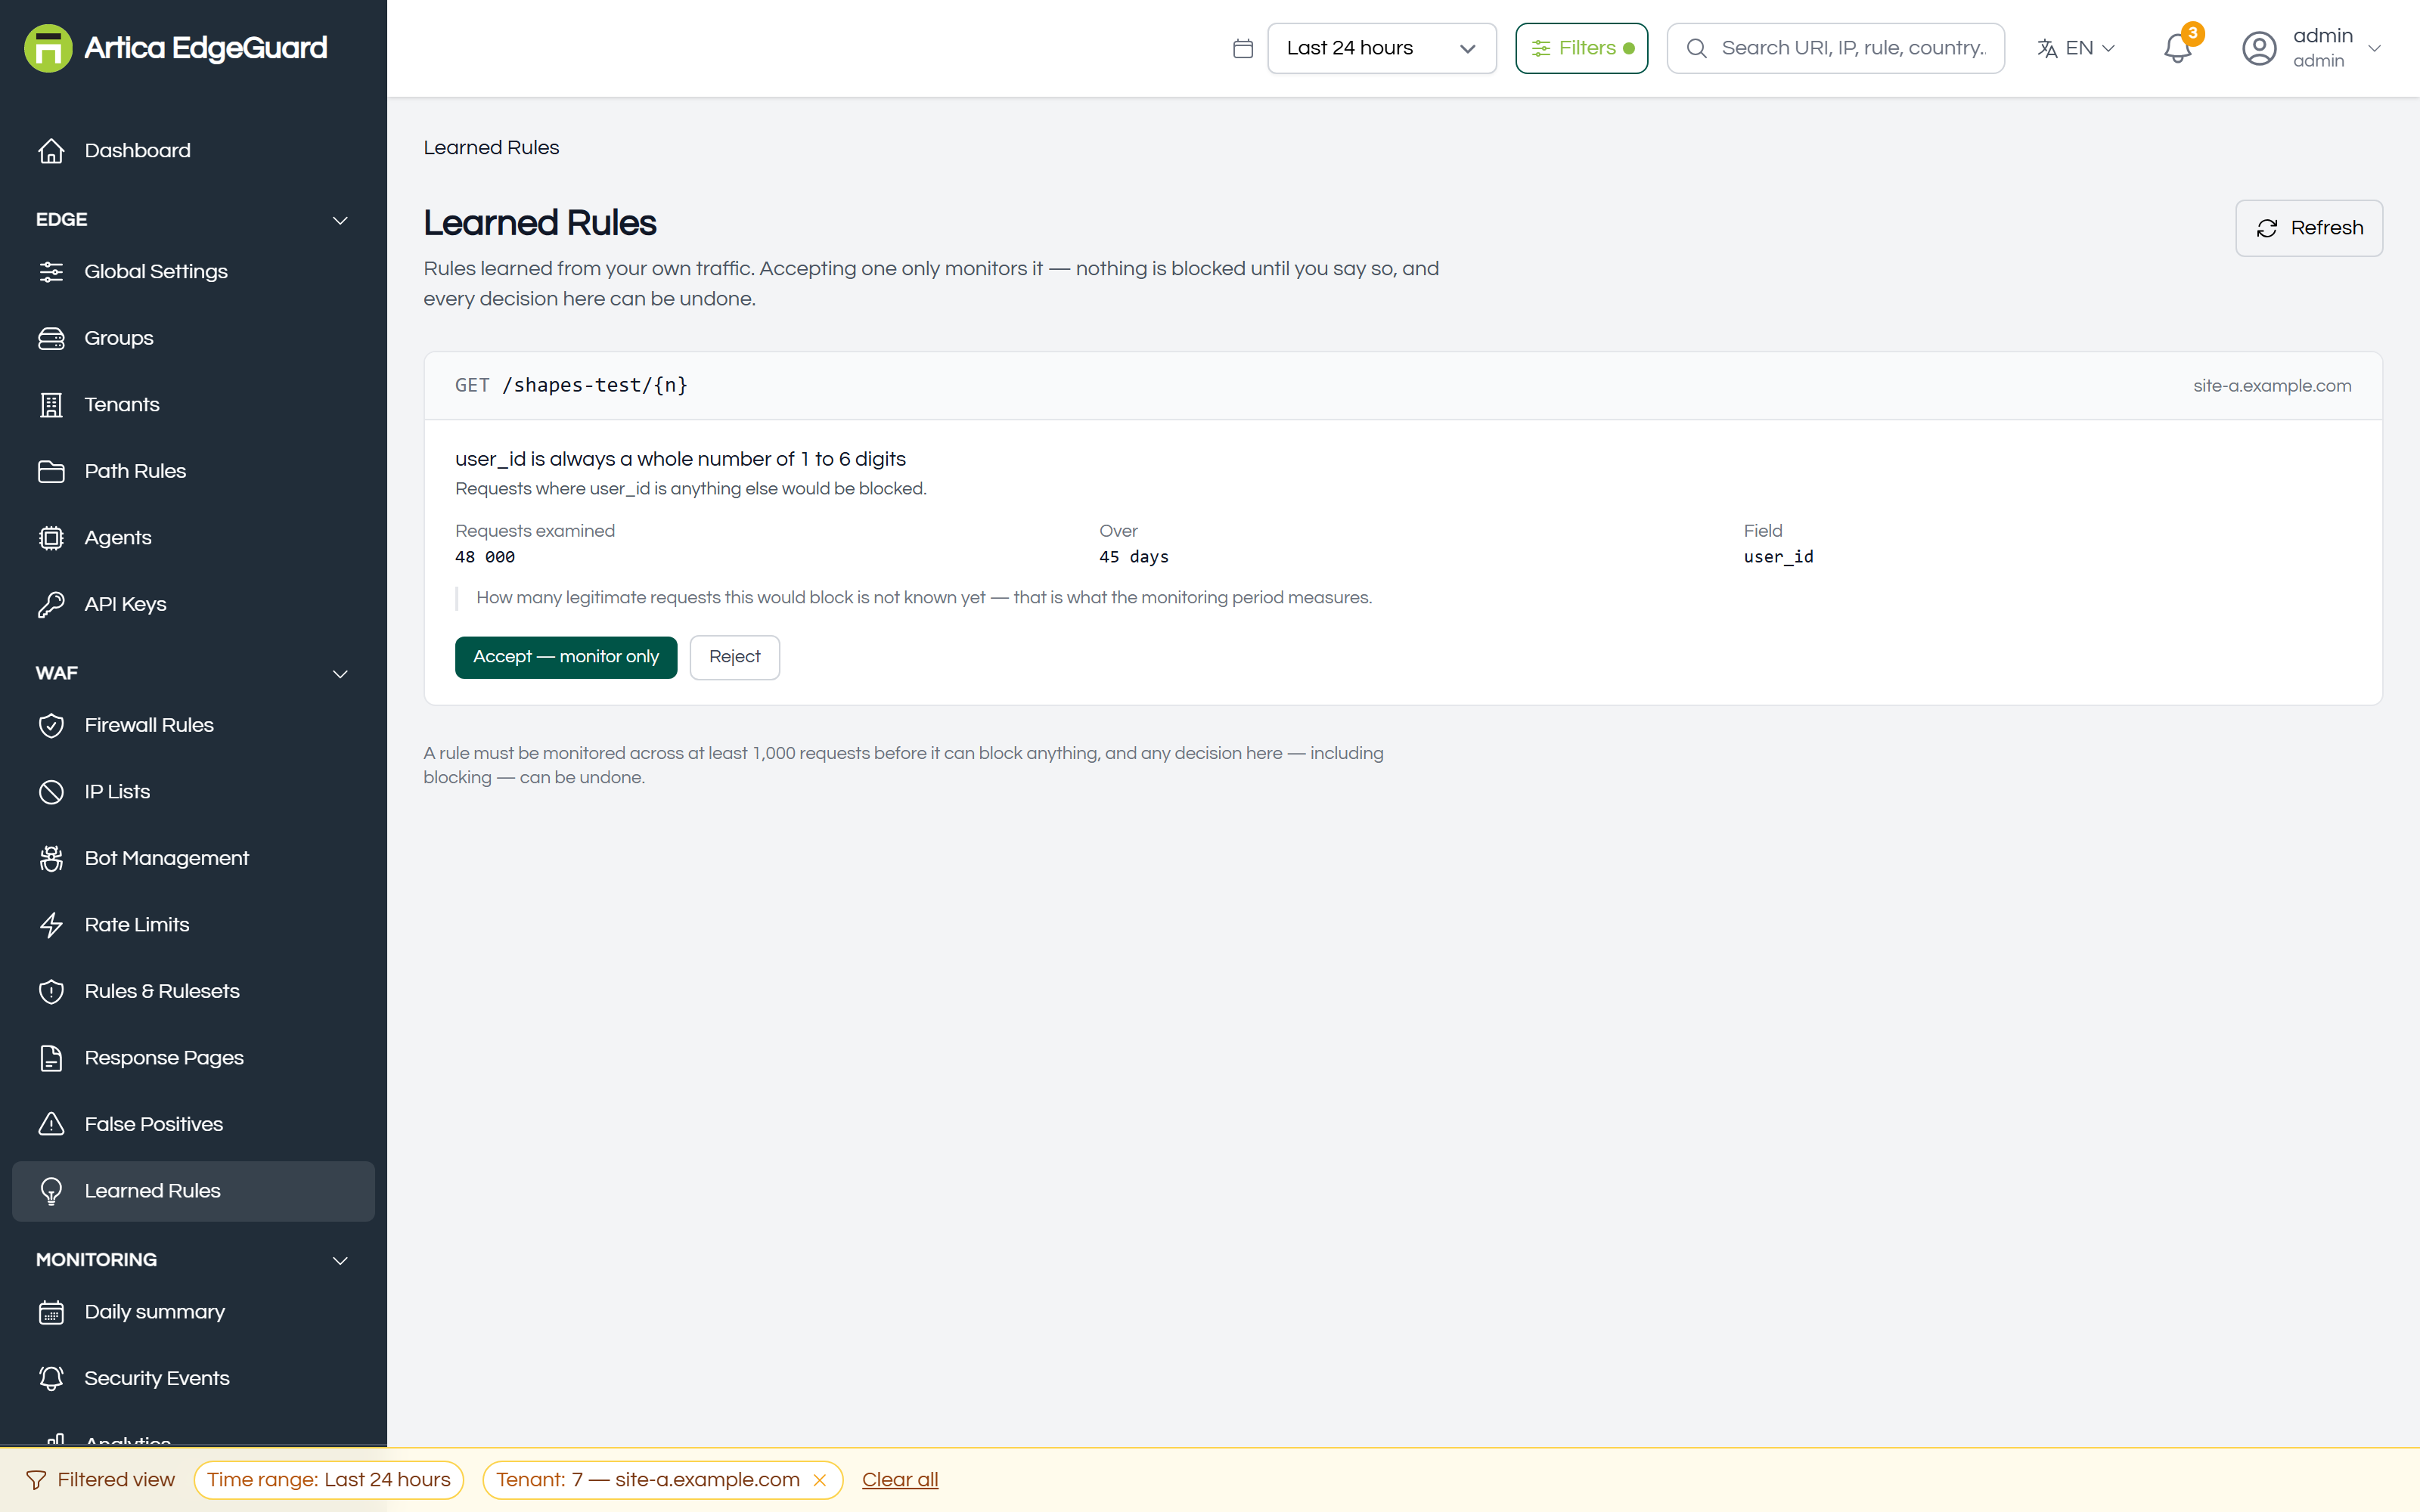
EdgeGuard learns the shape of each endpoint’s traffic, proposes it as a rule, measures the proposal against live traffic, and only then blocks — with a person accepting at each step.
Full documentation: EdgeGuard — Learned Rules
¶ Monitoring
What happened, from one request to a month of them.
¶ Daily summary
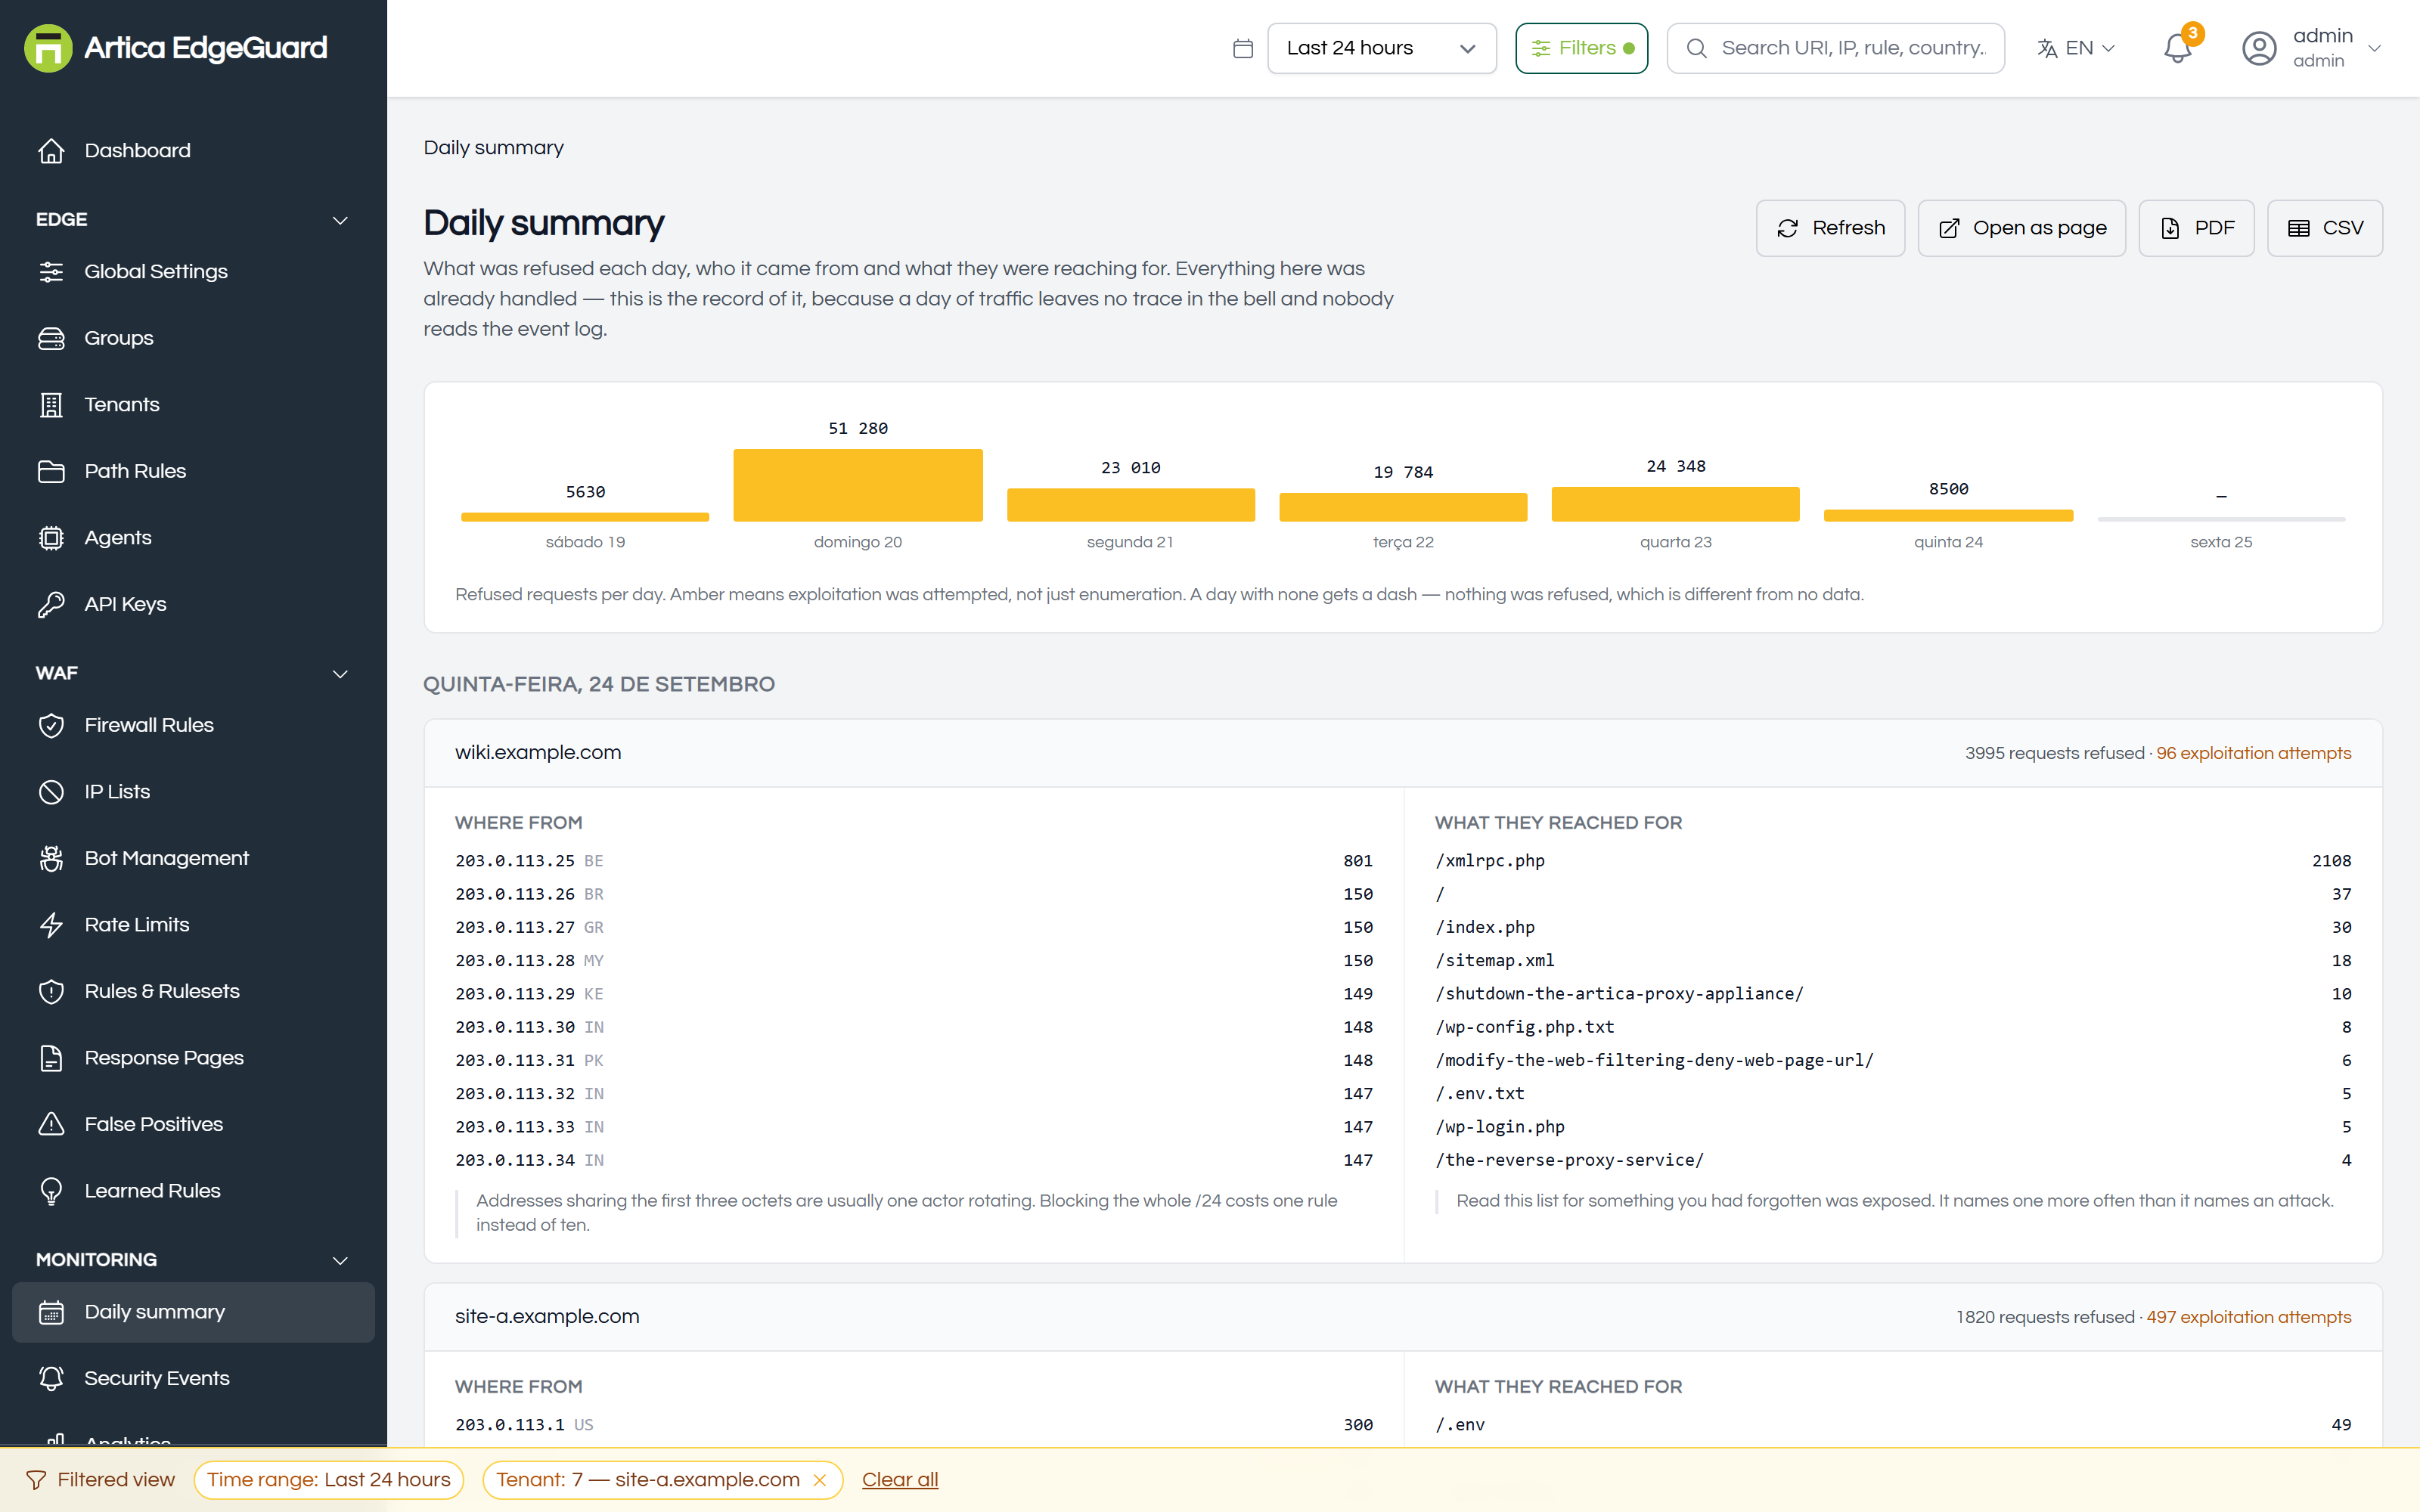
What was refused each day, who it came from and what they were reaching for. The record of handled traffic, which the bell deliberately does not keep.
Full documentation: EdgeGuard — Daily summary
¶ Security Events
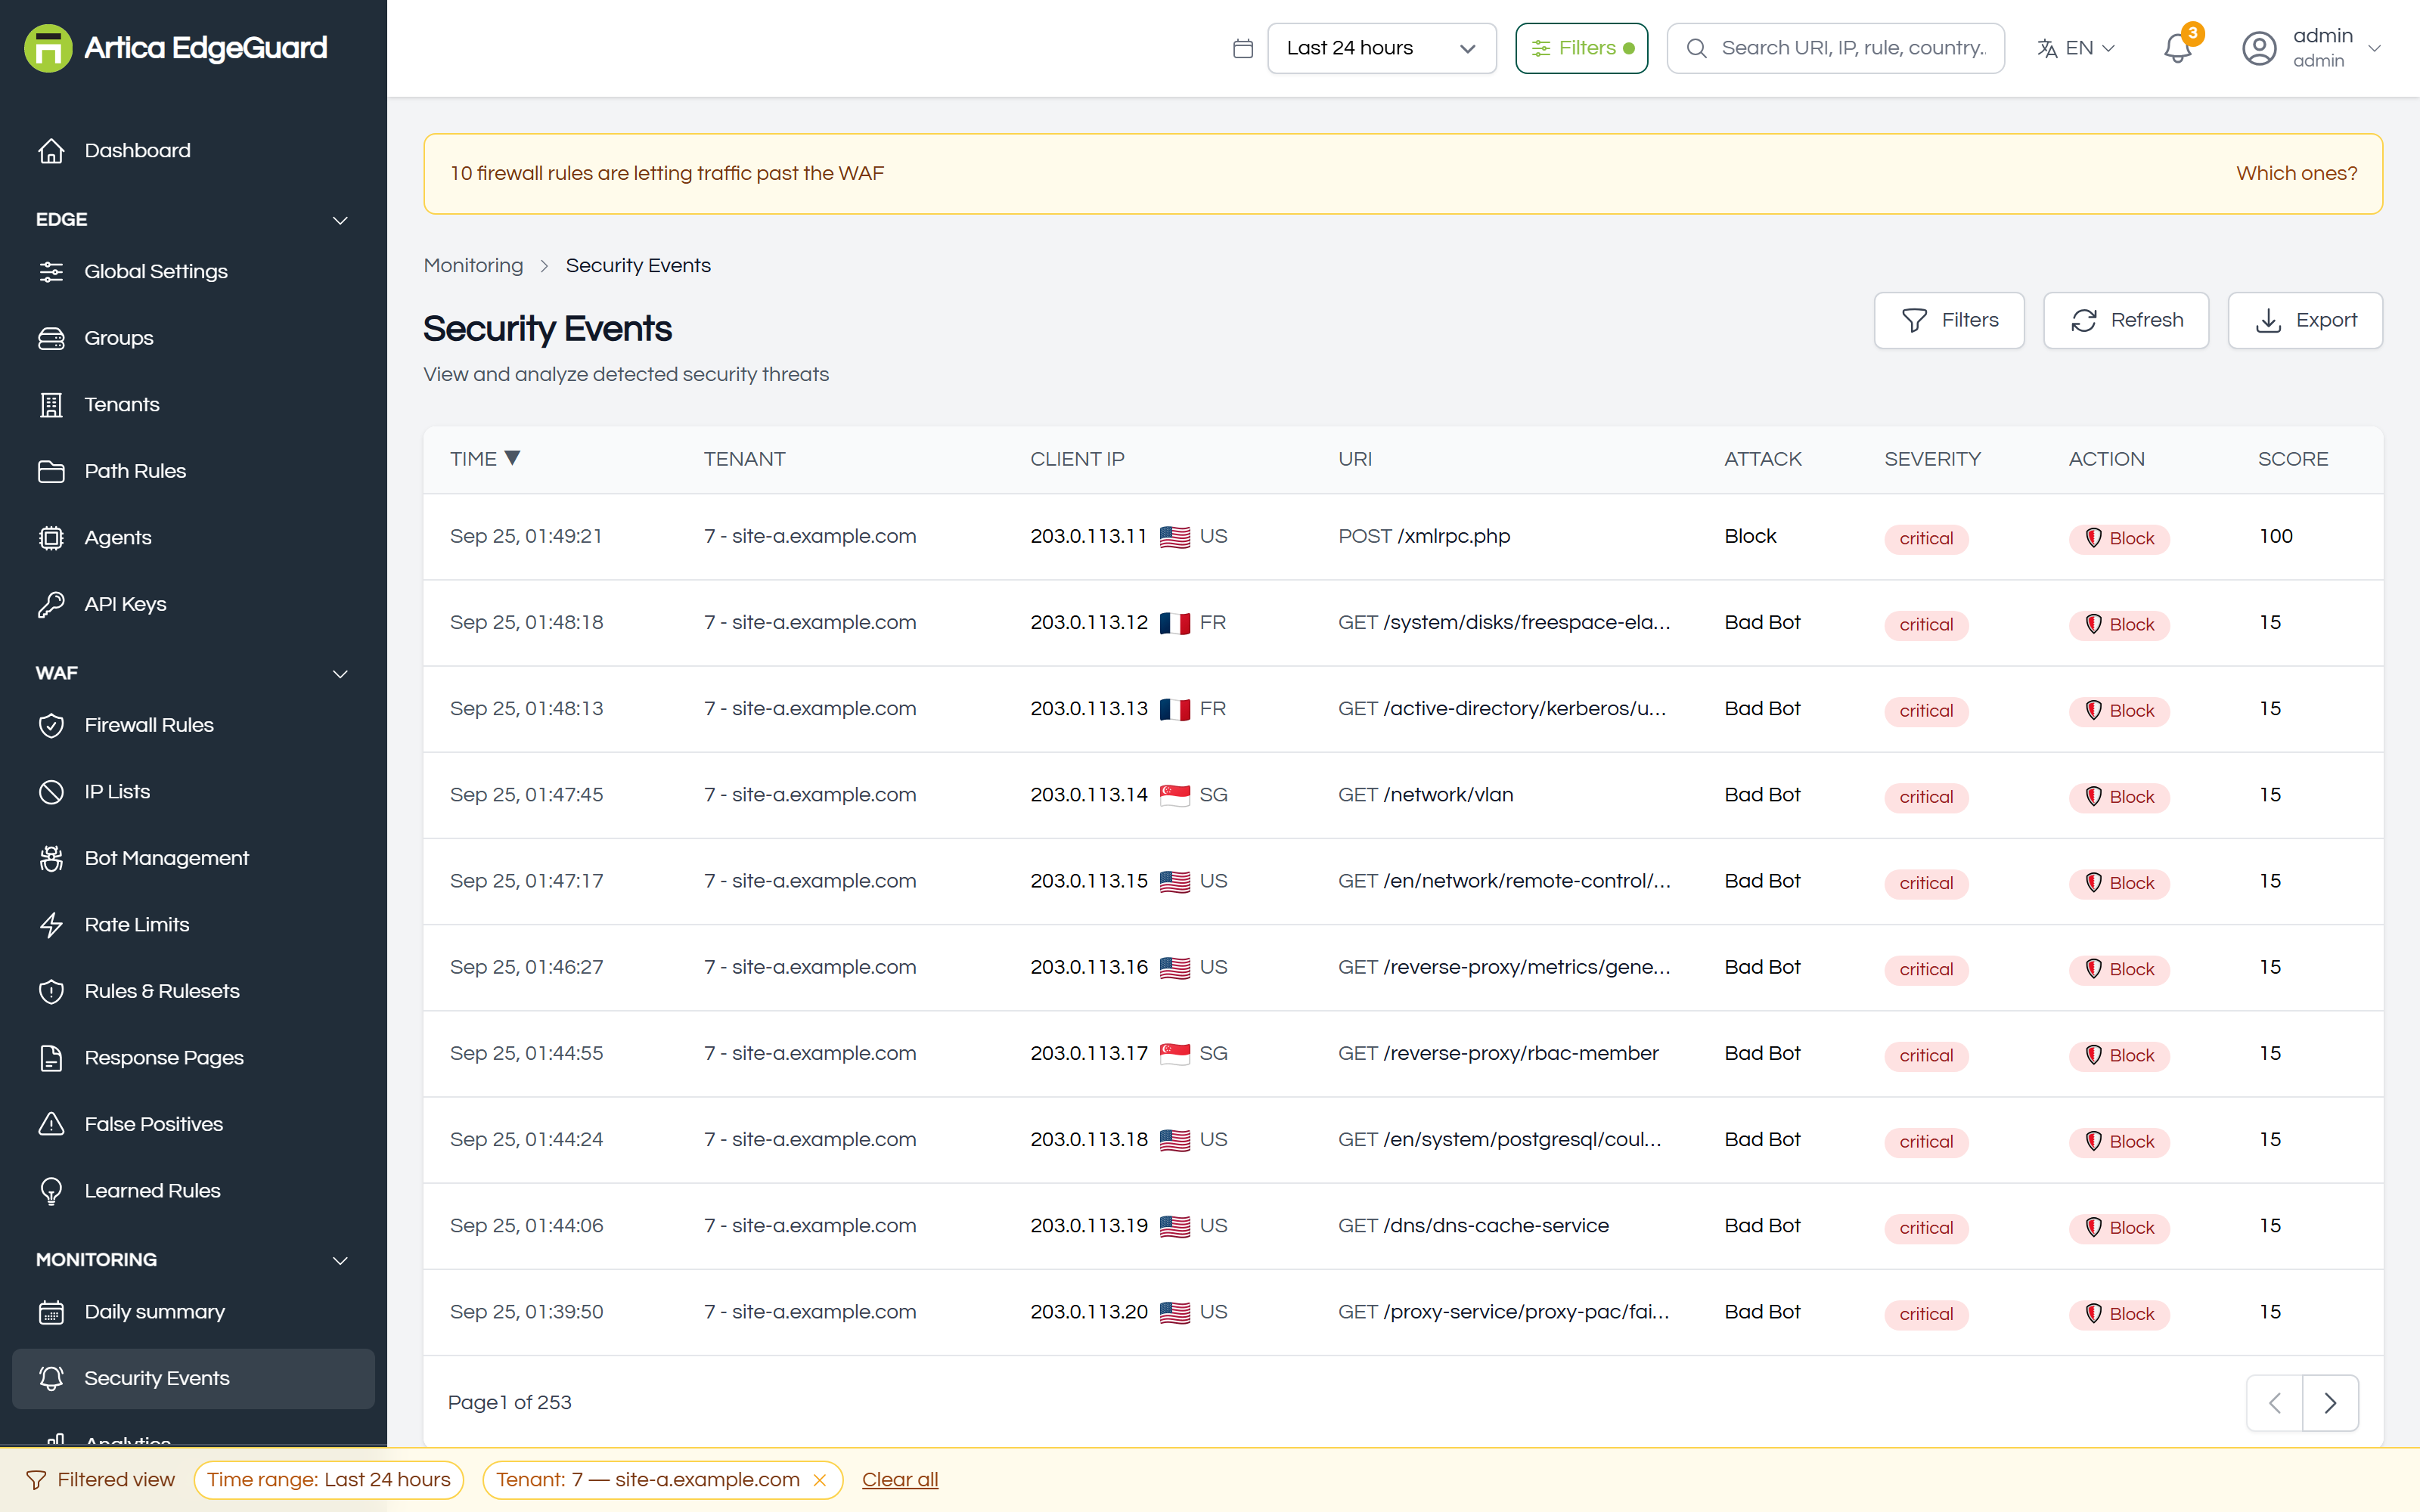
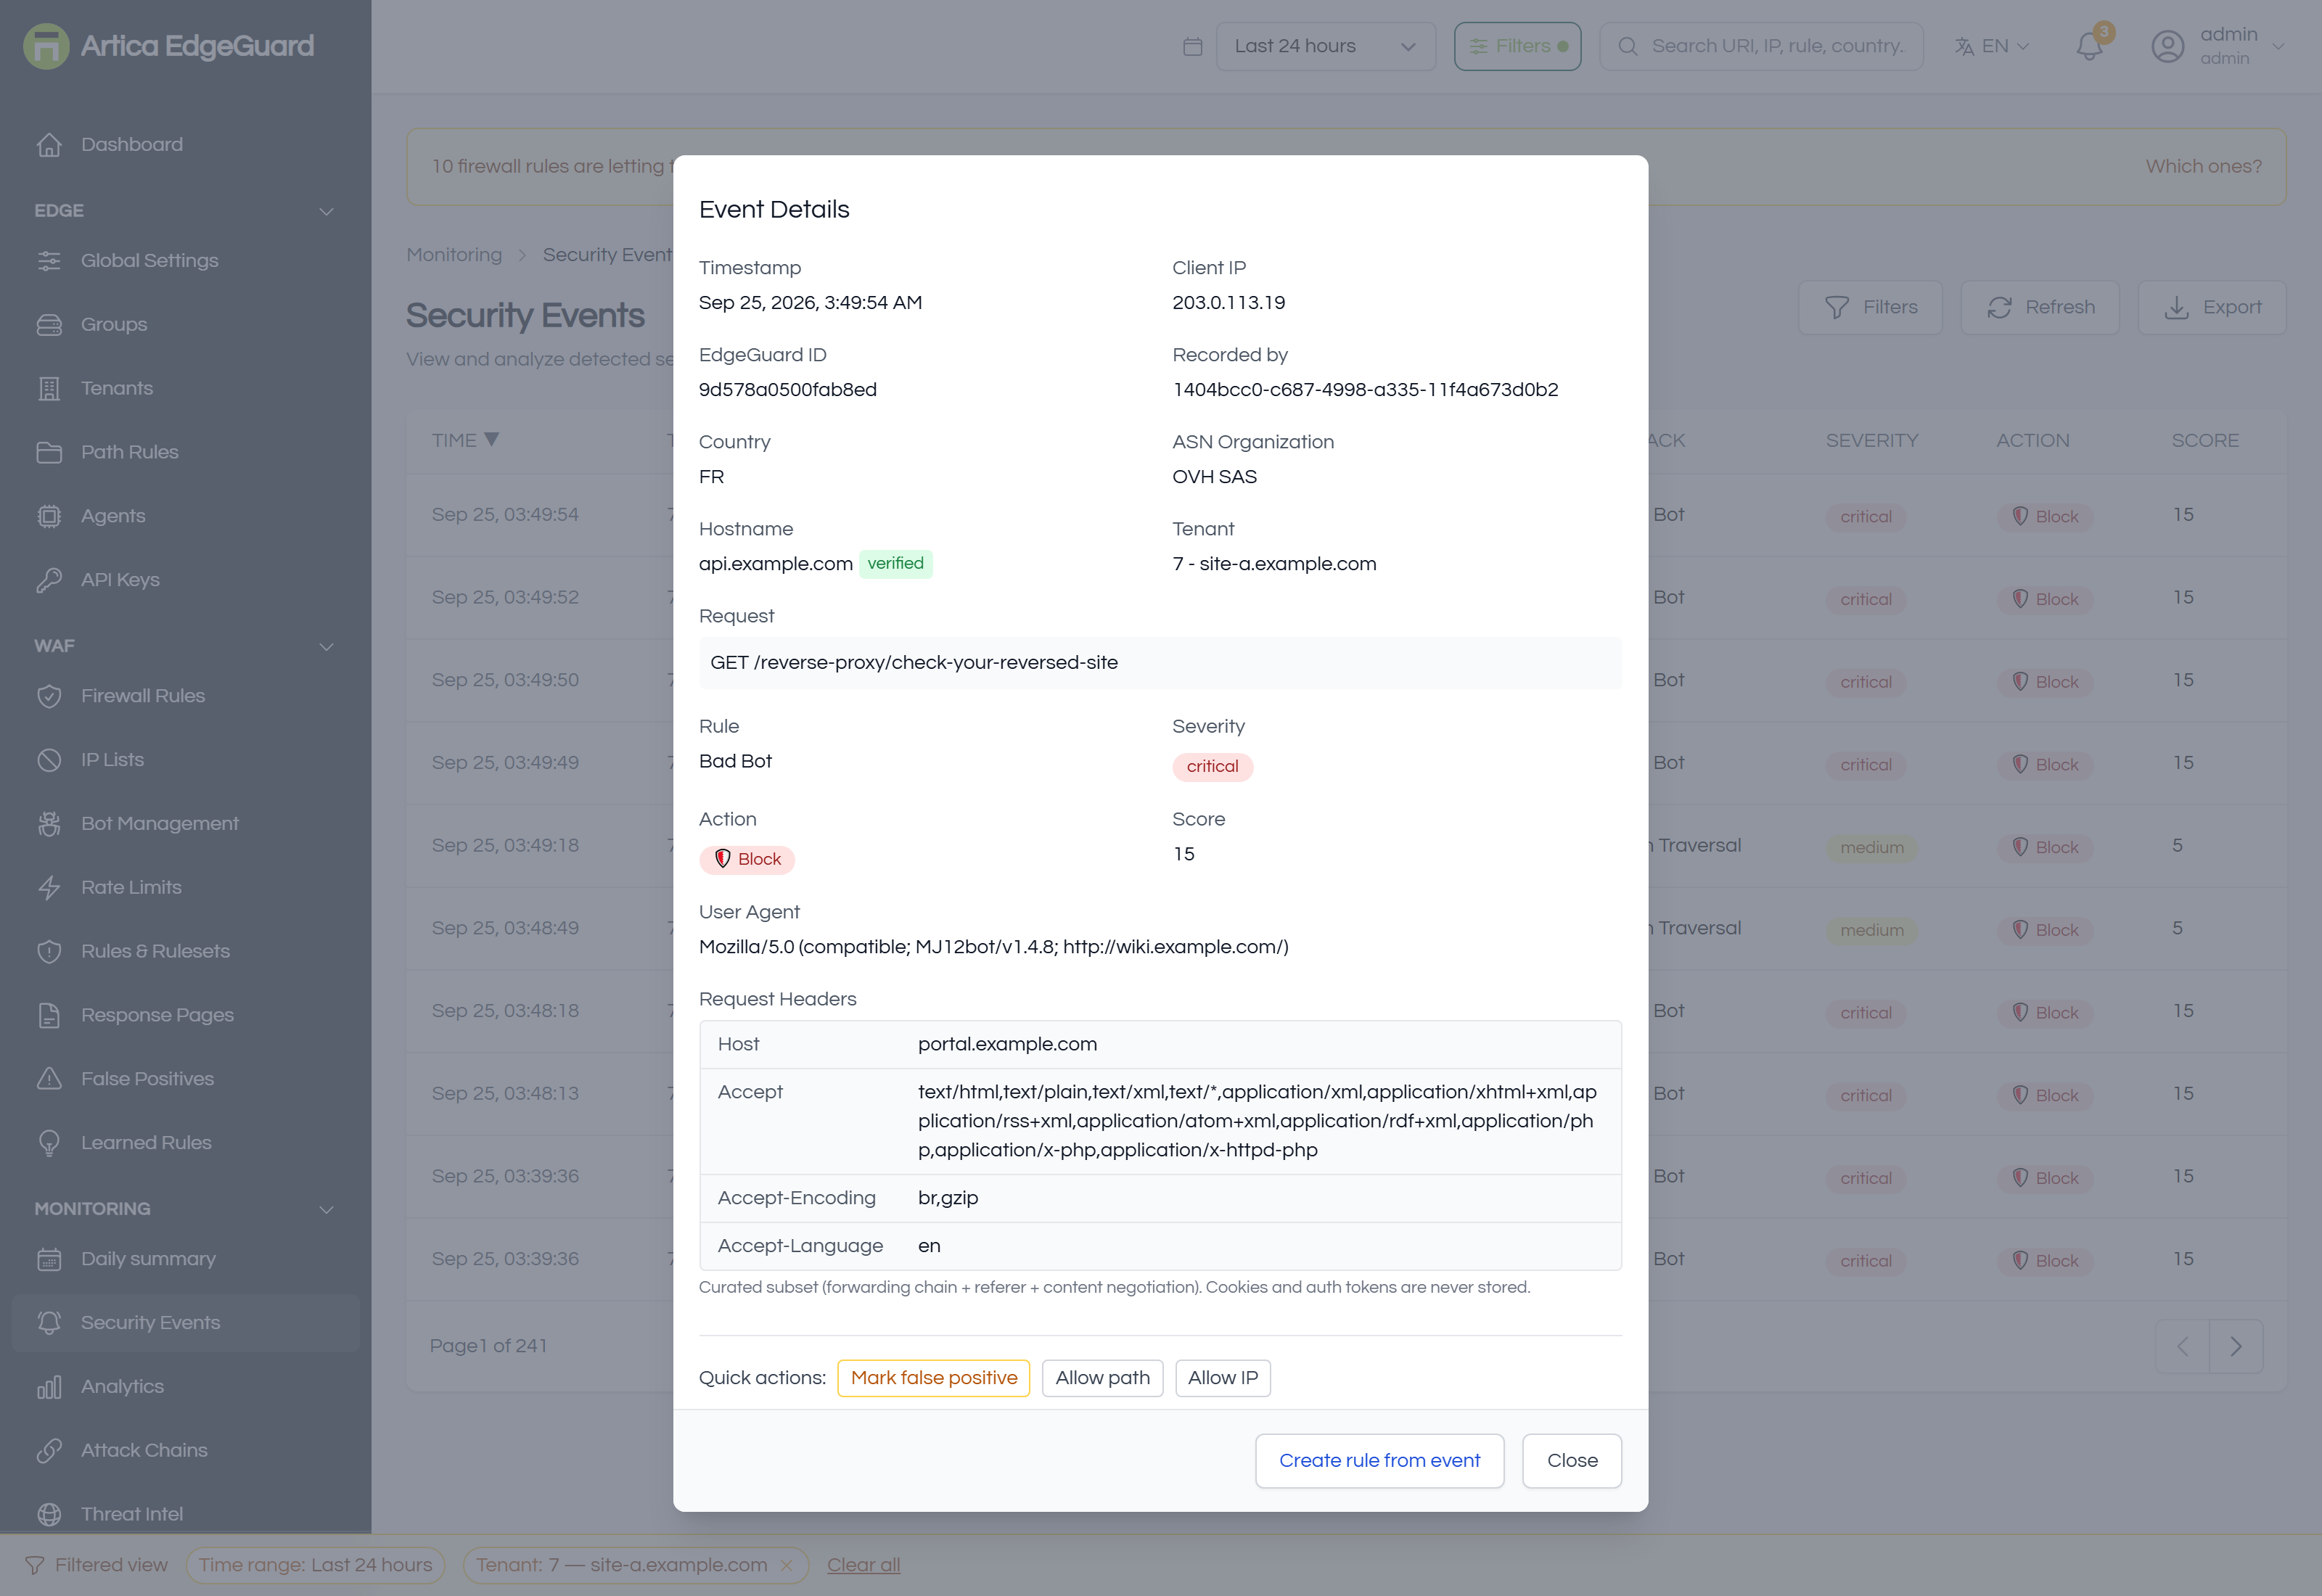
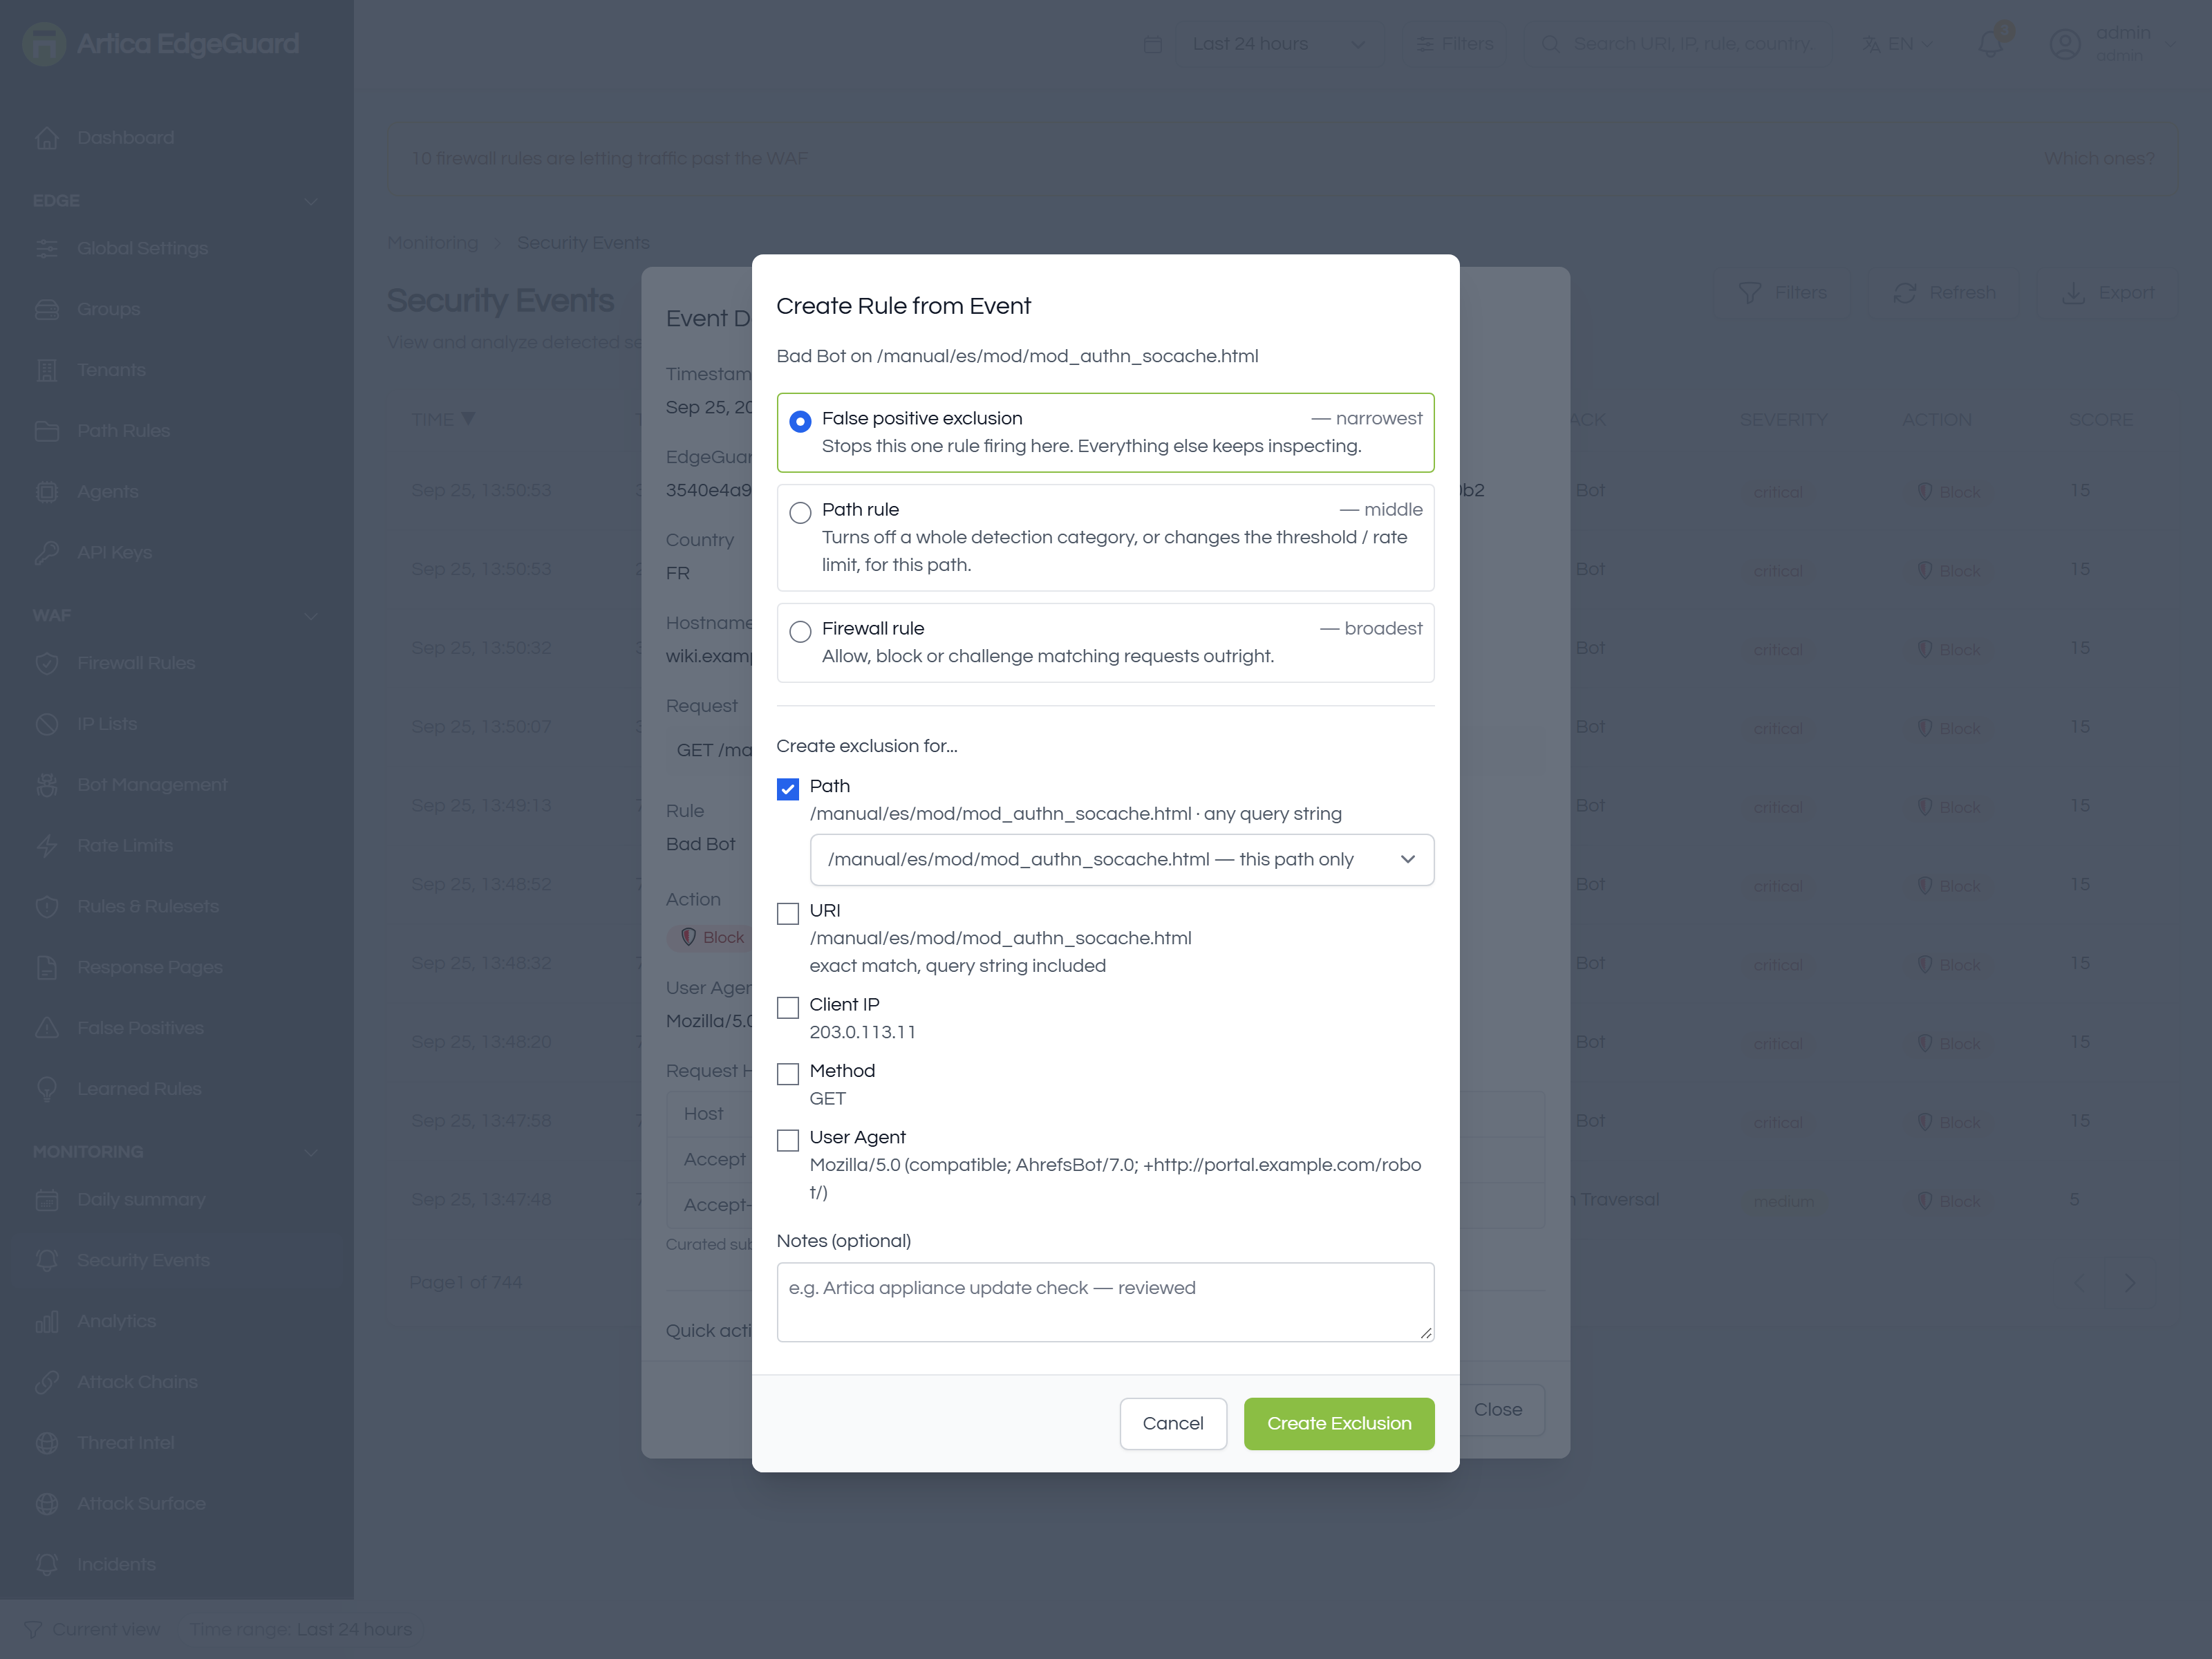
Every decision EdgeGuard made, one row per request it acted on — and the place to turn one into an exclusion, a path rule or a firewall rule.
Full documentation: EdgeGuard — Security Events
¶ Analytics
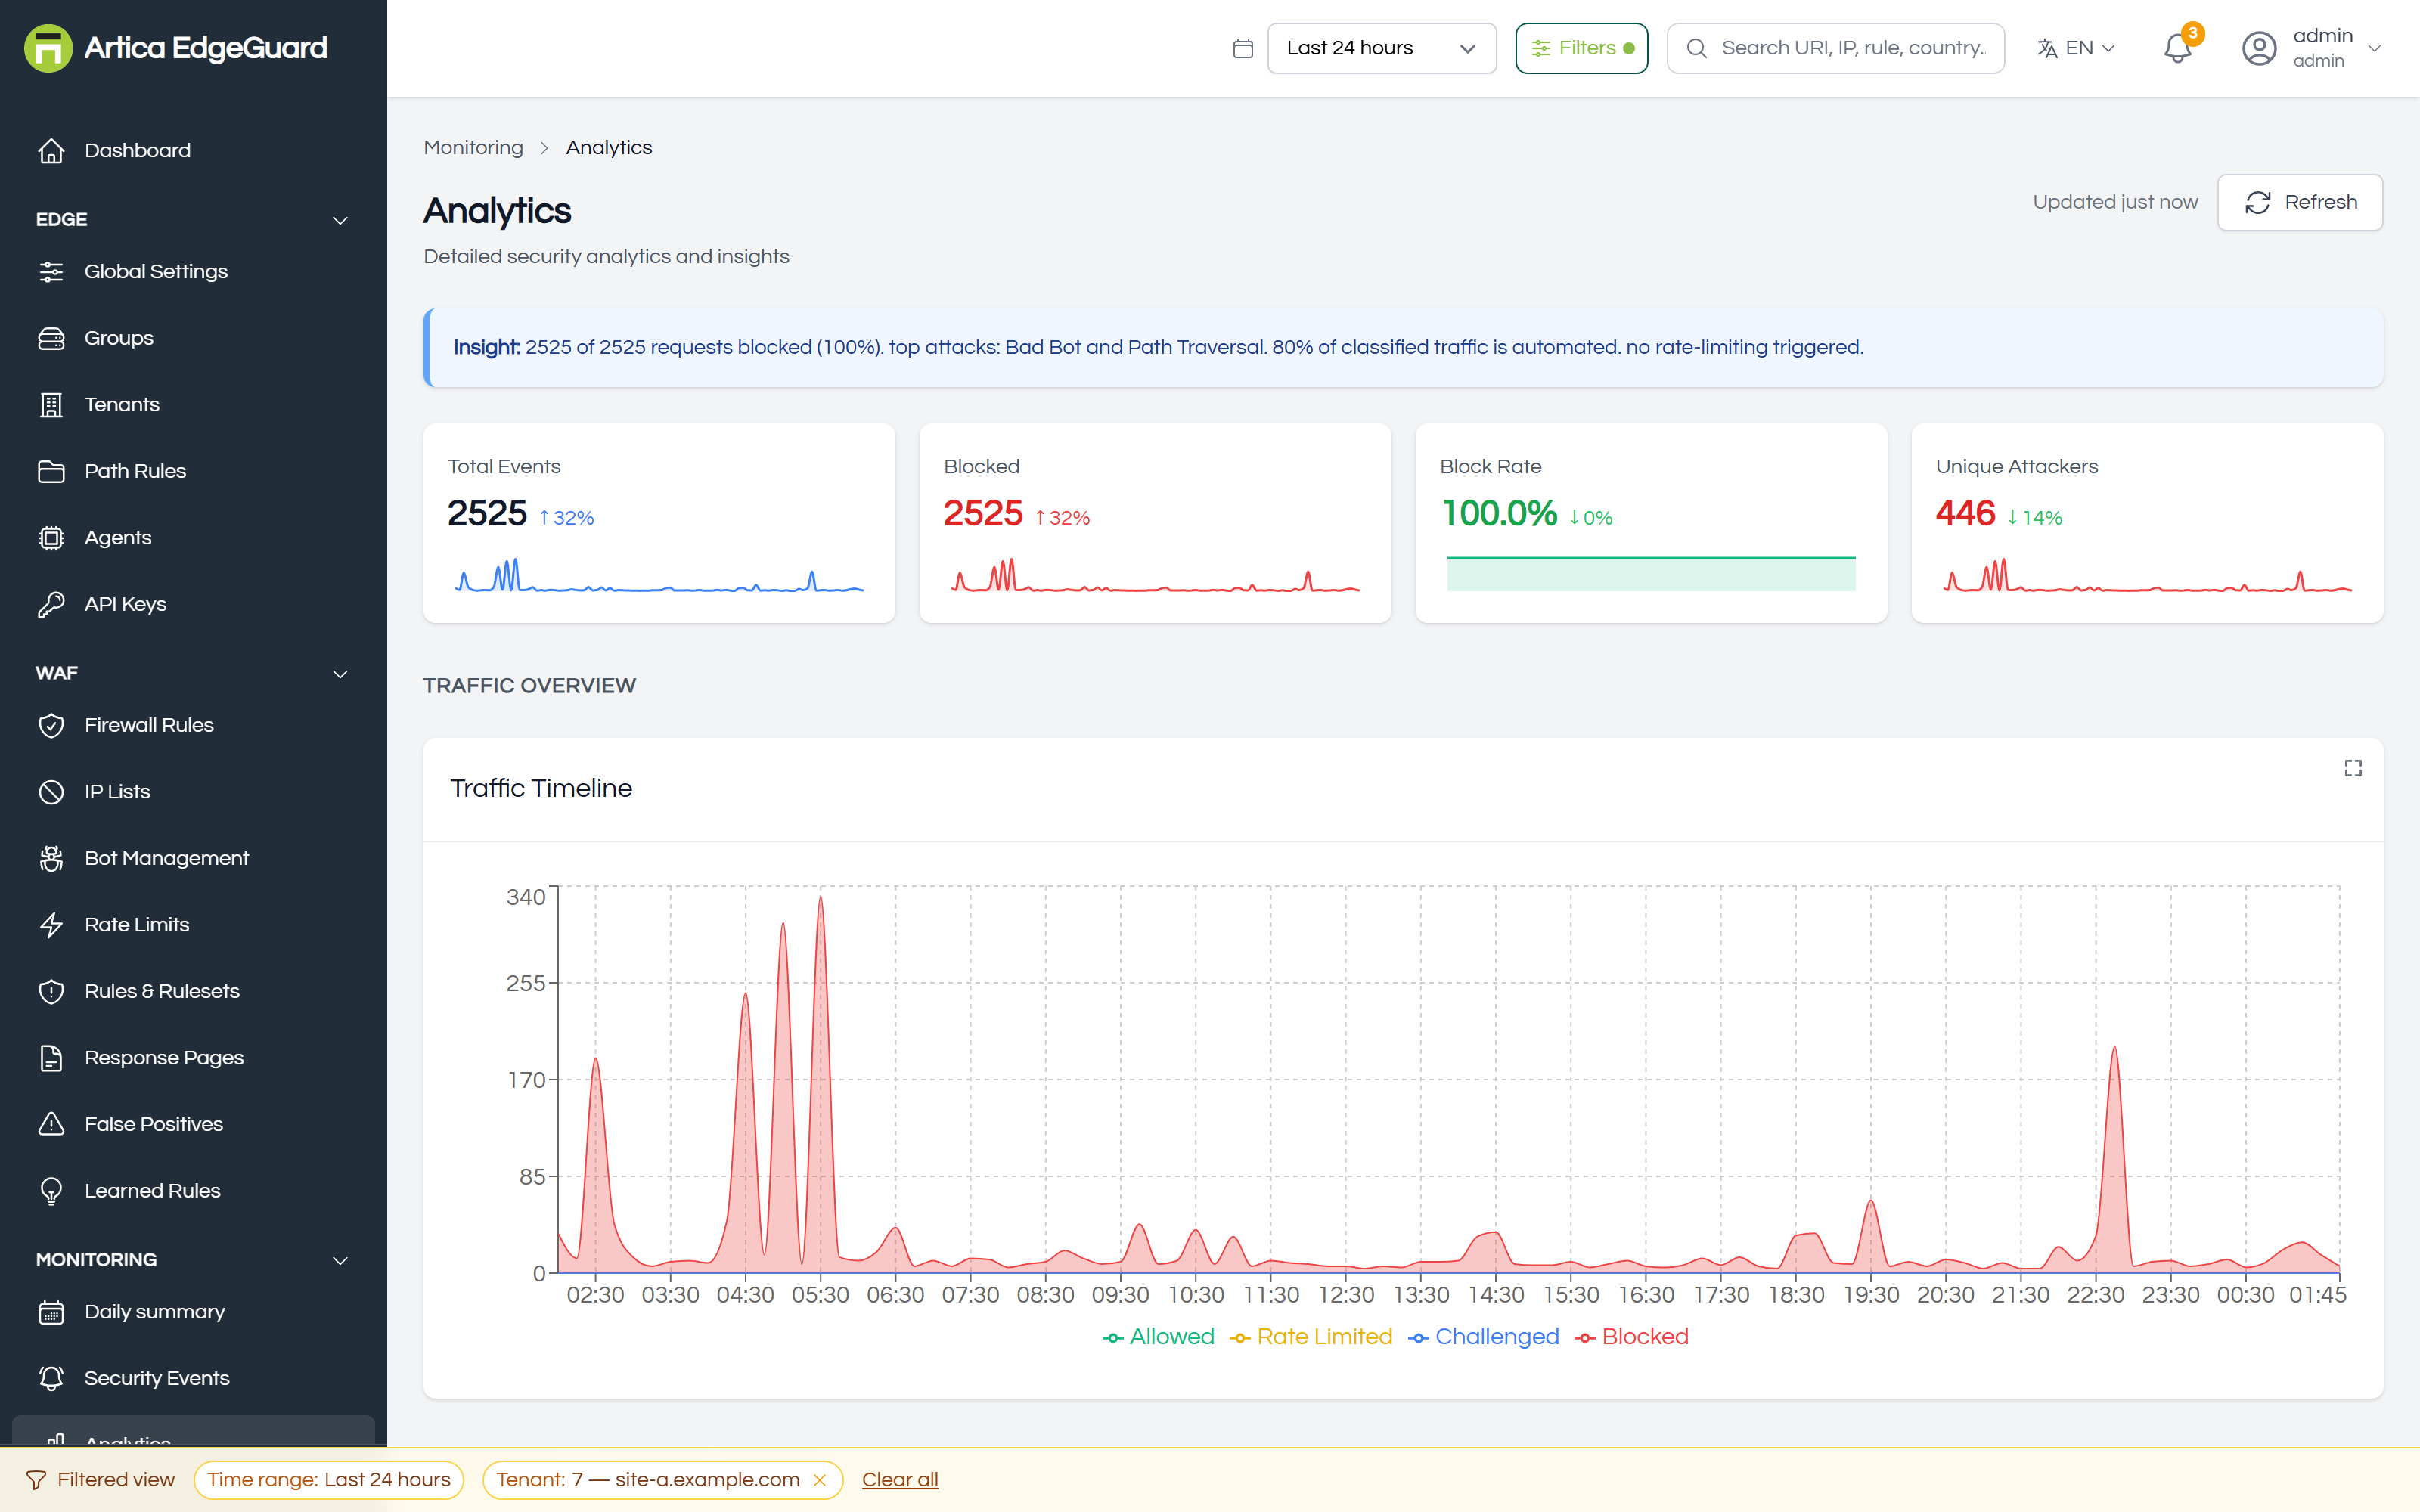
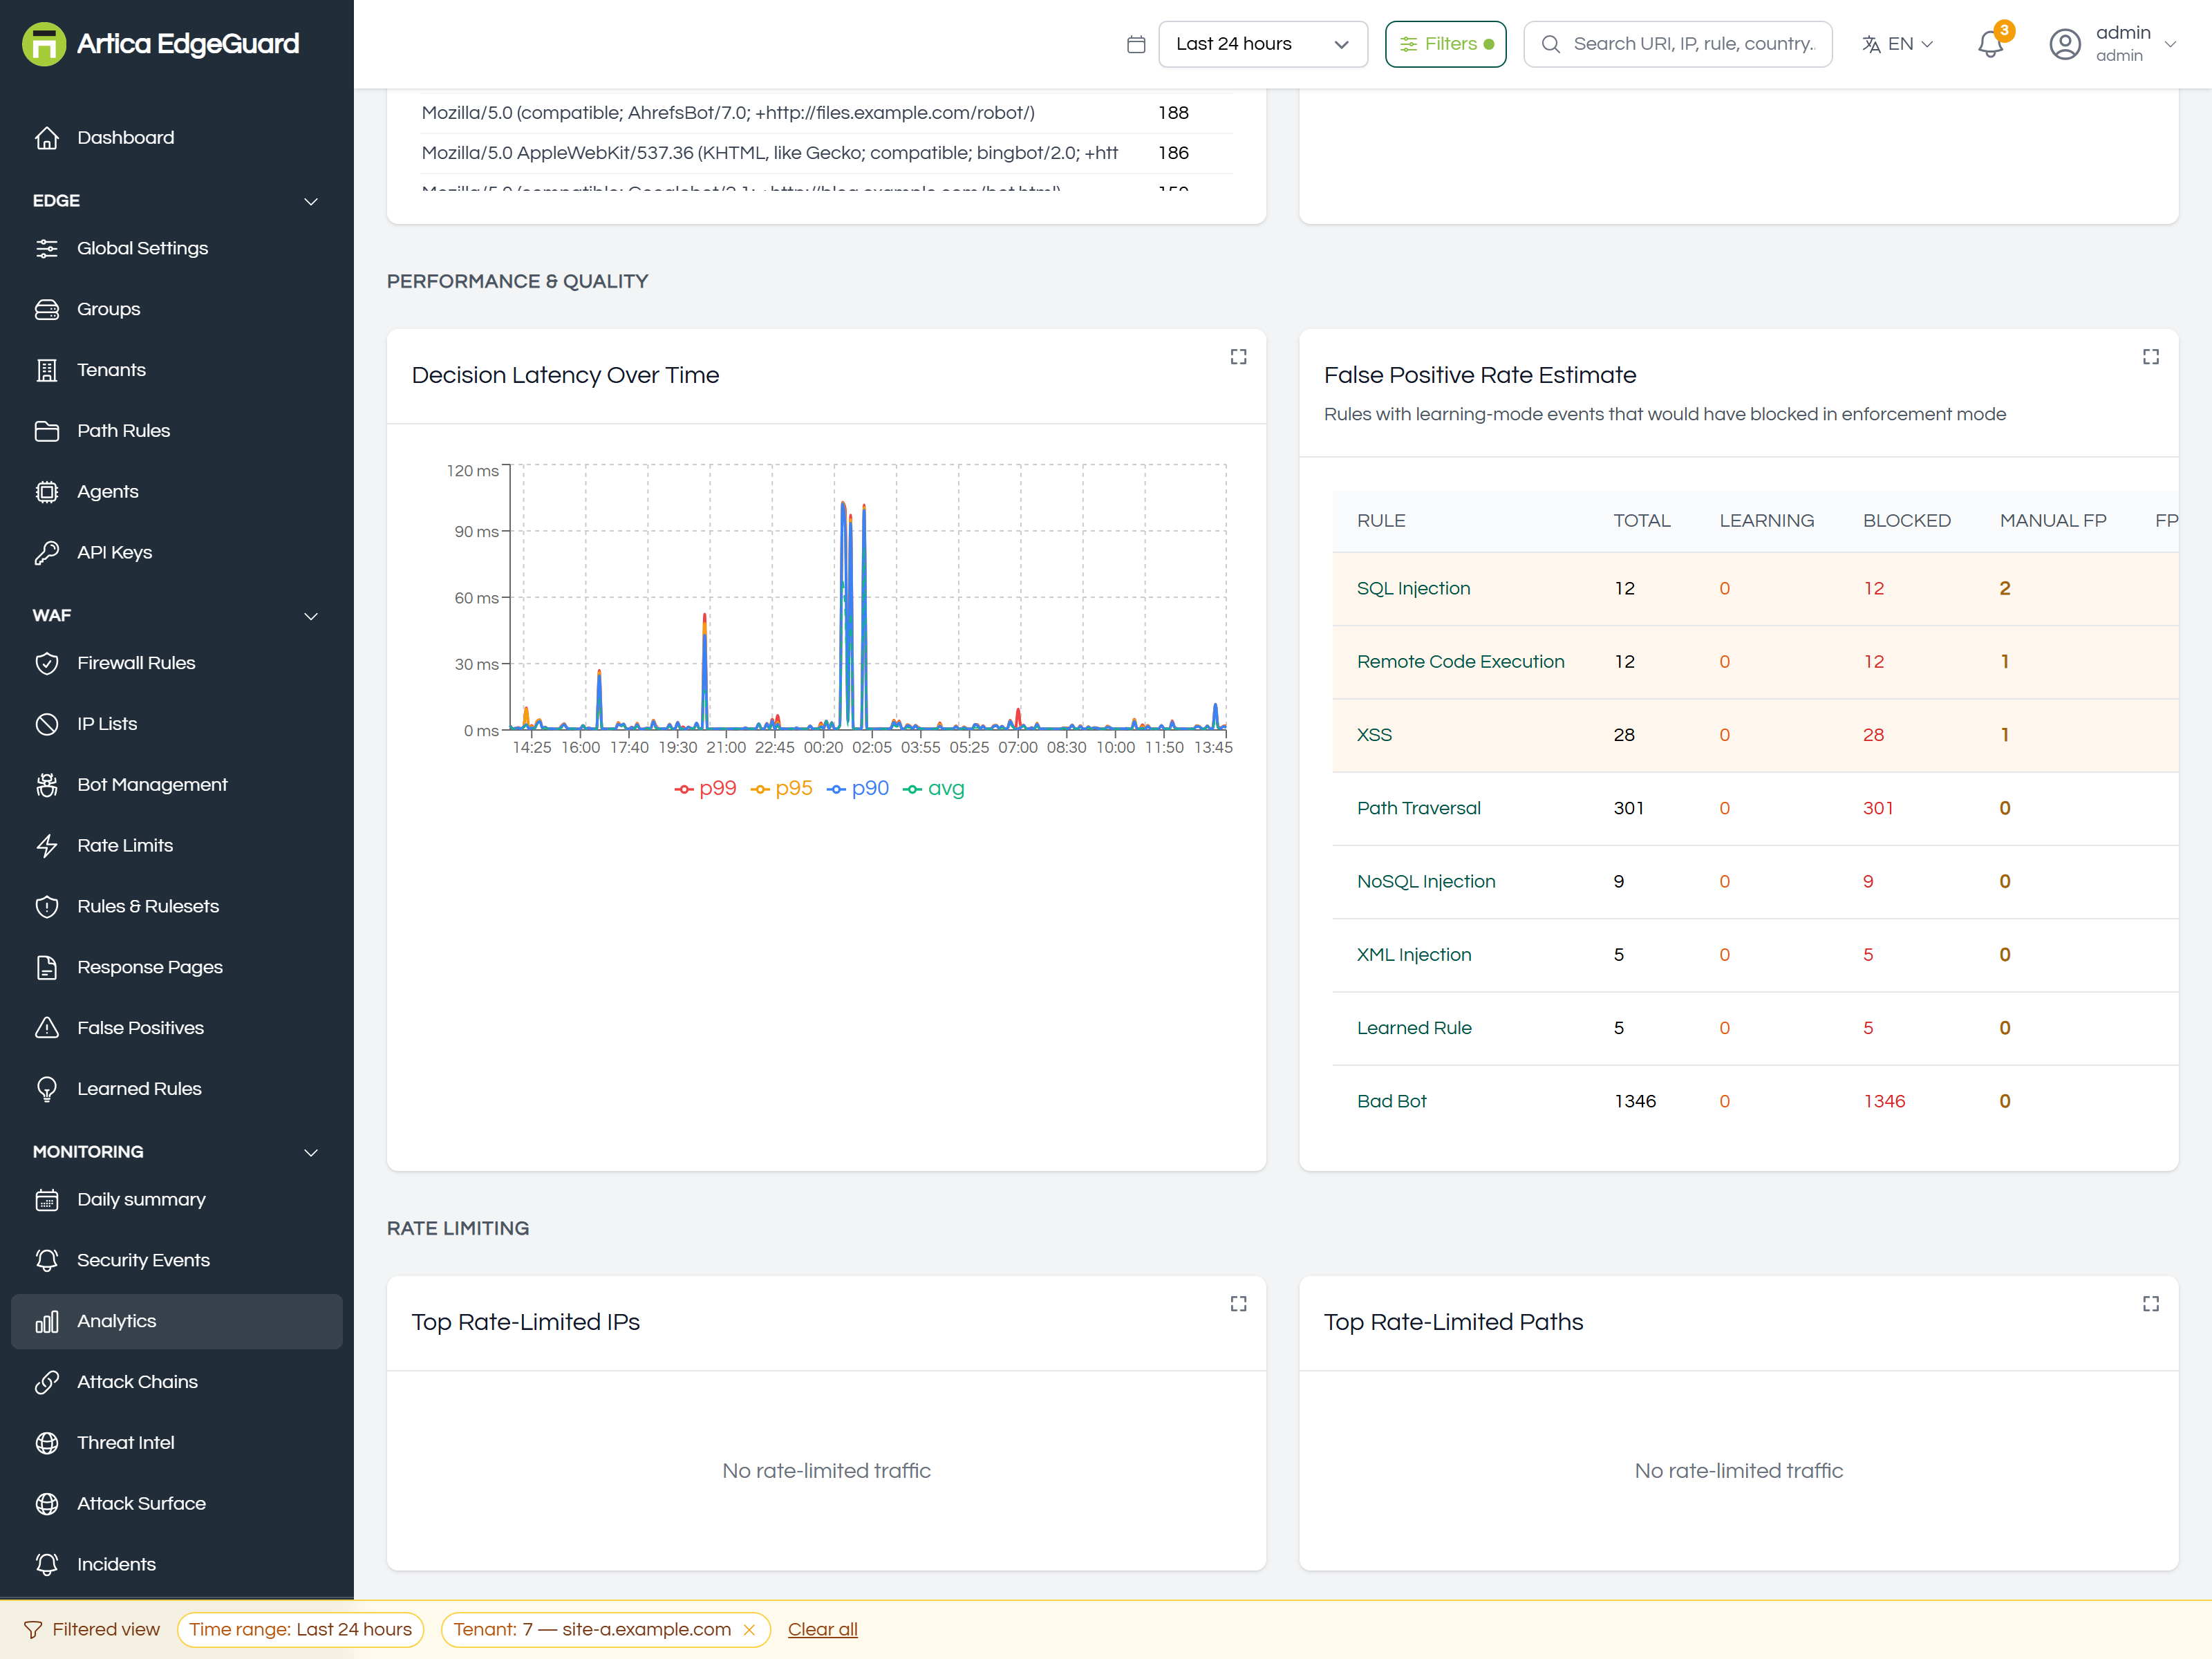
The shape of the traffic rather than the requests: what is attacked and from where, how the rules behave, what protection costs in latency.
Full documentation: EdgeGuard — Analytics
¶ Attack Chains
Events grouped by source address into campaigns: what one attacker tried, in what order, and how far they got.
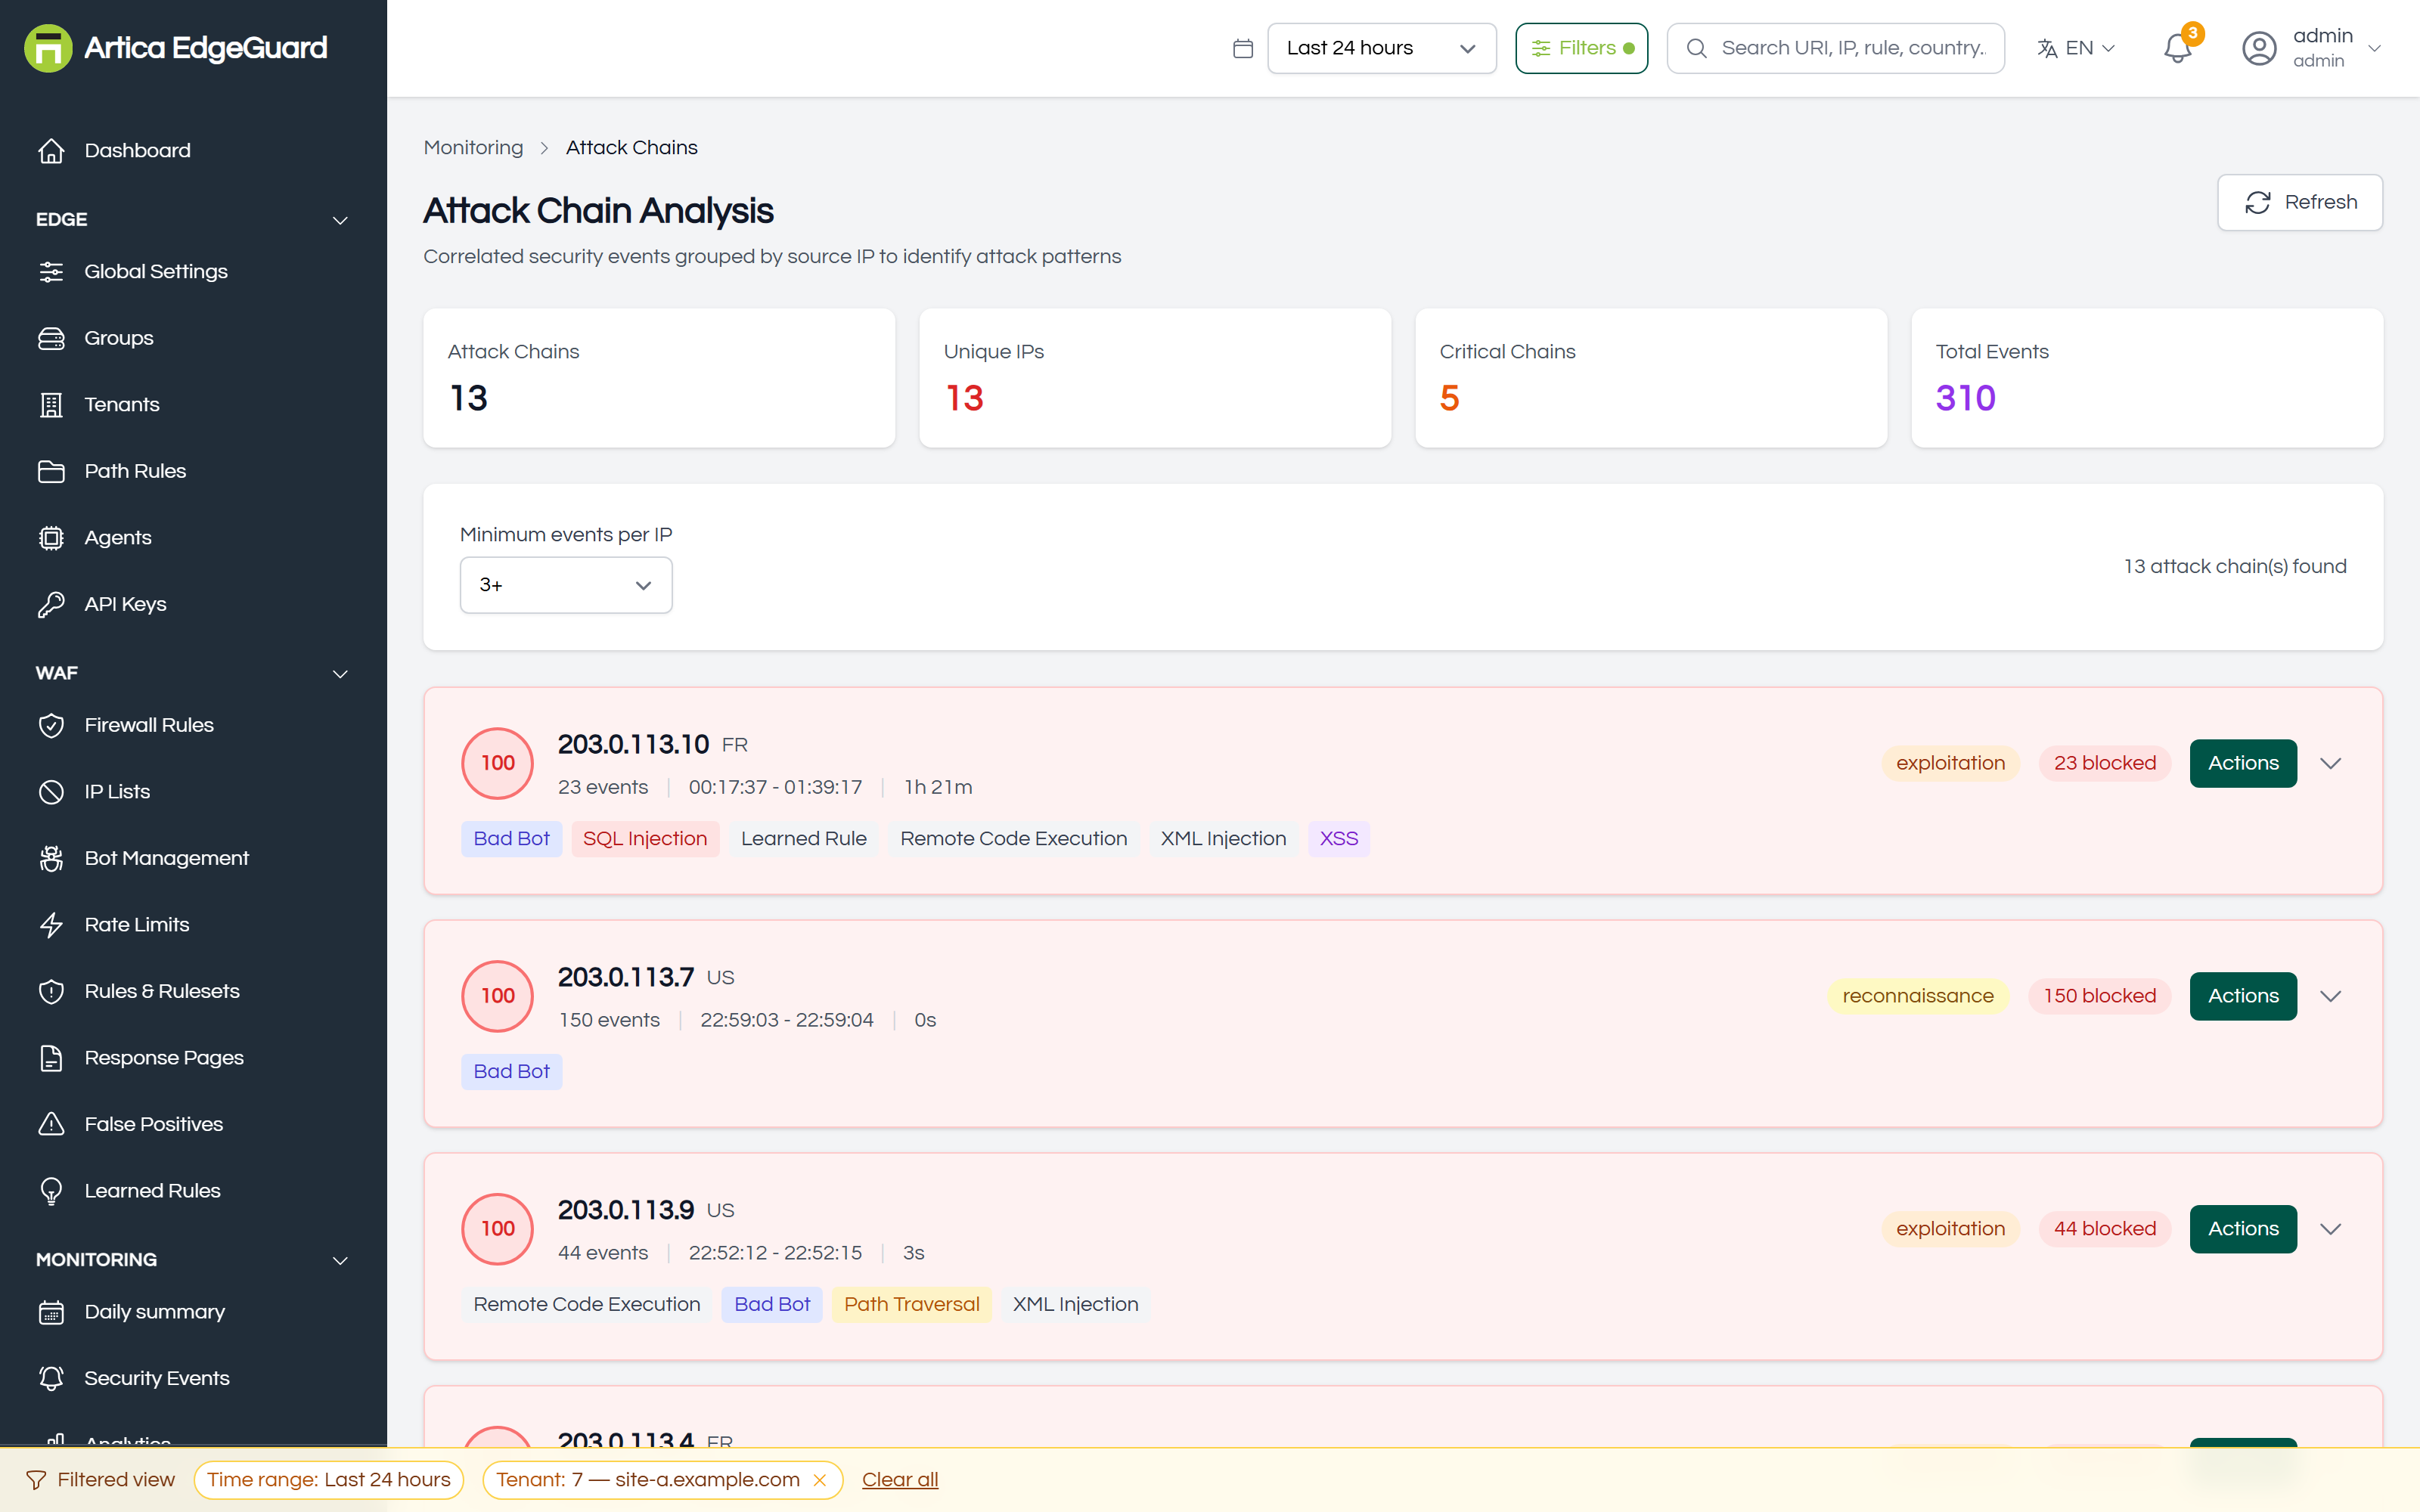
Full documentation: EdgeGuard — Attack Chains
¶ Threat Intelligence
Feeds, indicators and reputation: what EdgeGuard knows about an address before it arrives, and how to add what you know.
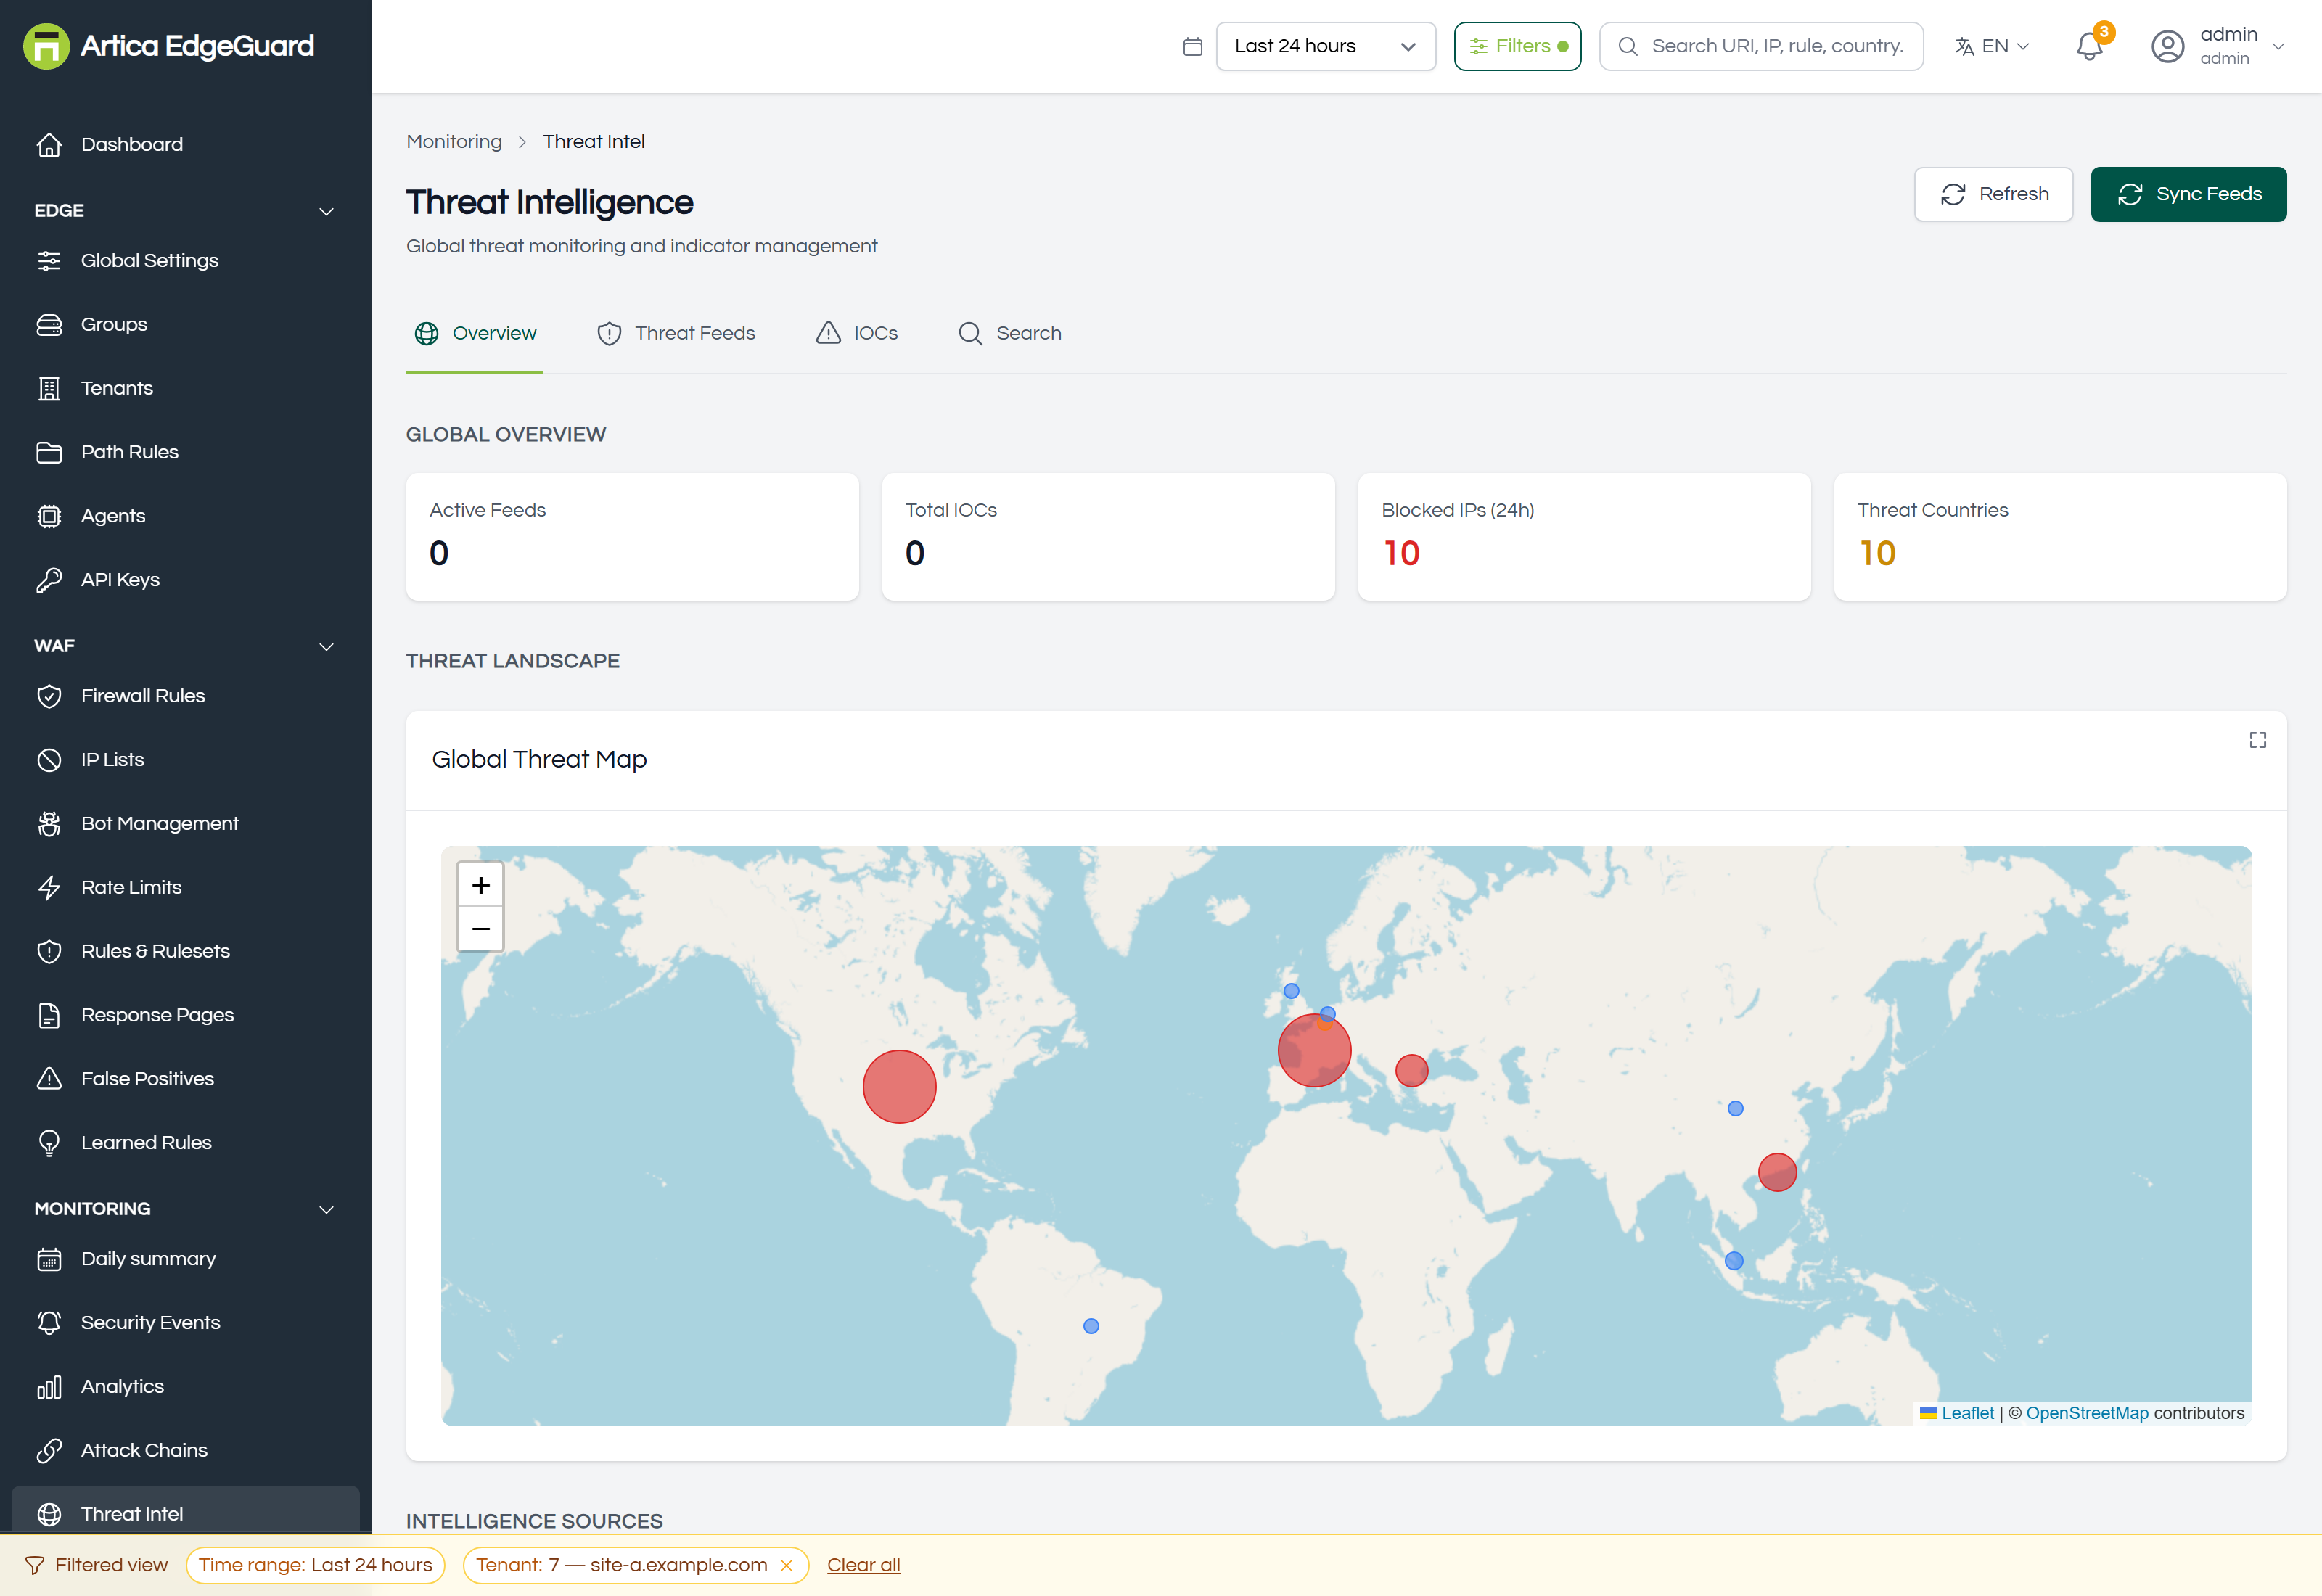
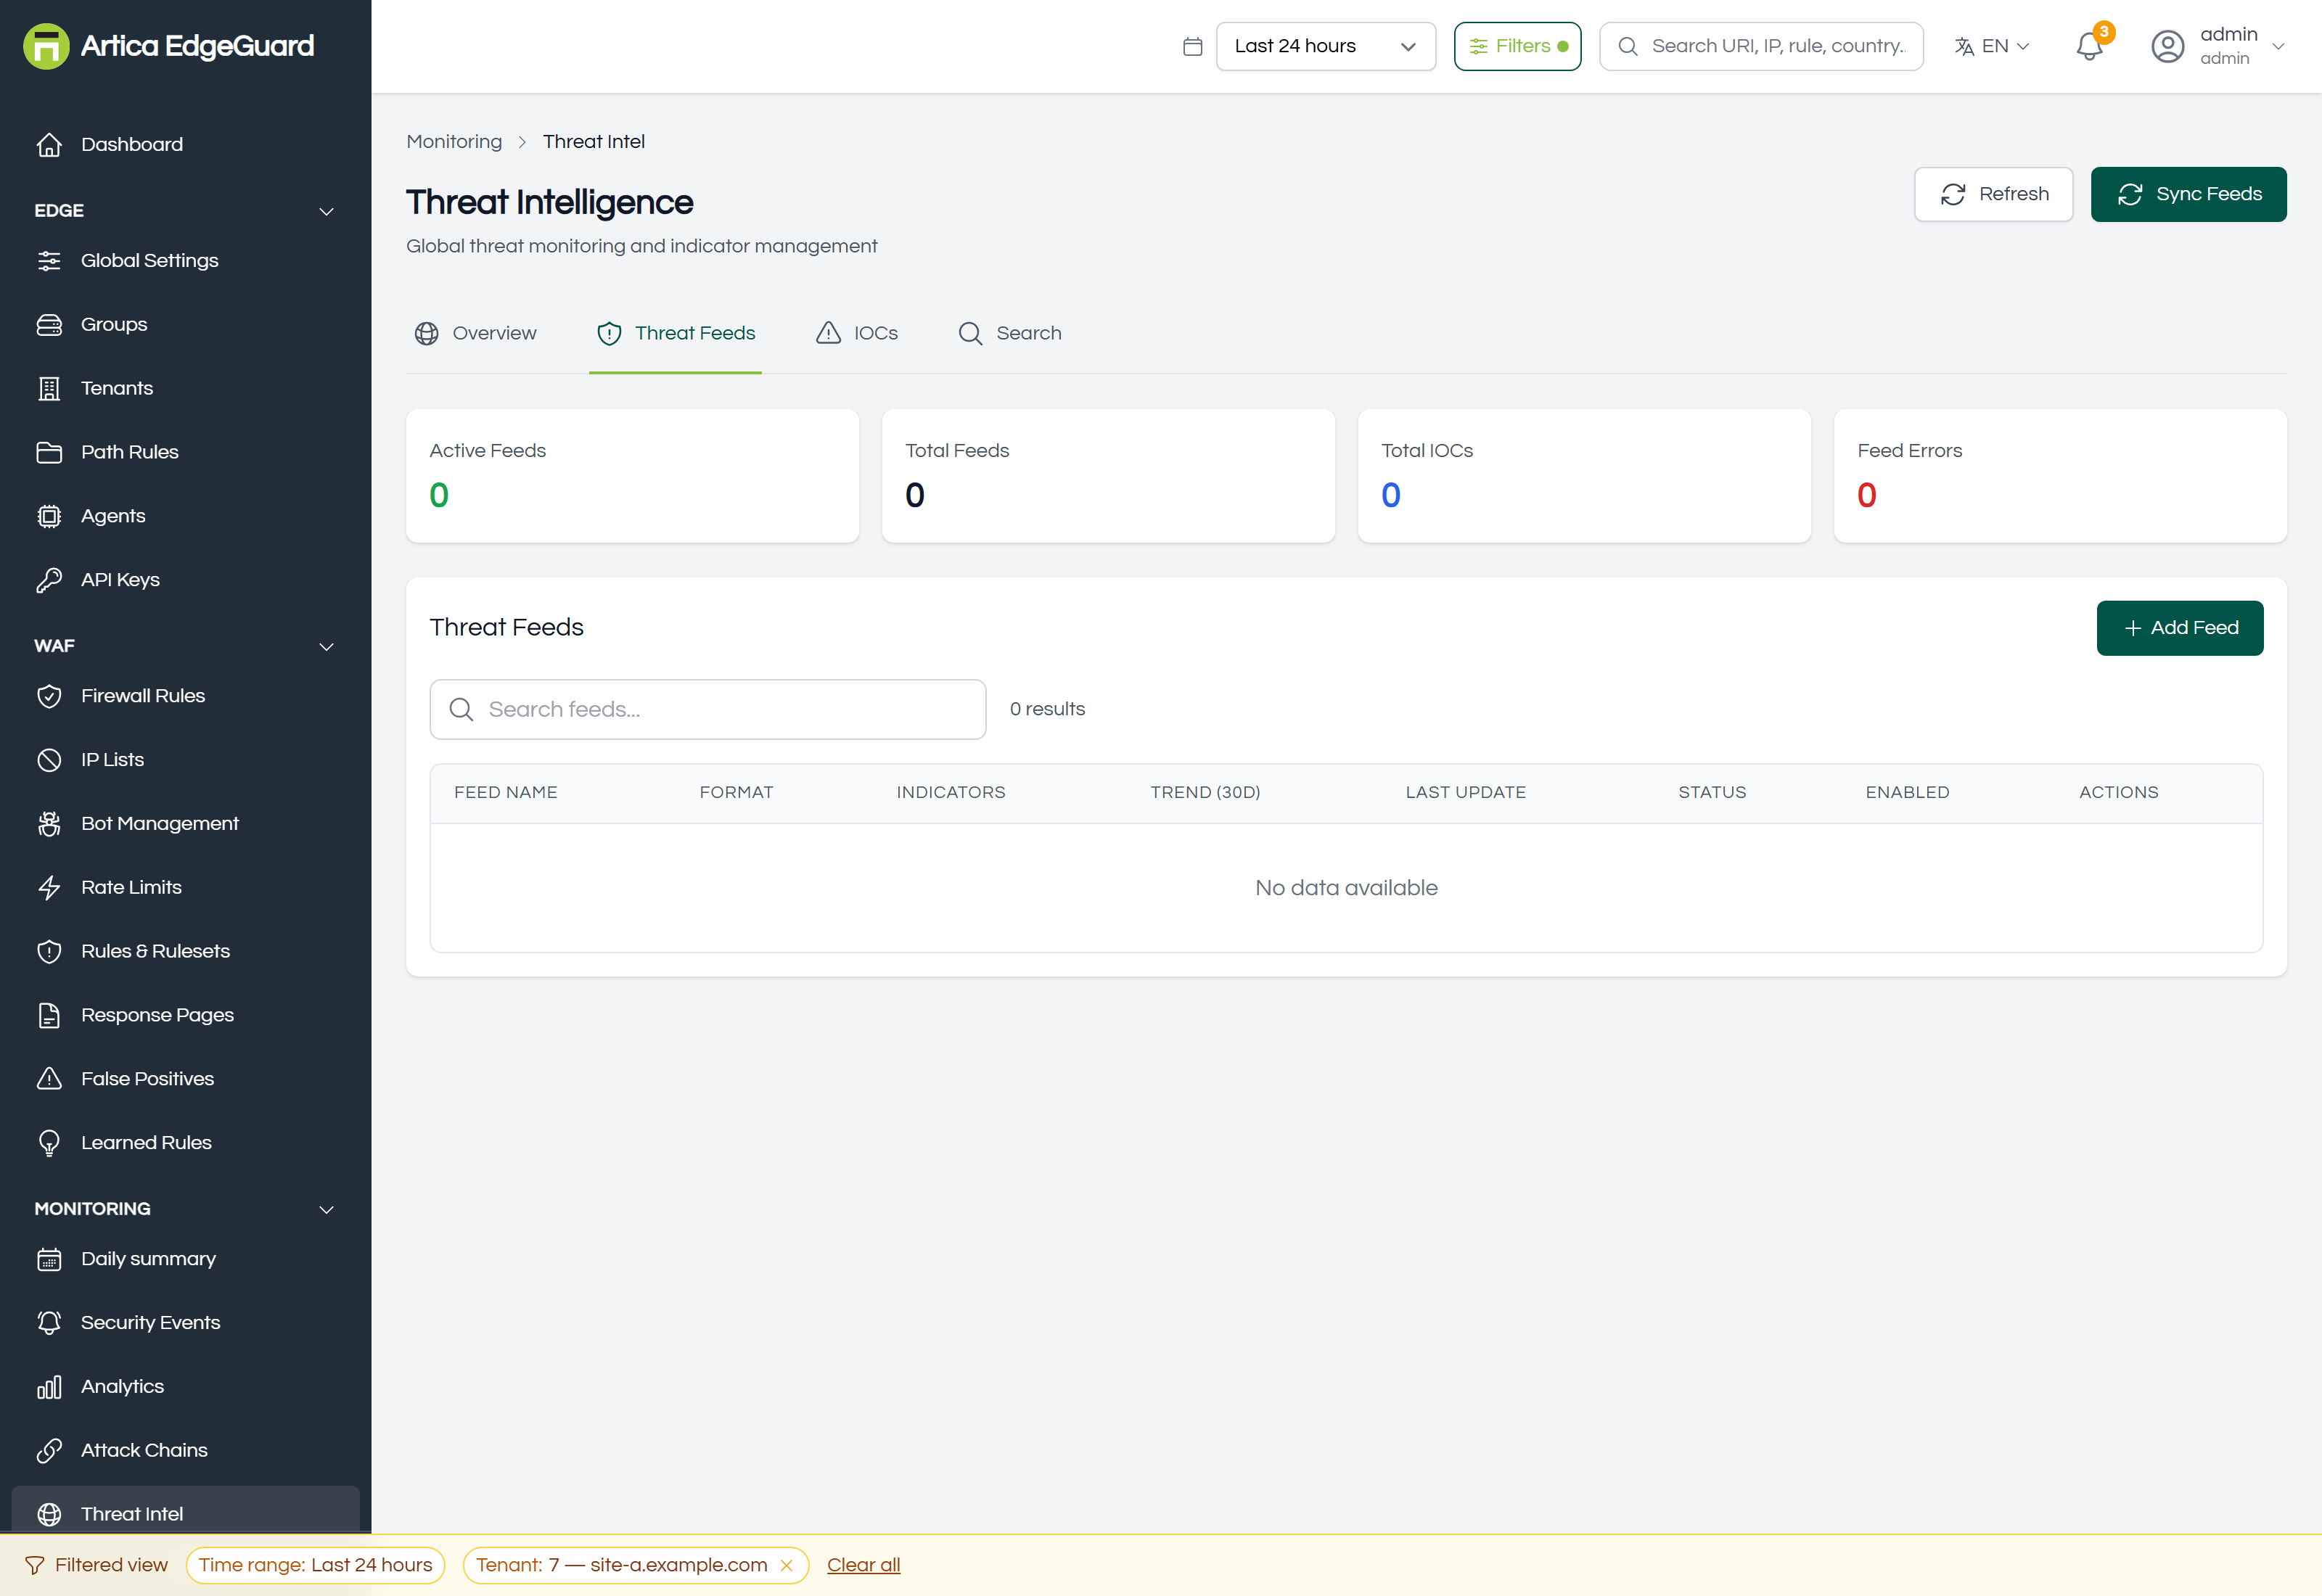
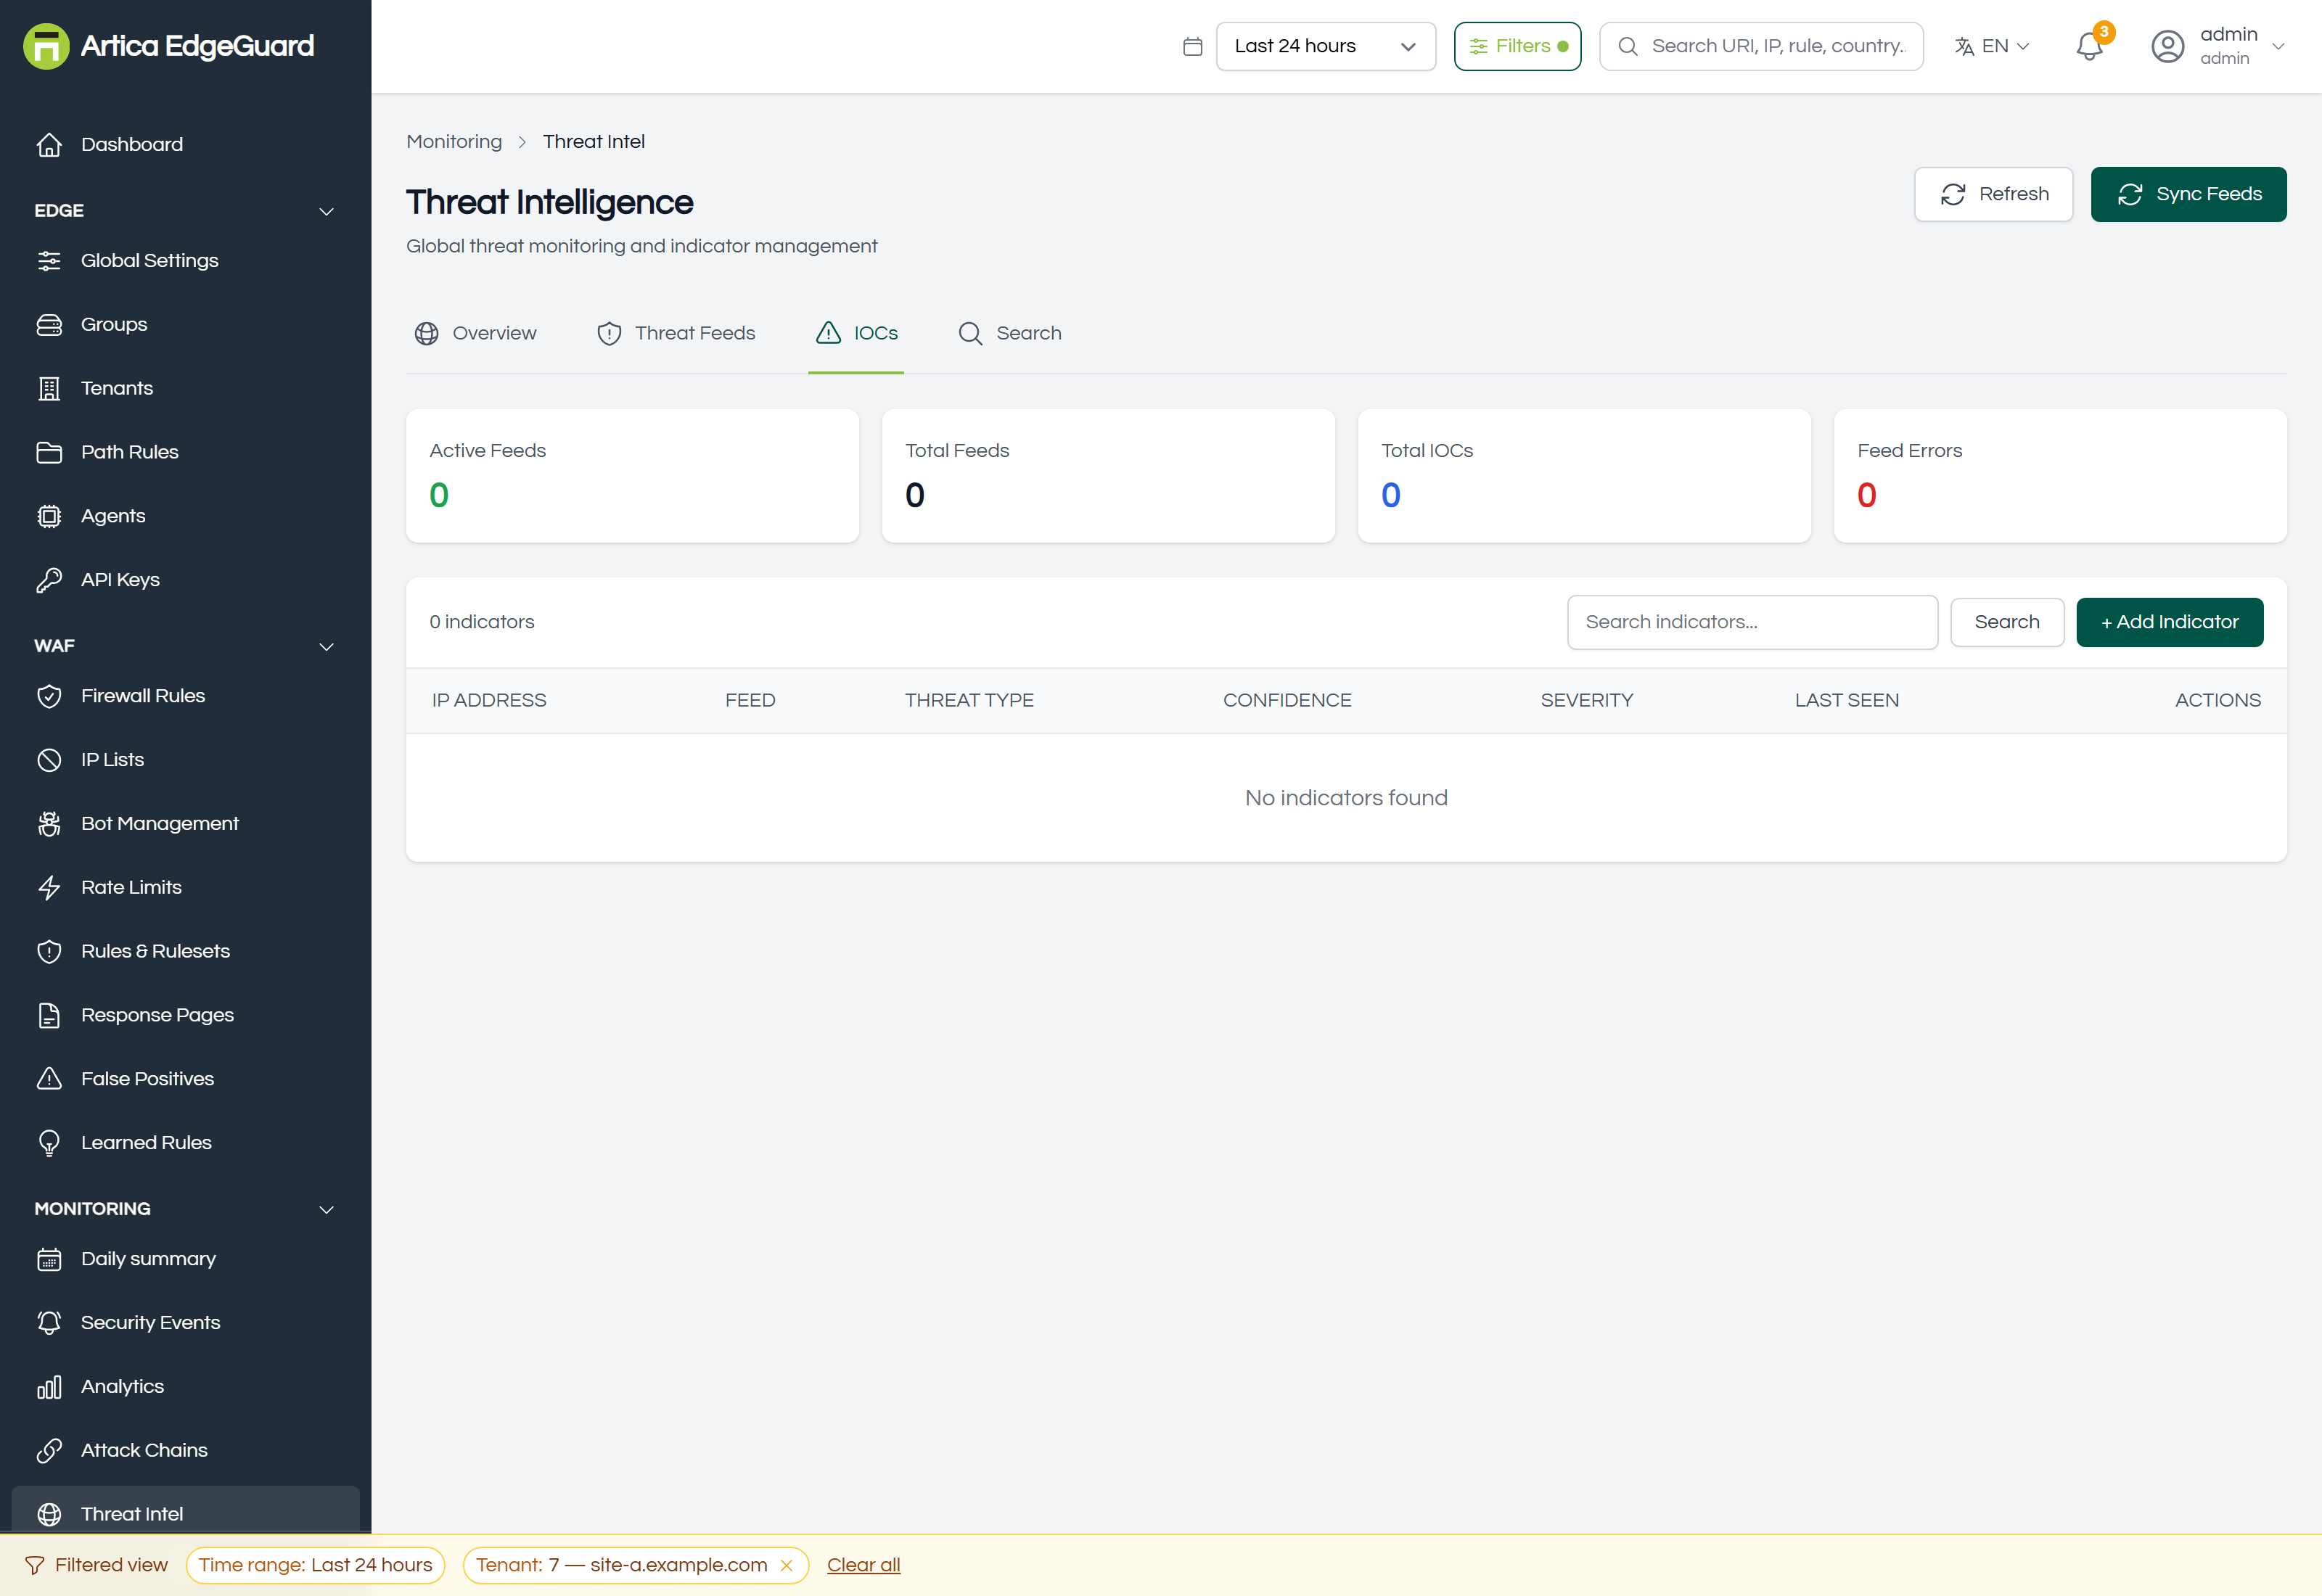
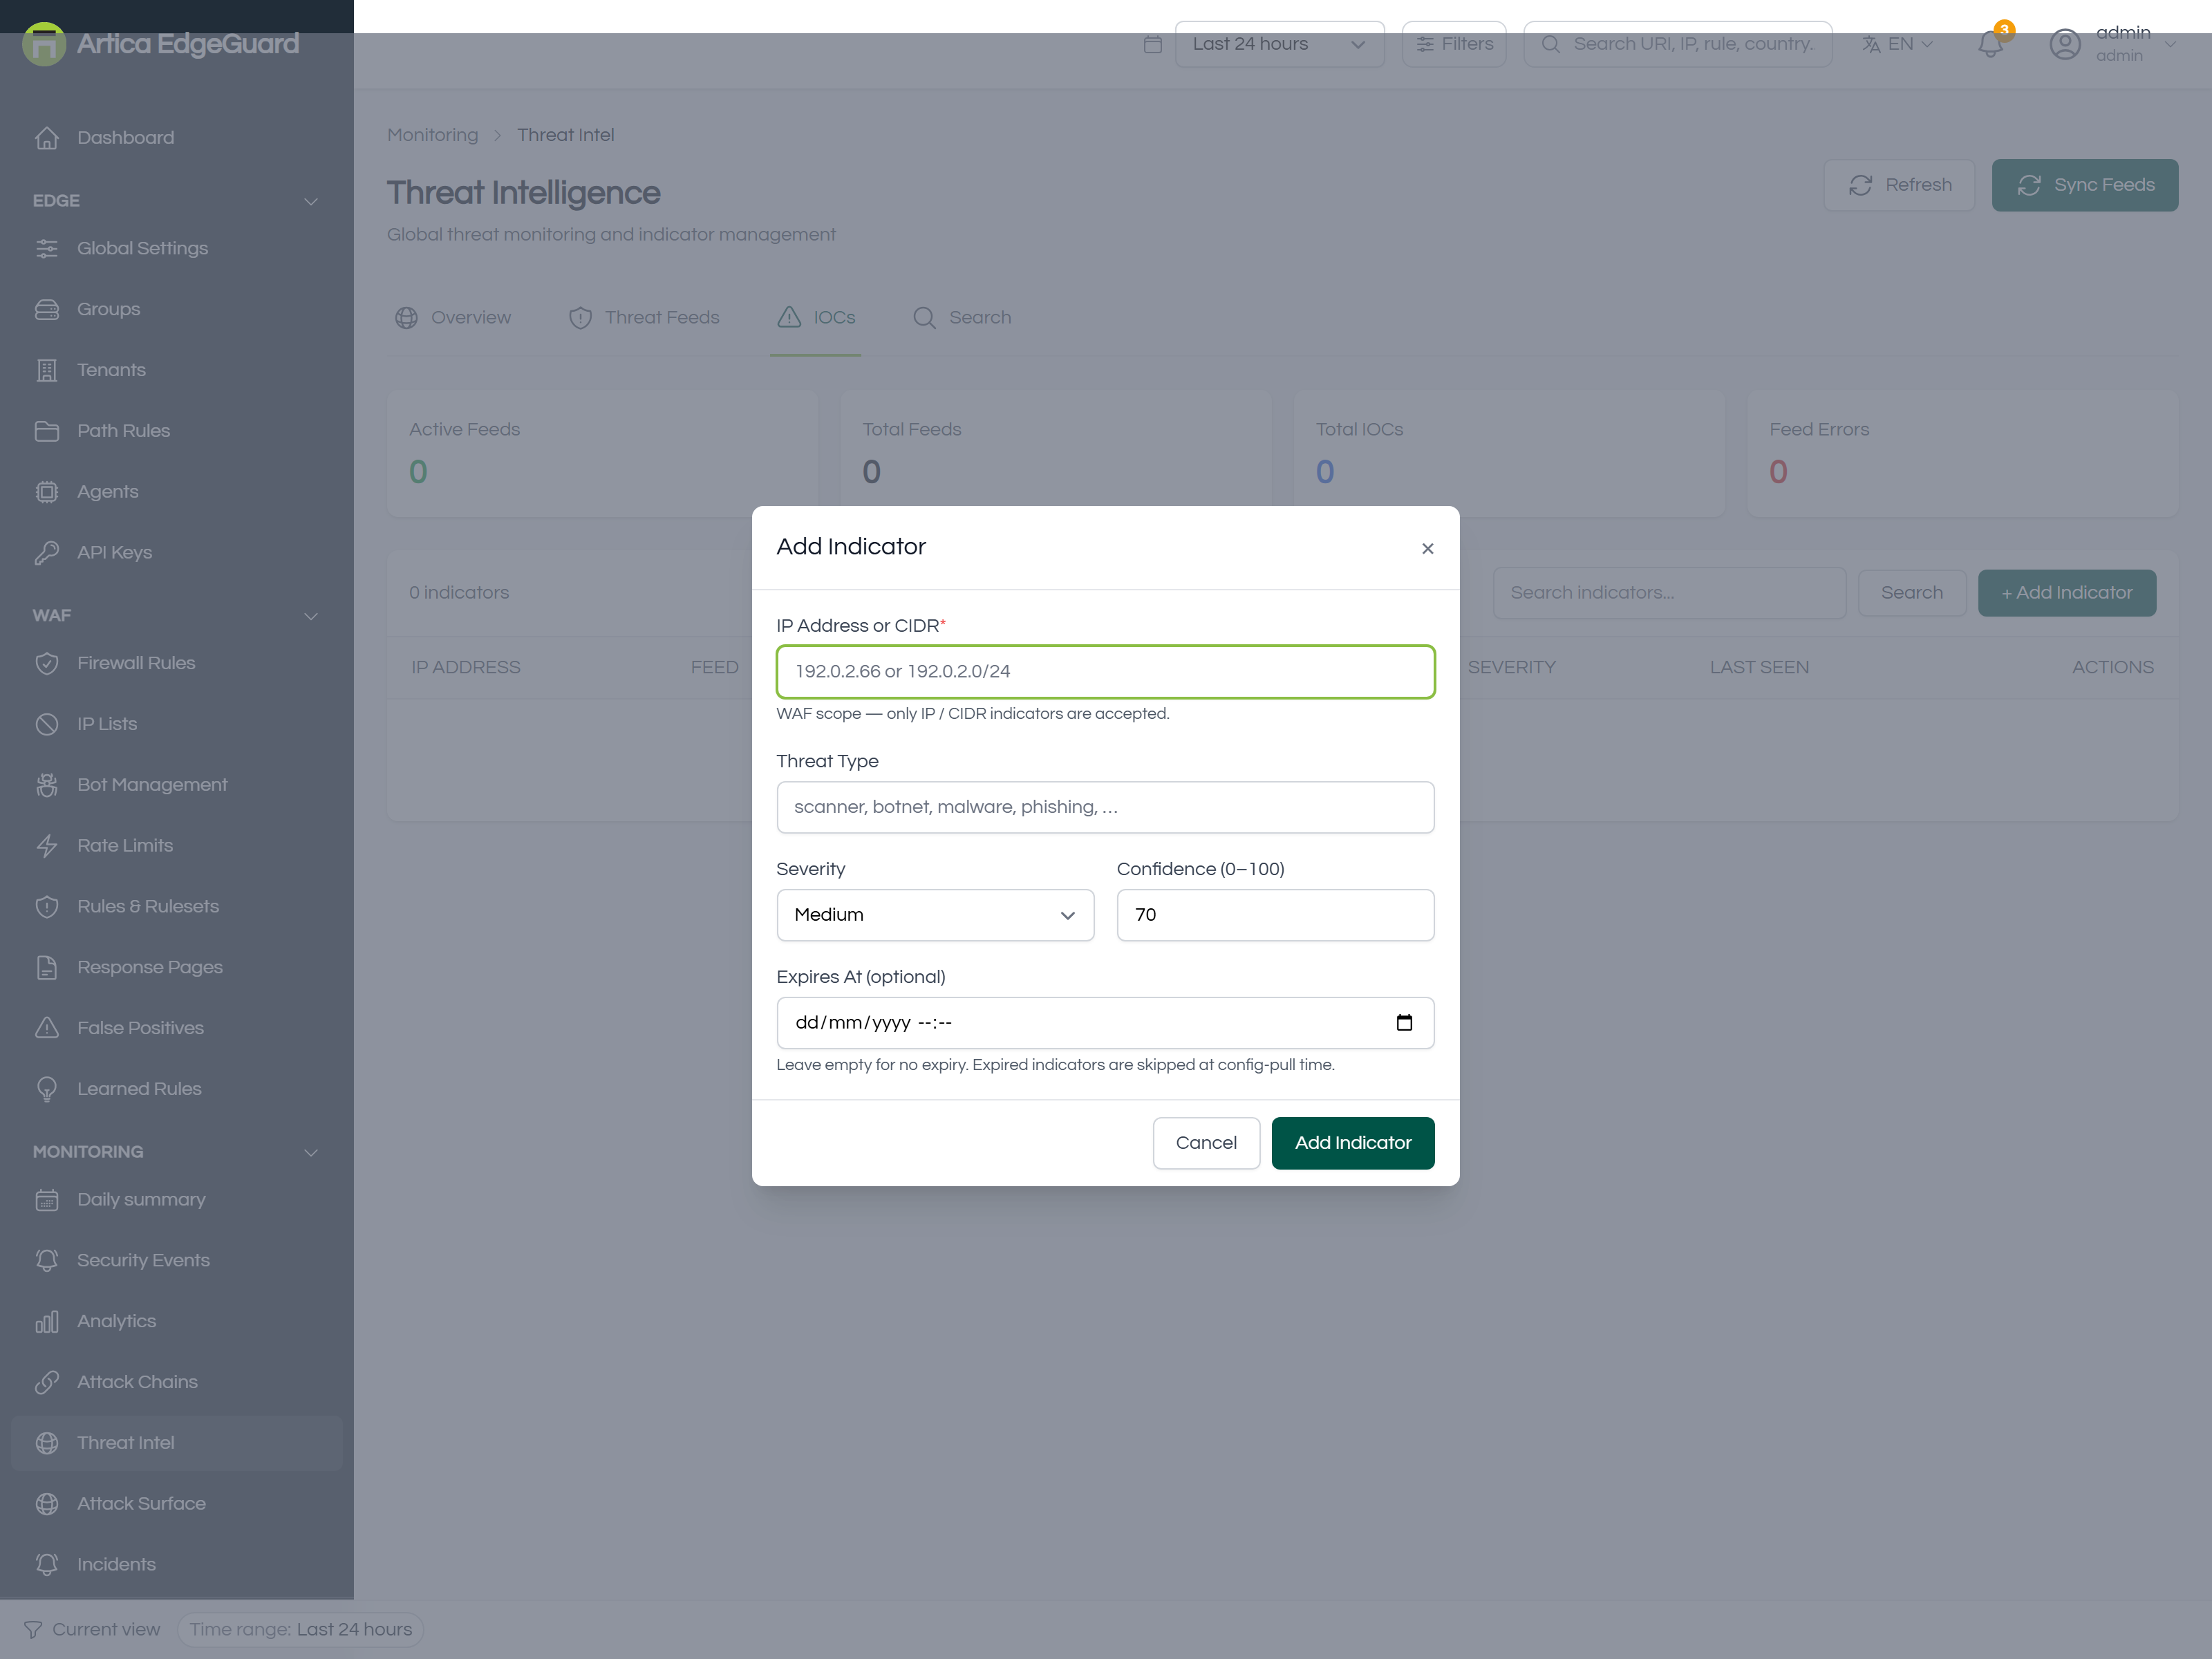
Full documentation: EdgeGuard — Threat Intelligence
¶ Attack Surface
The endpoints your sites actually serve, discovered from live traffic — what is exposed, what takes credentials, and what is worth reviewing first.
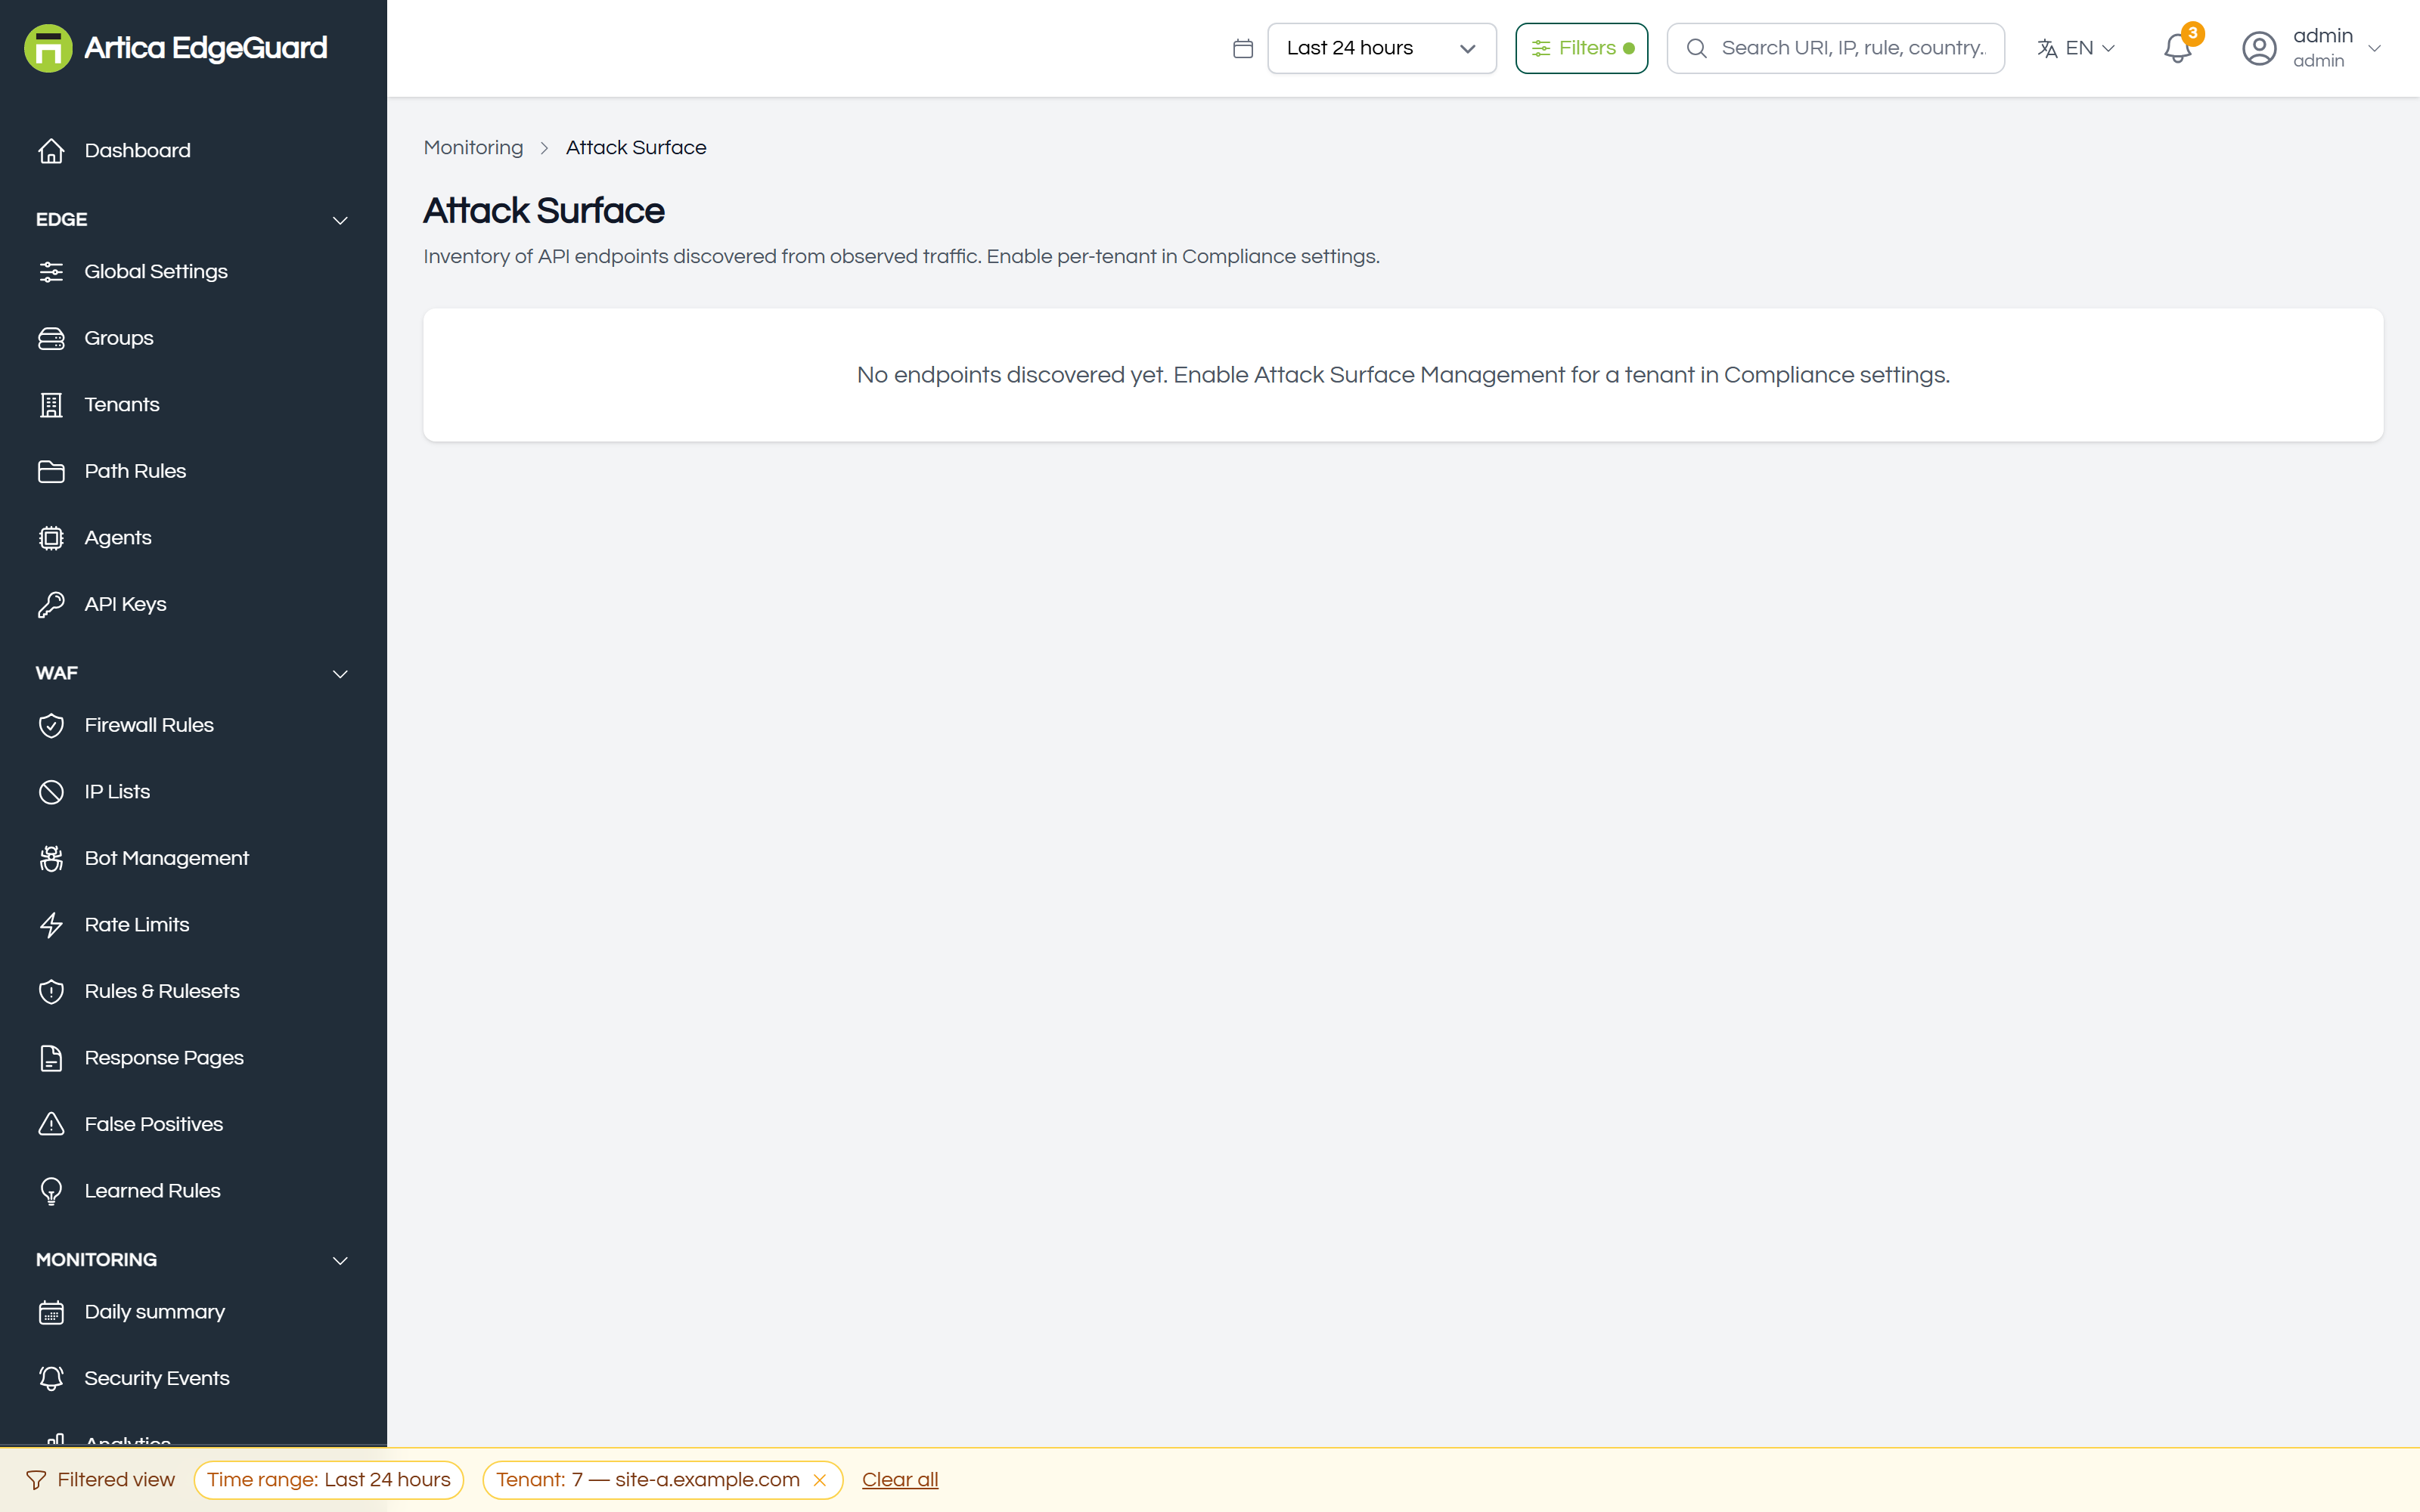
Full documentation: EdgeGuard — Attack Surface
¶ Incidents
Automatic case files for high-severity attacks: one attacker, one site, everything they tried while somebody could still have been watching.
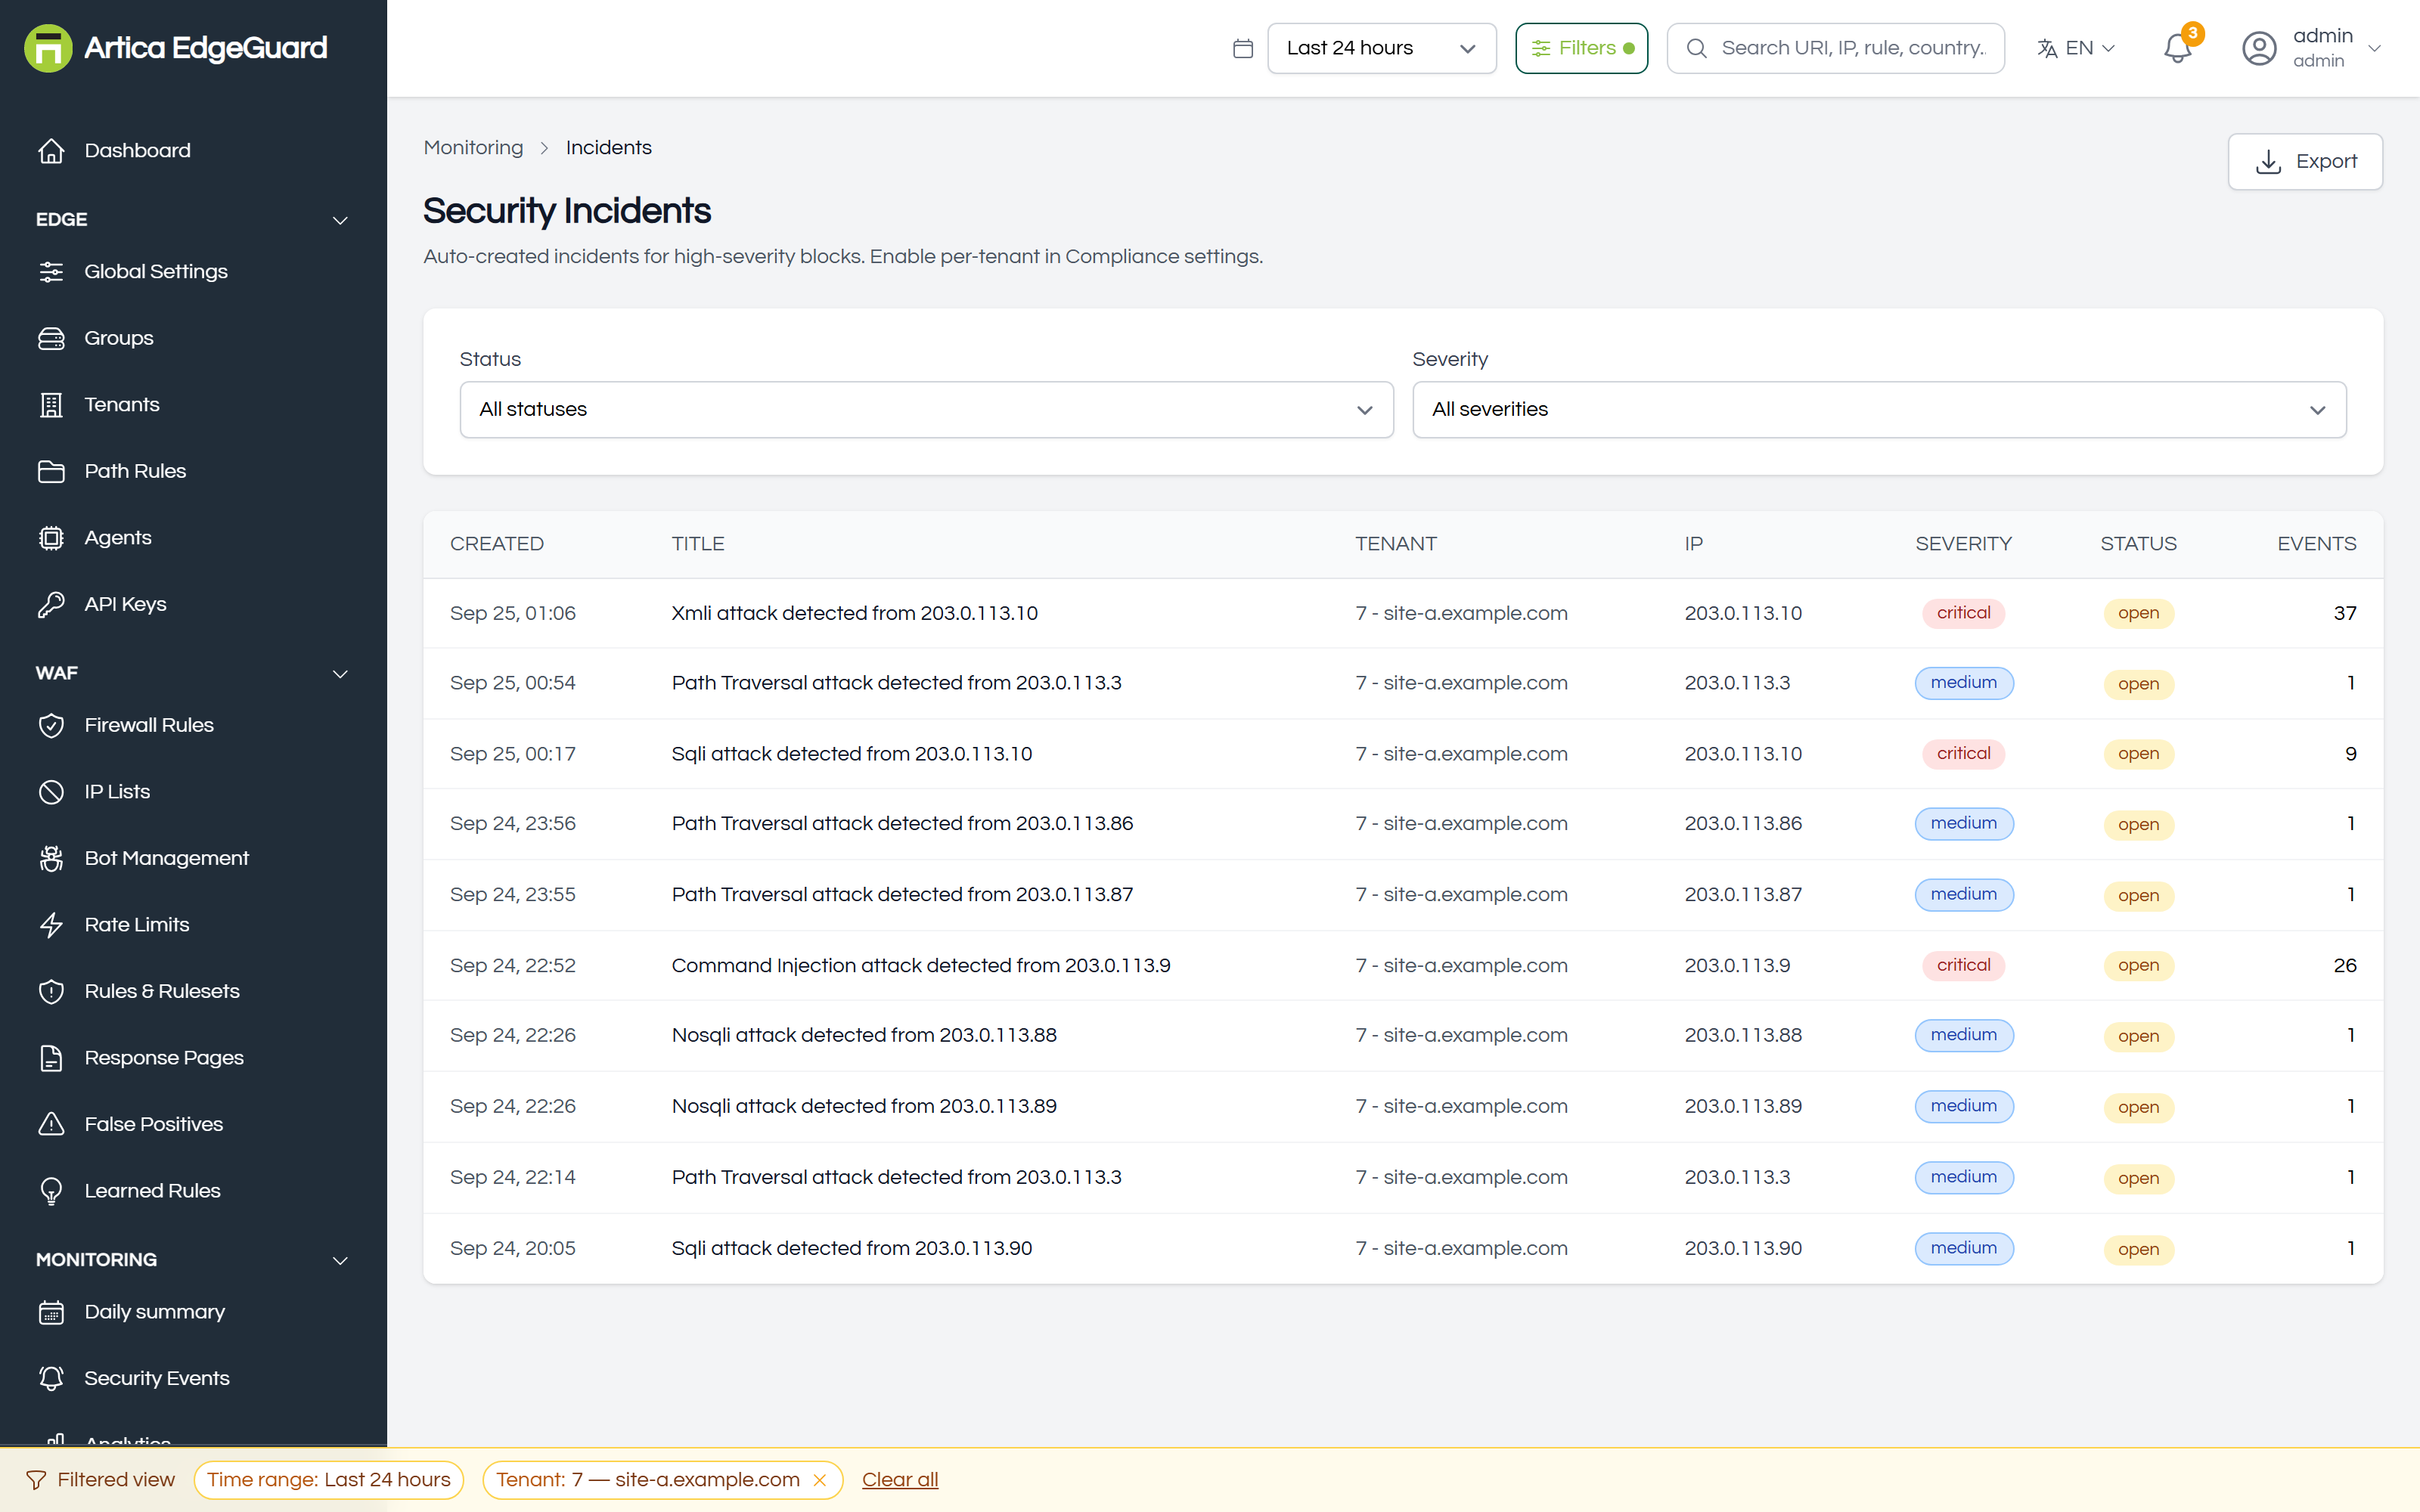
Full documentation: EdgeGuard — Incidents
¶ Contained IPs
Addresses blocked automatically by incident response, and the place to release one before its containment expires. The block itself lives in the agent memory with a deadline, so releasing here sends the agents a command rather than only deleting a row.
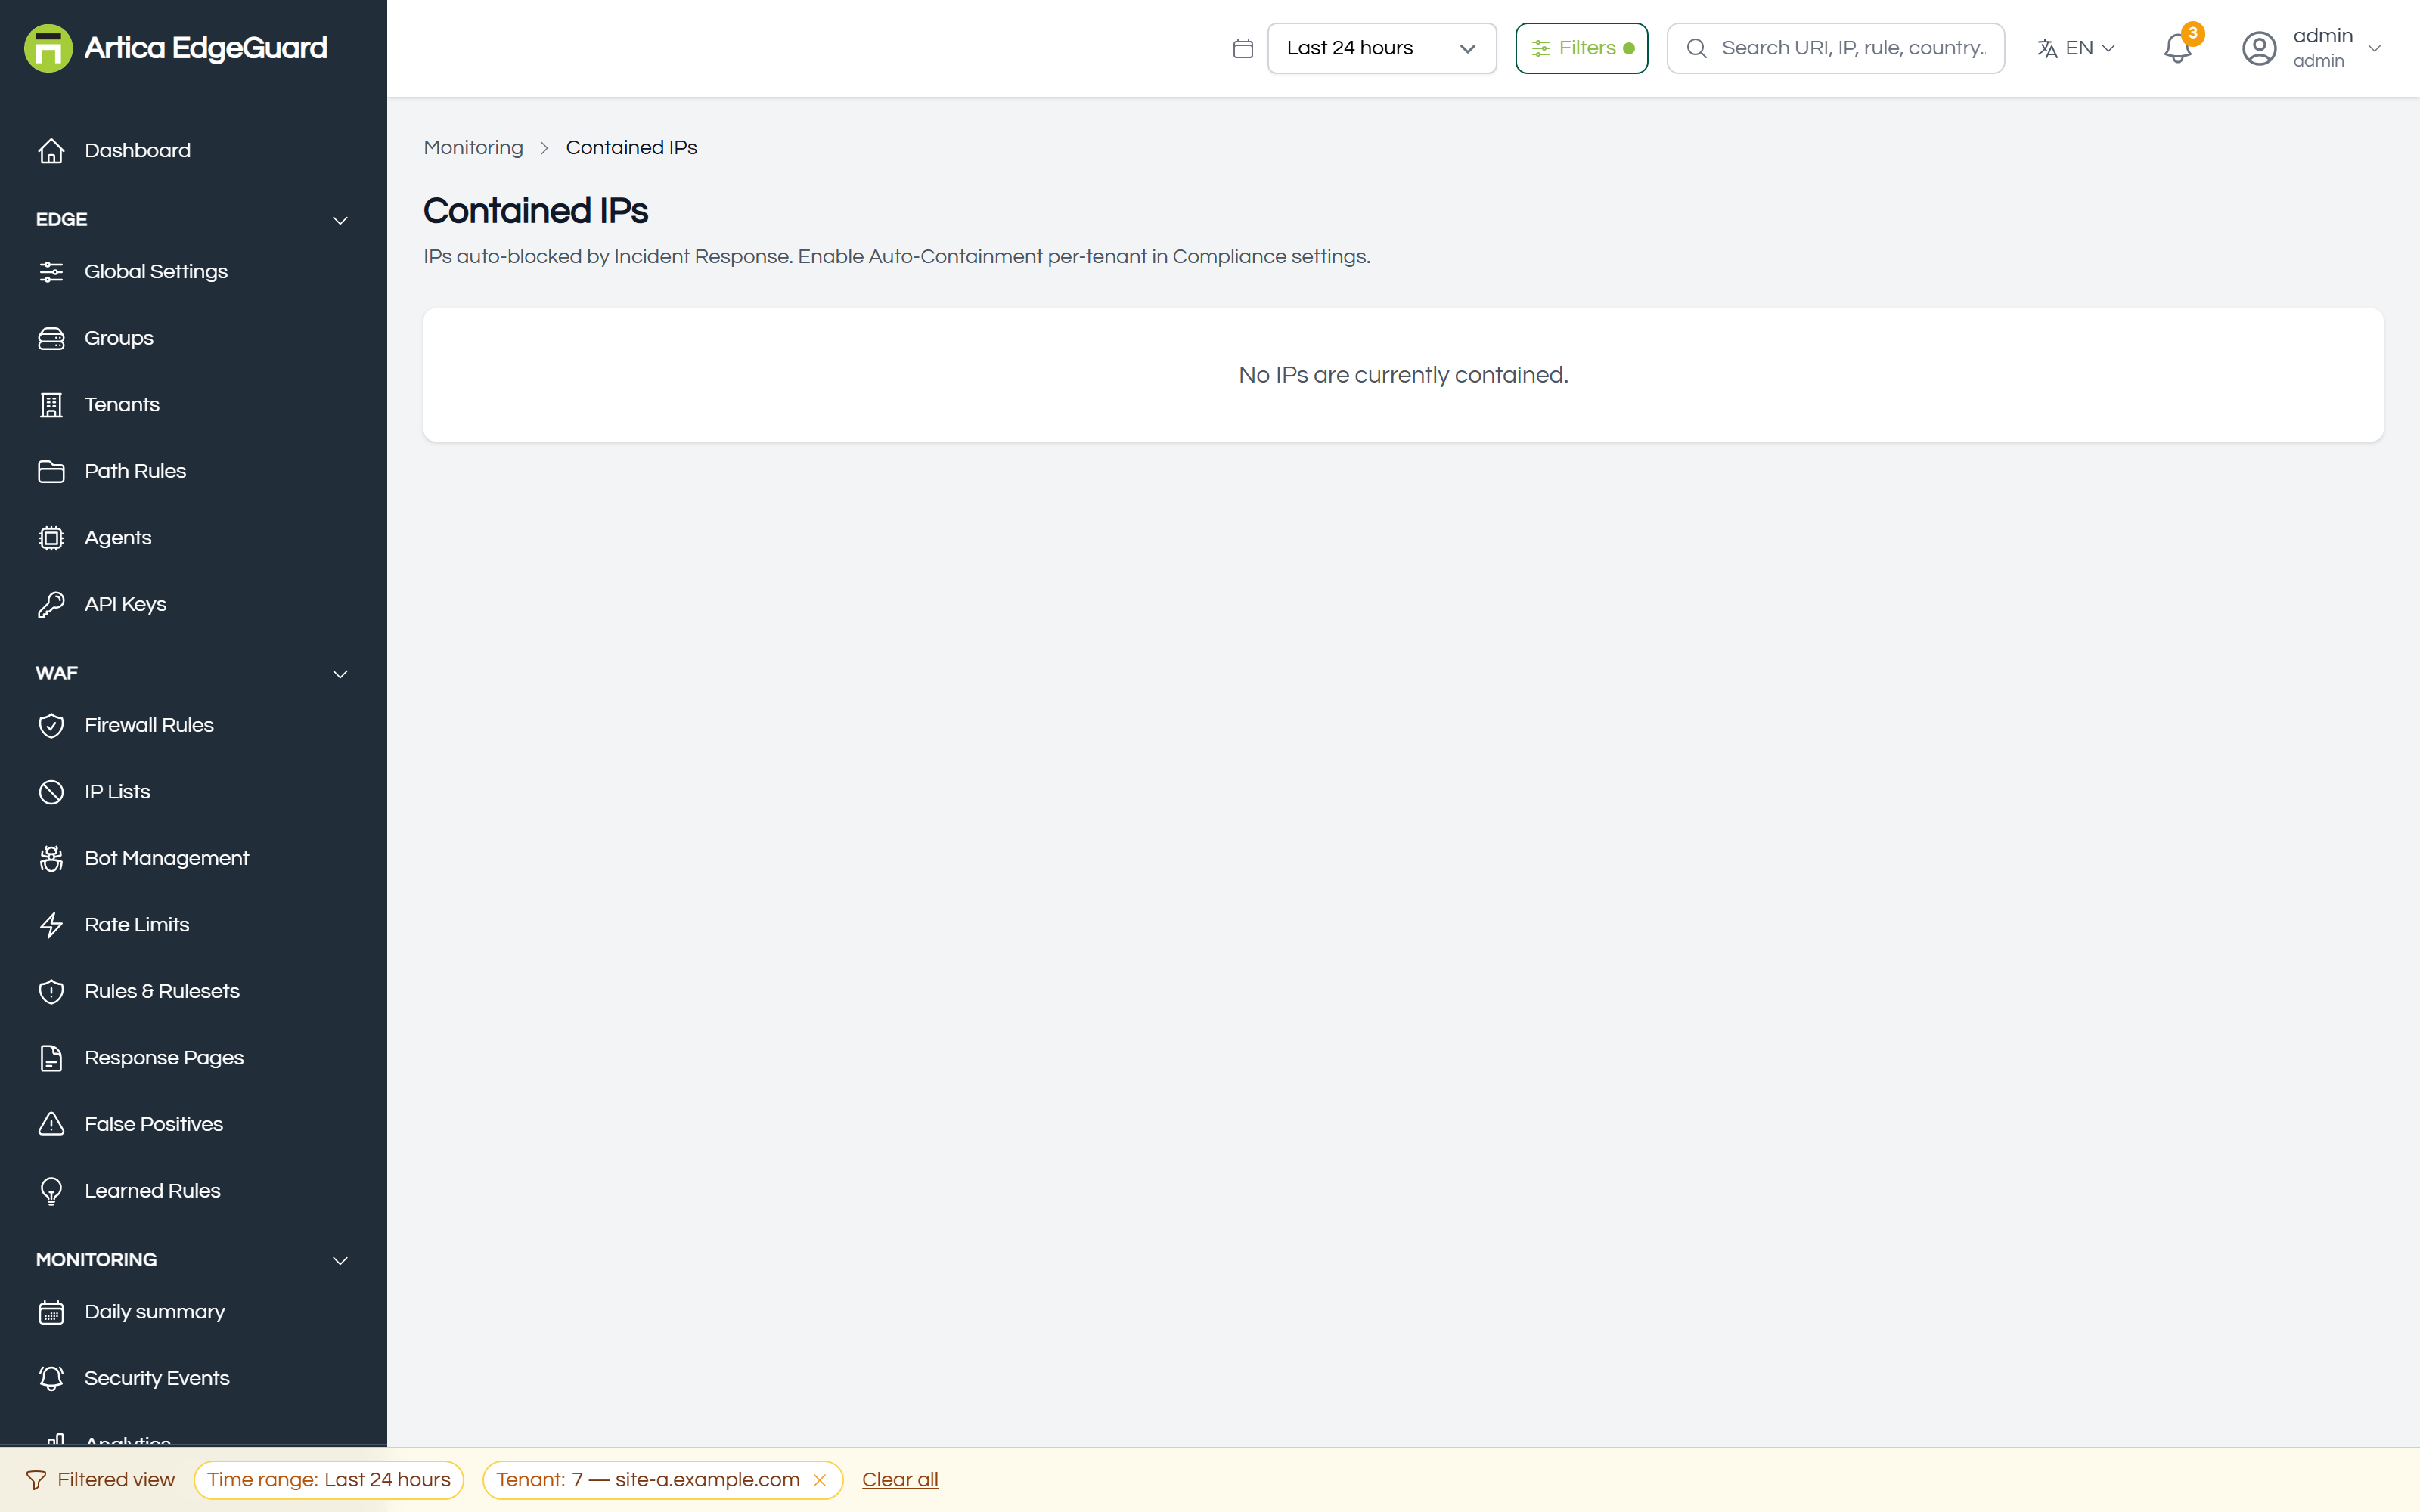
Full documentation: EdgeGuard — Contained IPs
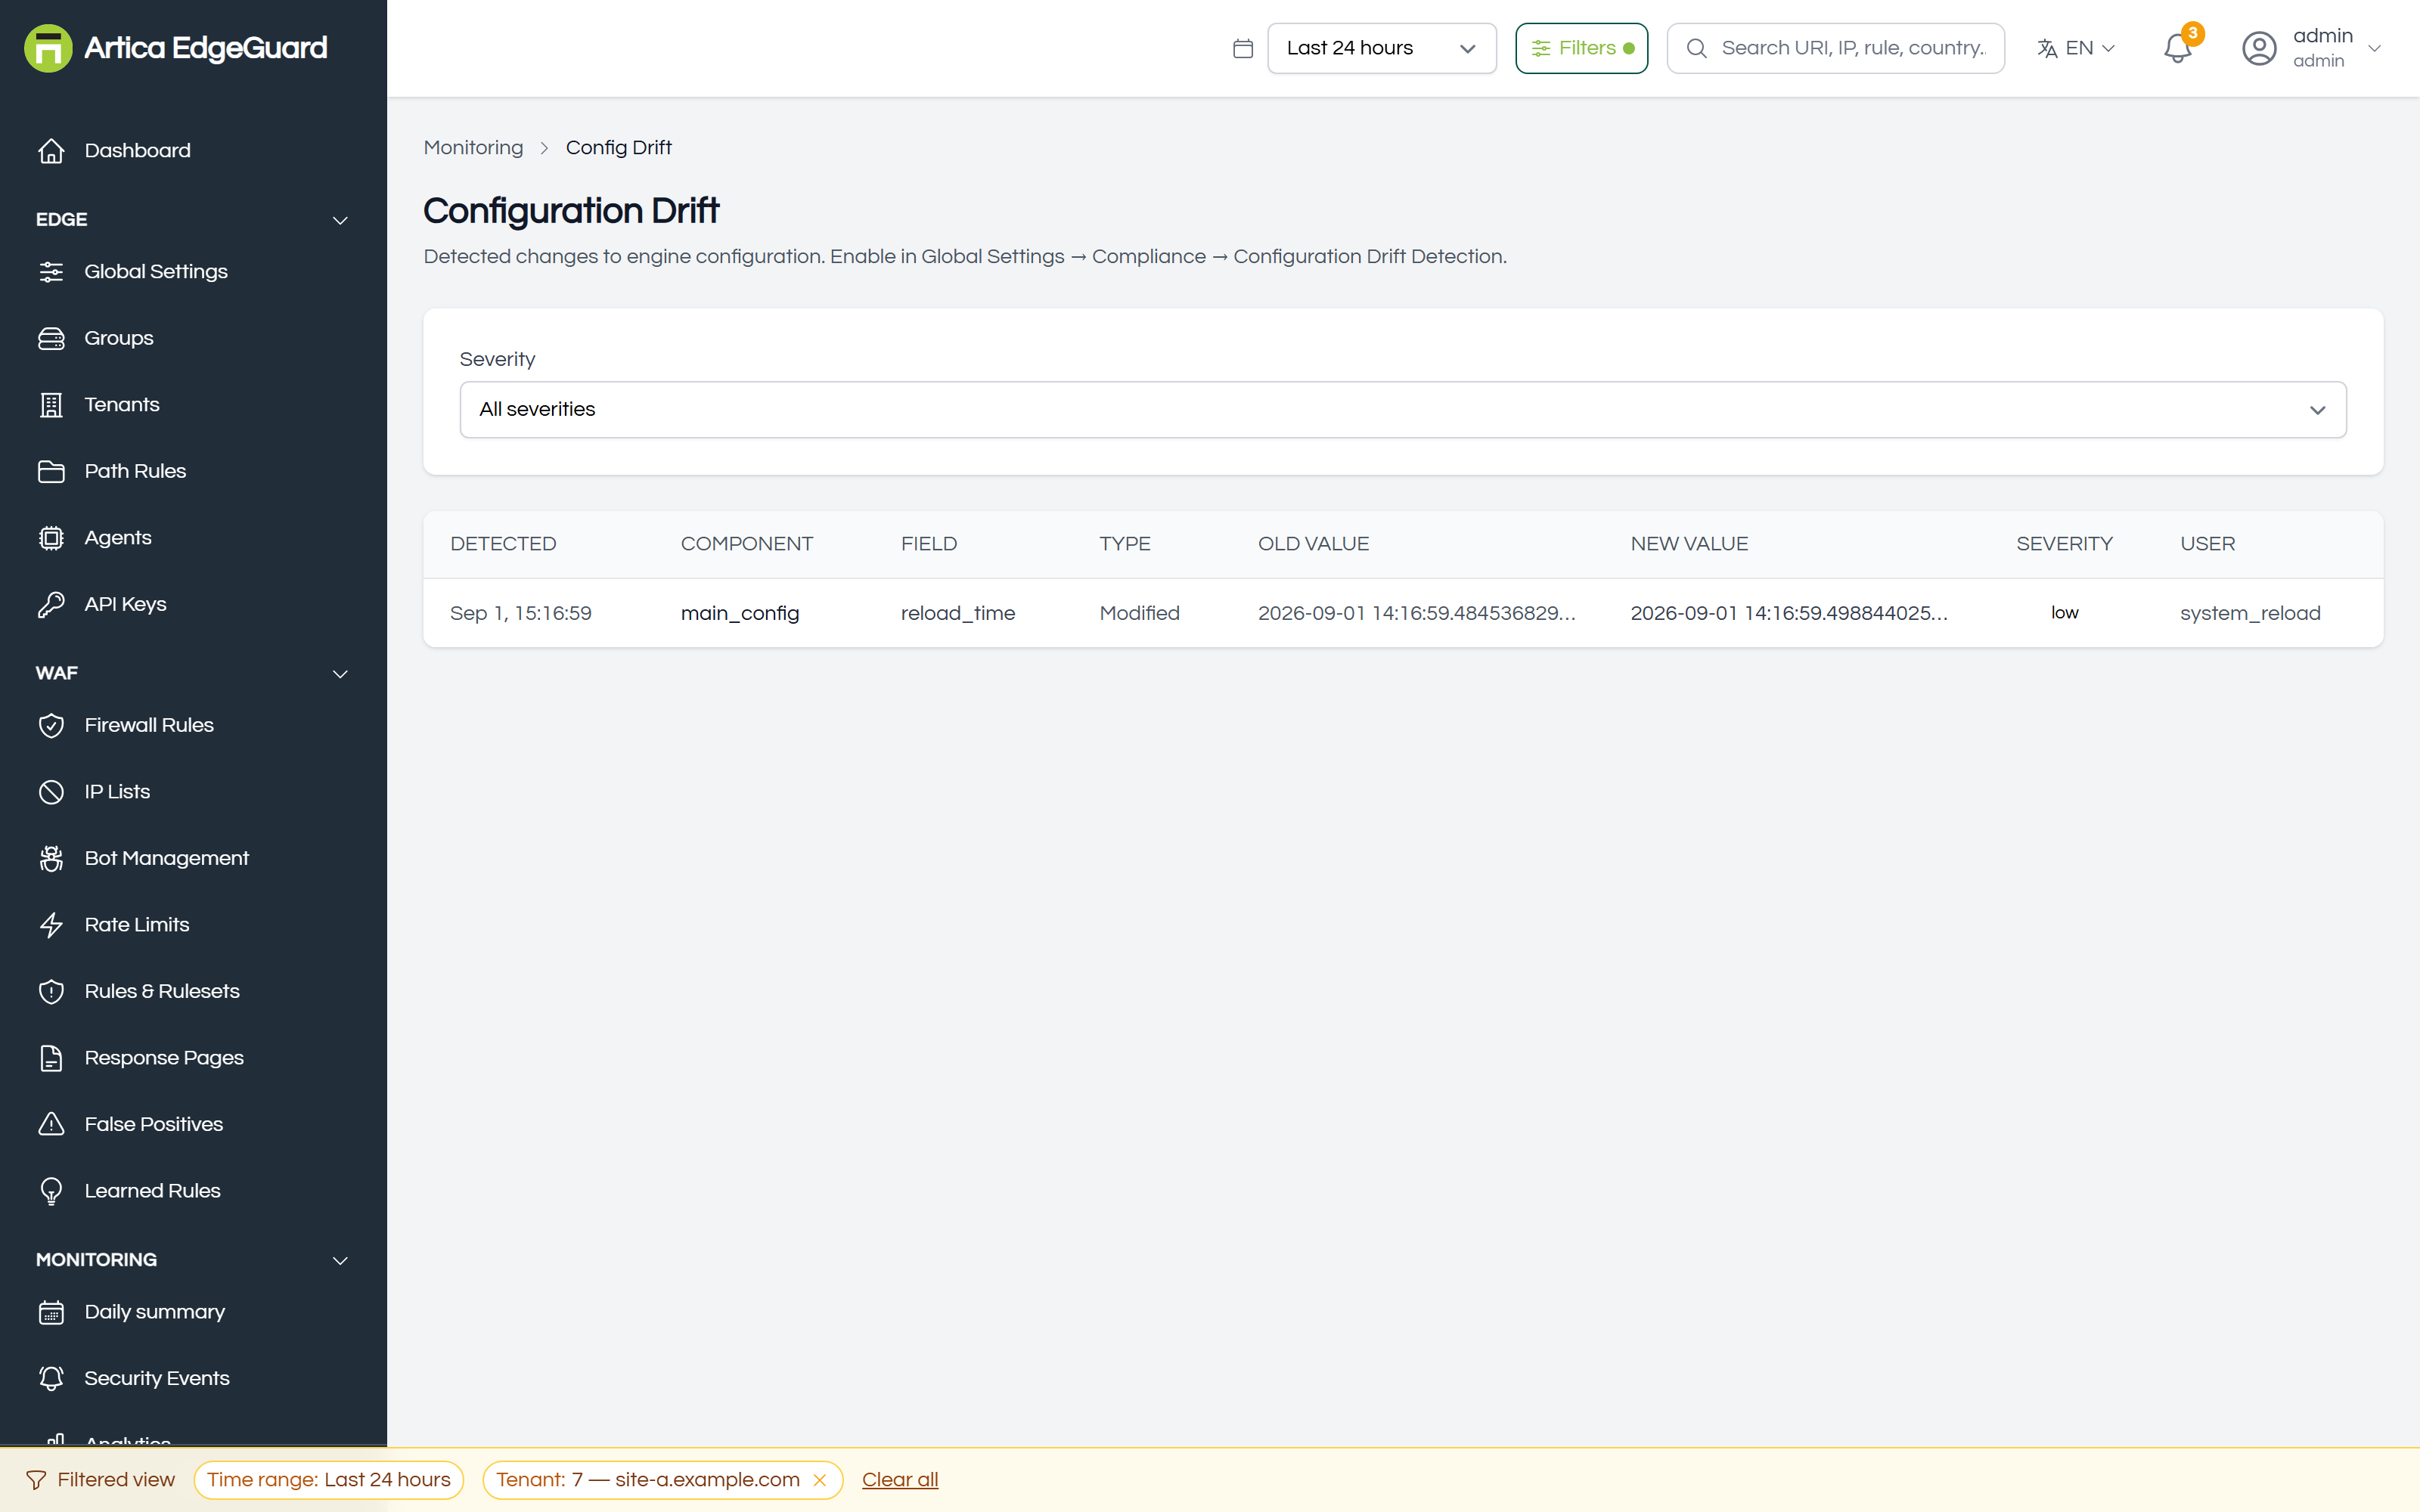
¶ Configuration Drift
Whether an agent still runs the configuration it was given, or whether somebody changed it on the machine.
Full documentation: EdgeGuard — Configuration Drift
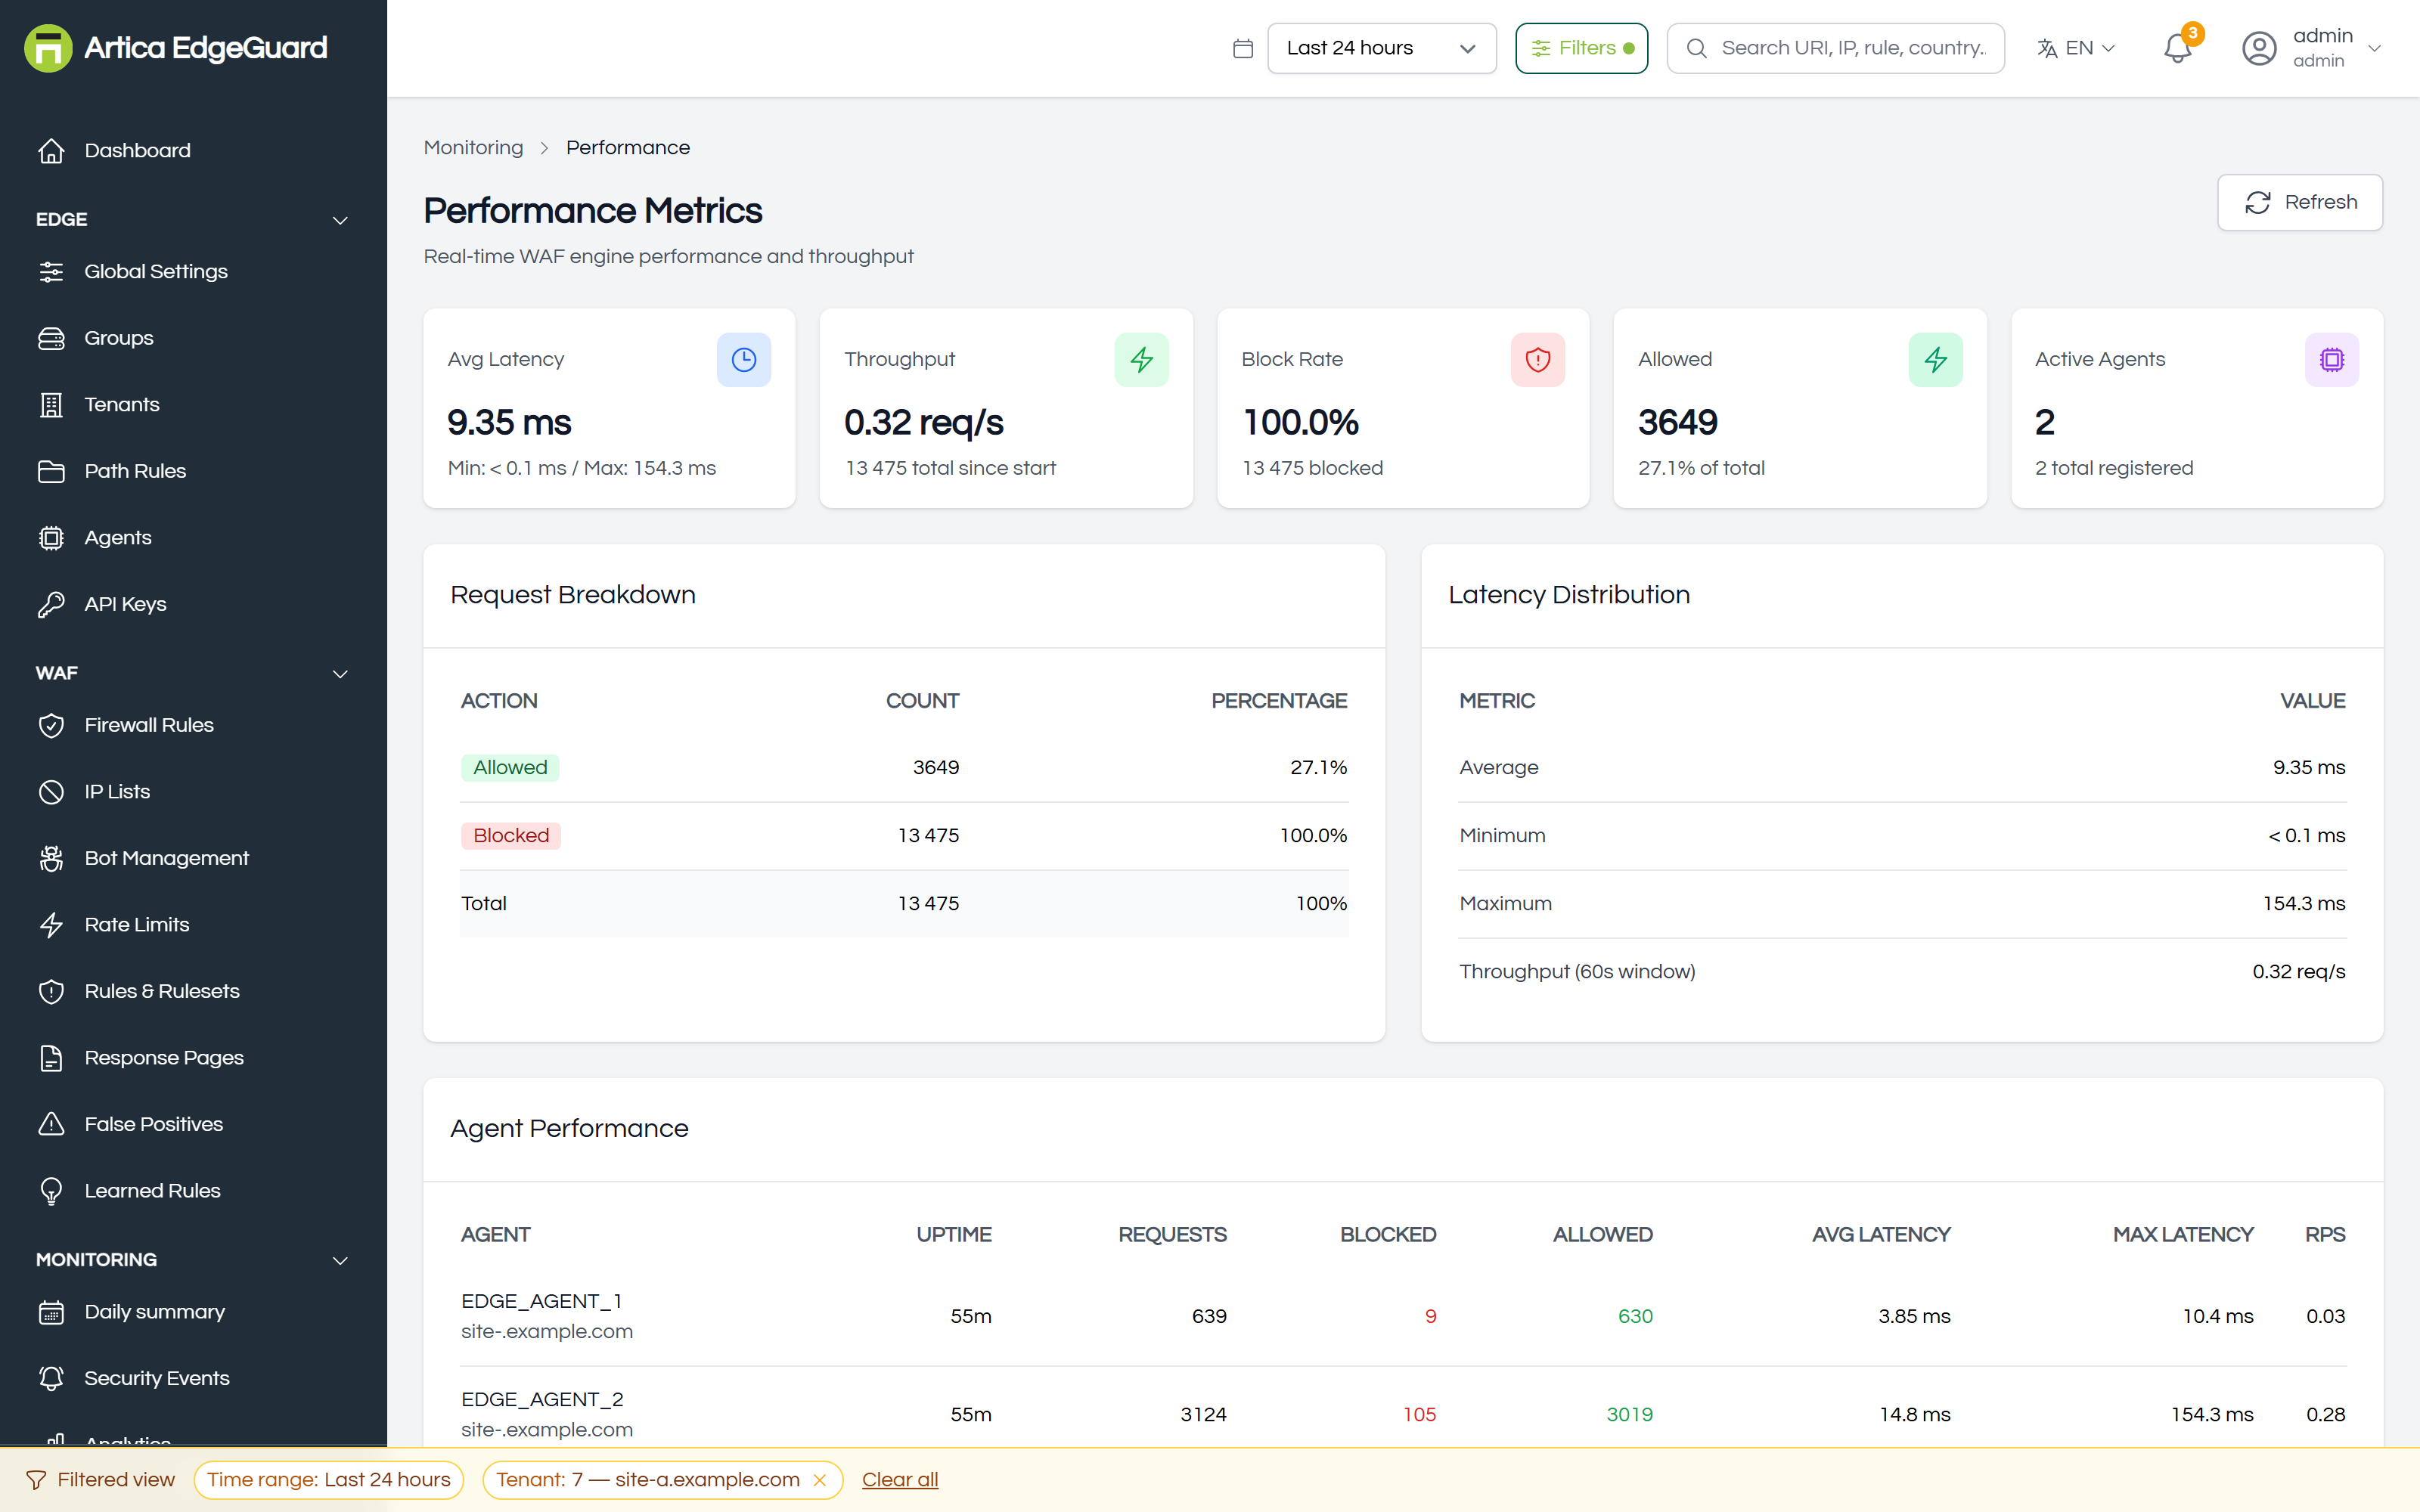
¶ Performance
What EdgeGuard costs in latency and how much it is handling — the answer, with a number, to "is the WAF making the site slow?".
Full documentation: EdgeGuard — Performance
¶ Audit & Logs
The record of what people did, and where it is sent.
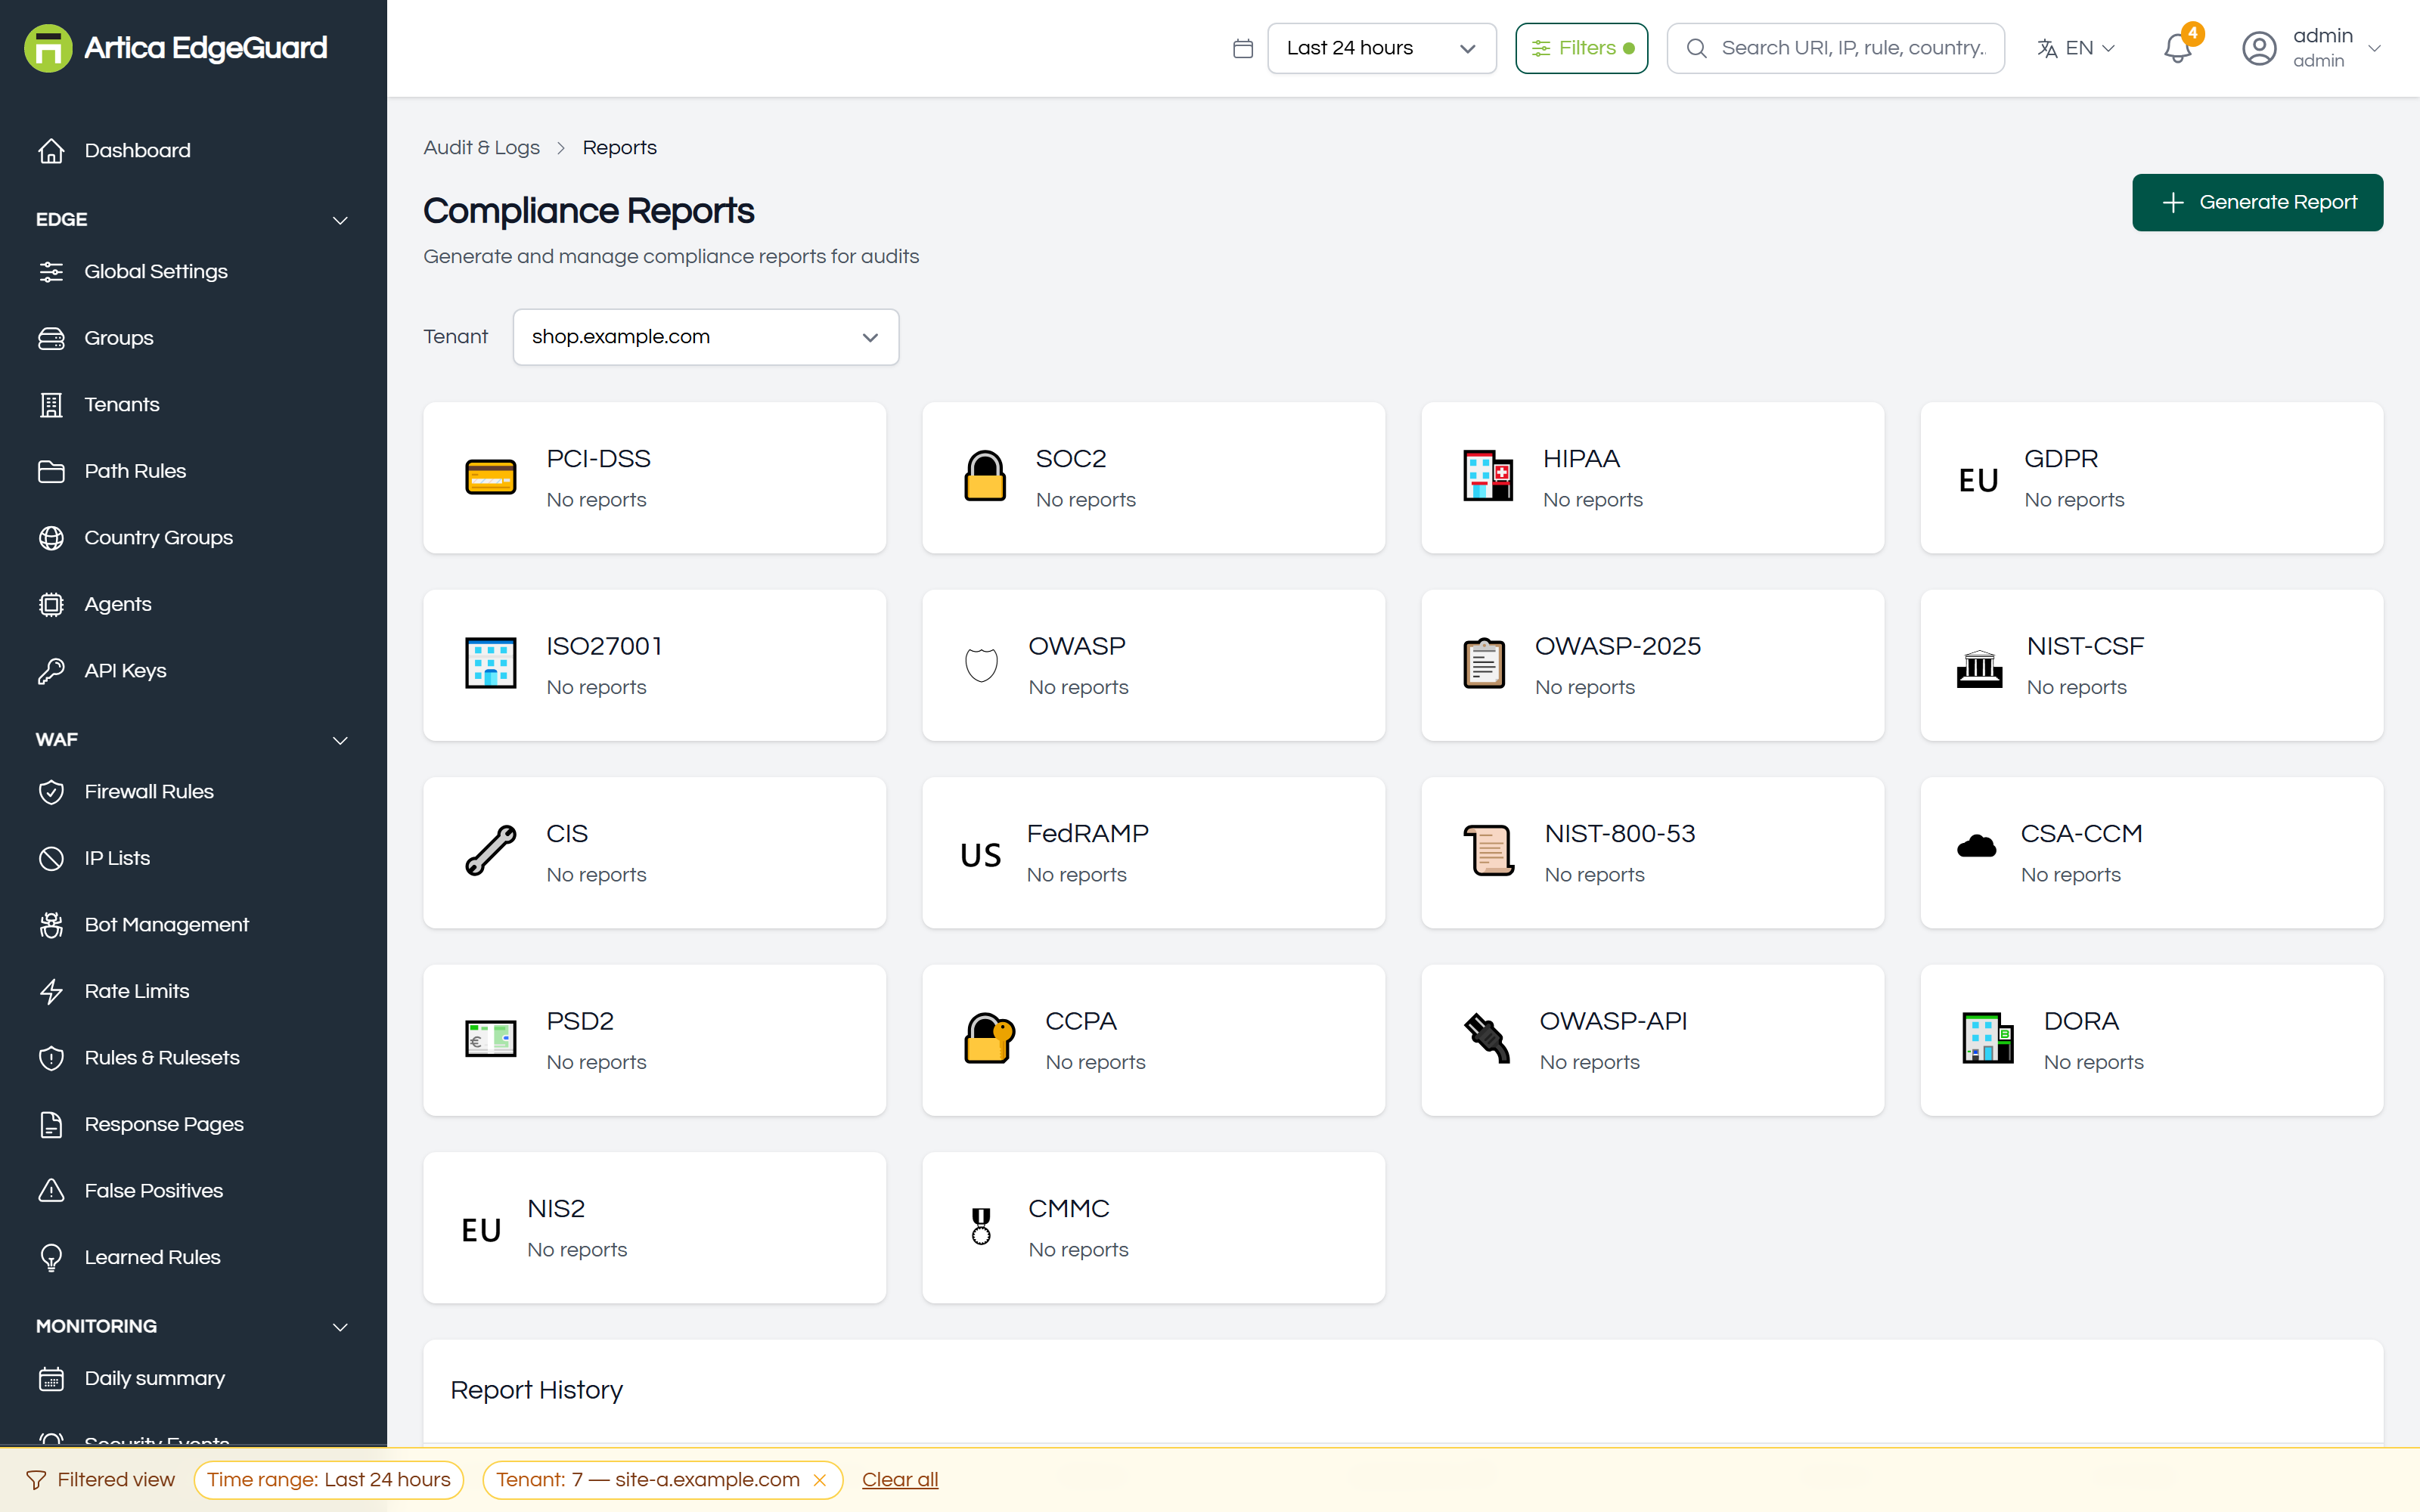
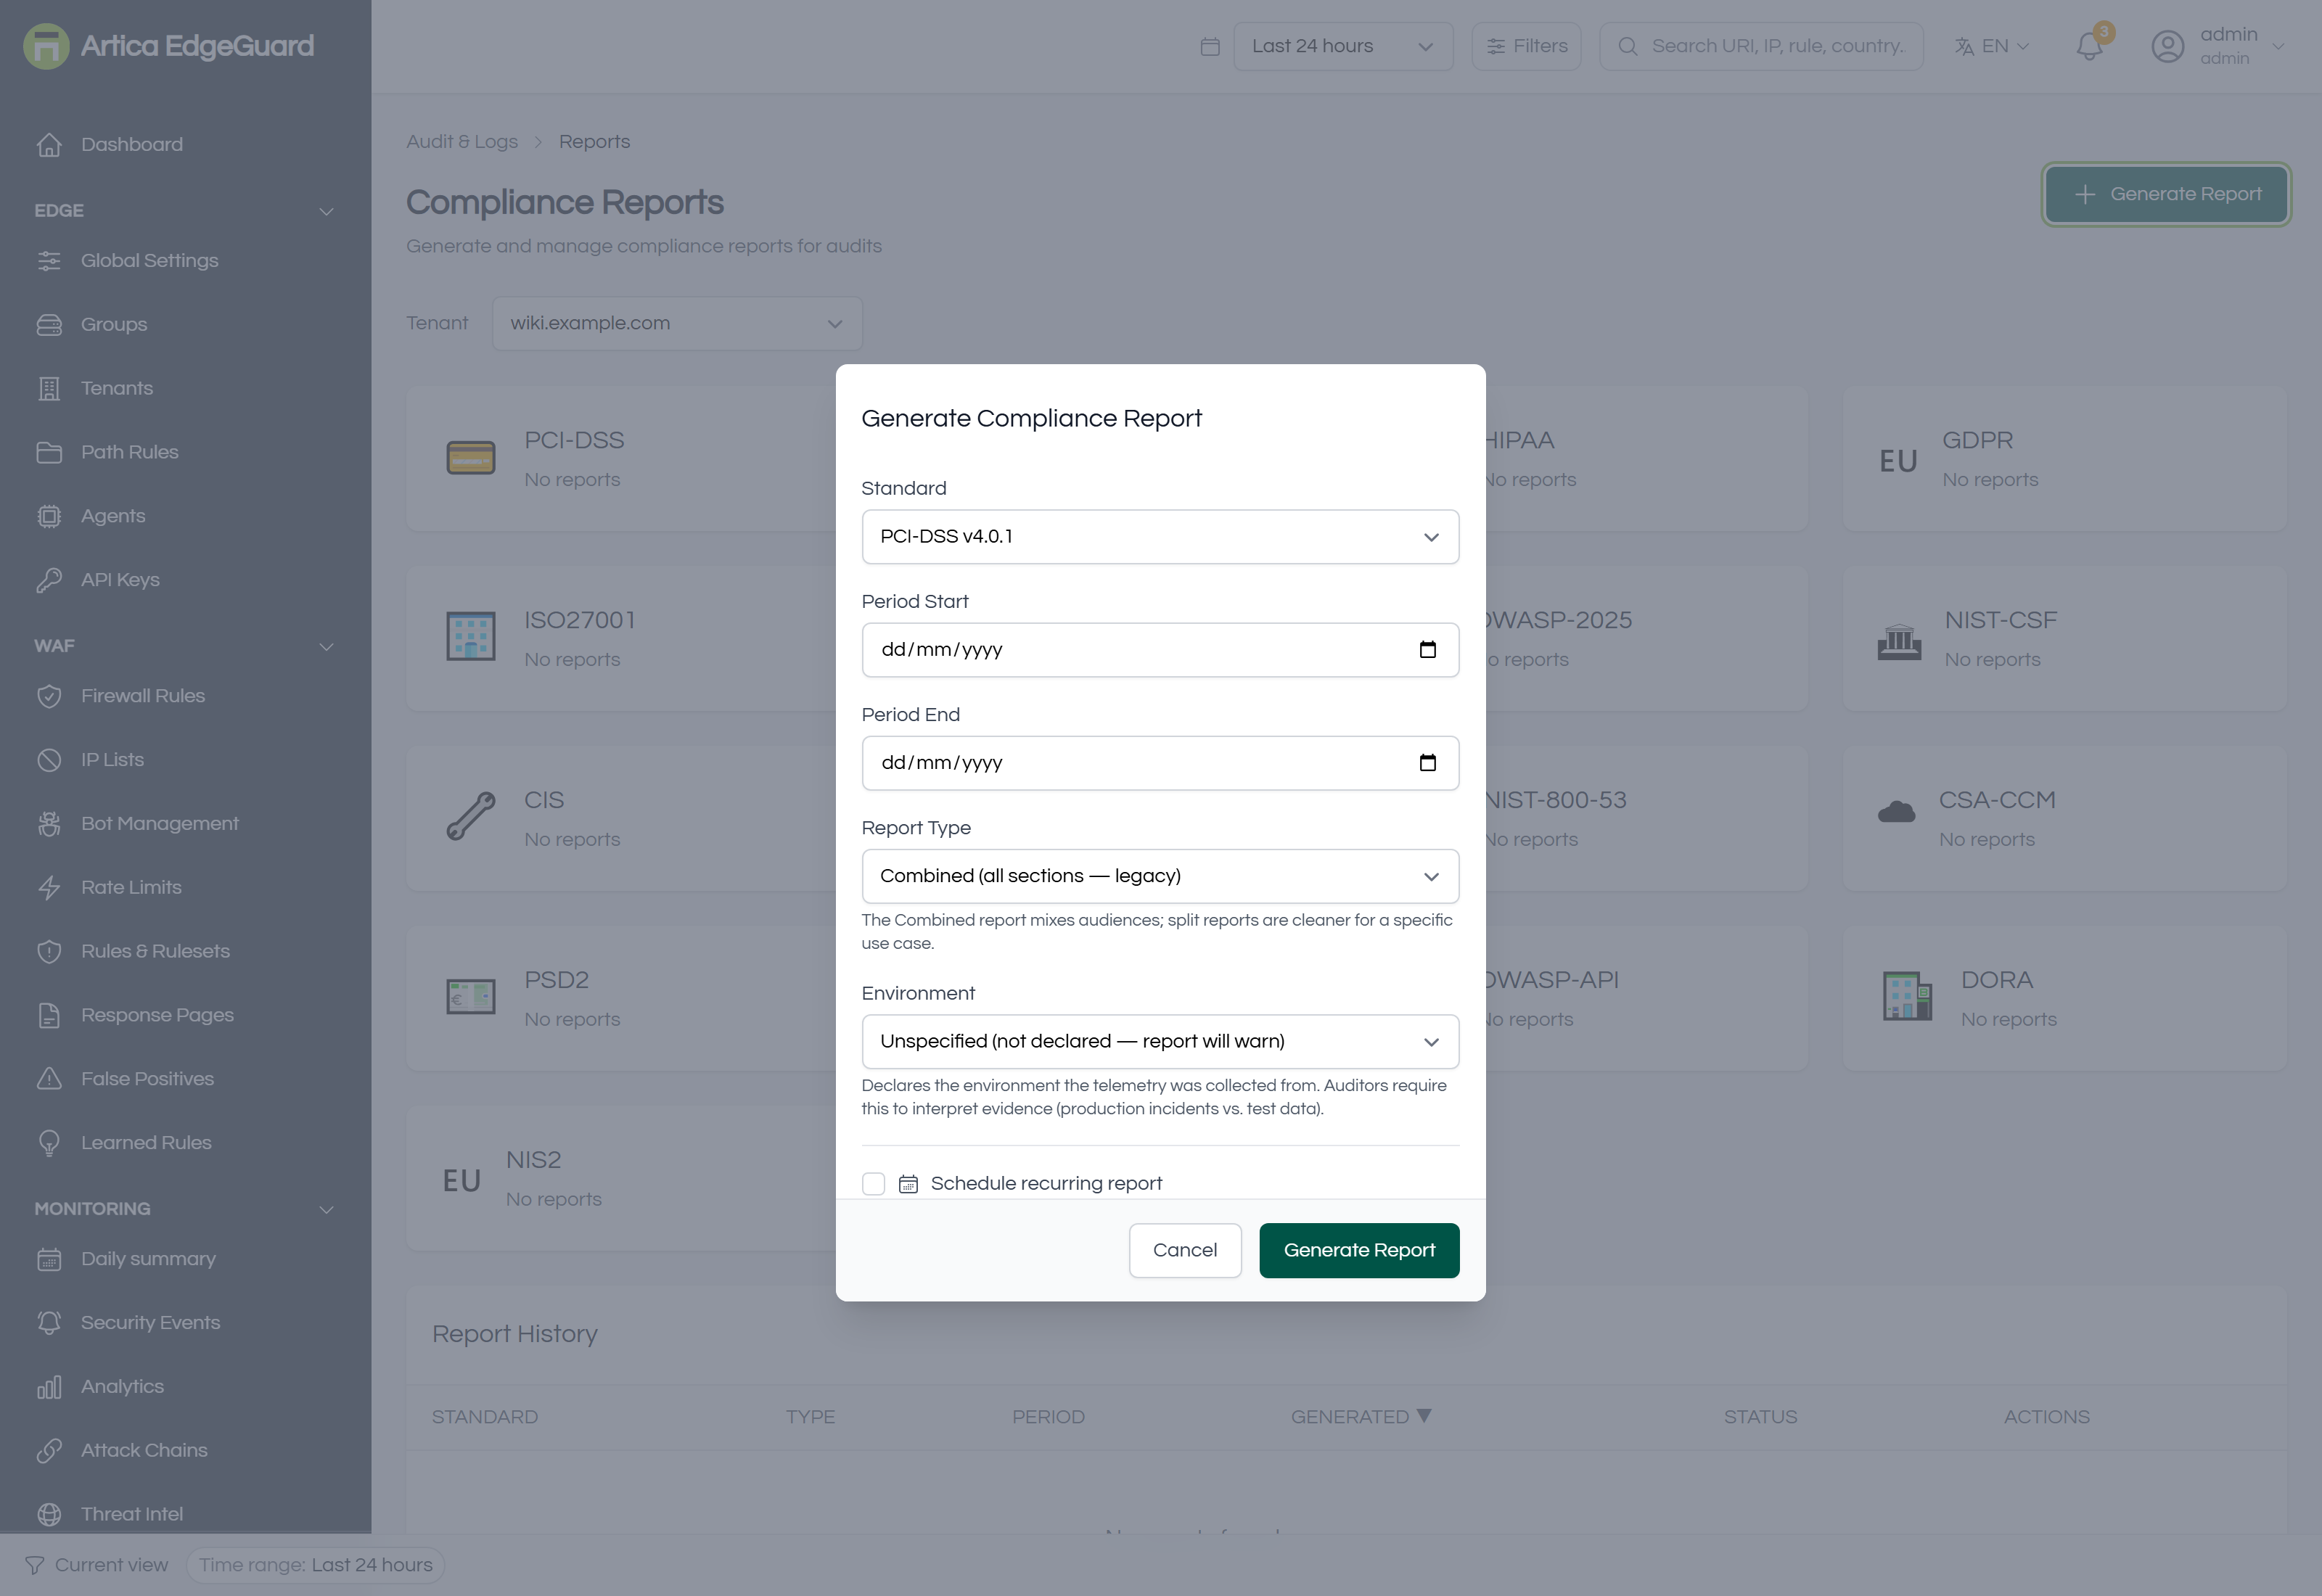
¶ Reports
Compliance reports for fourteen standards — PCI-DSS, SOC 2, HIPAA, GDPR and the rest — generated on demand or on a schedule, downloadable as PDF, HTML or CSV, and kept so an auditor can be handed the one that covers their period.
Full documentation: EdgeGuard — Reports
¶ Audit Log
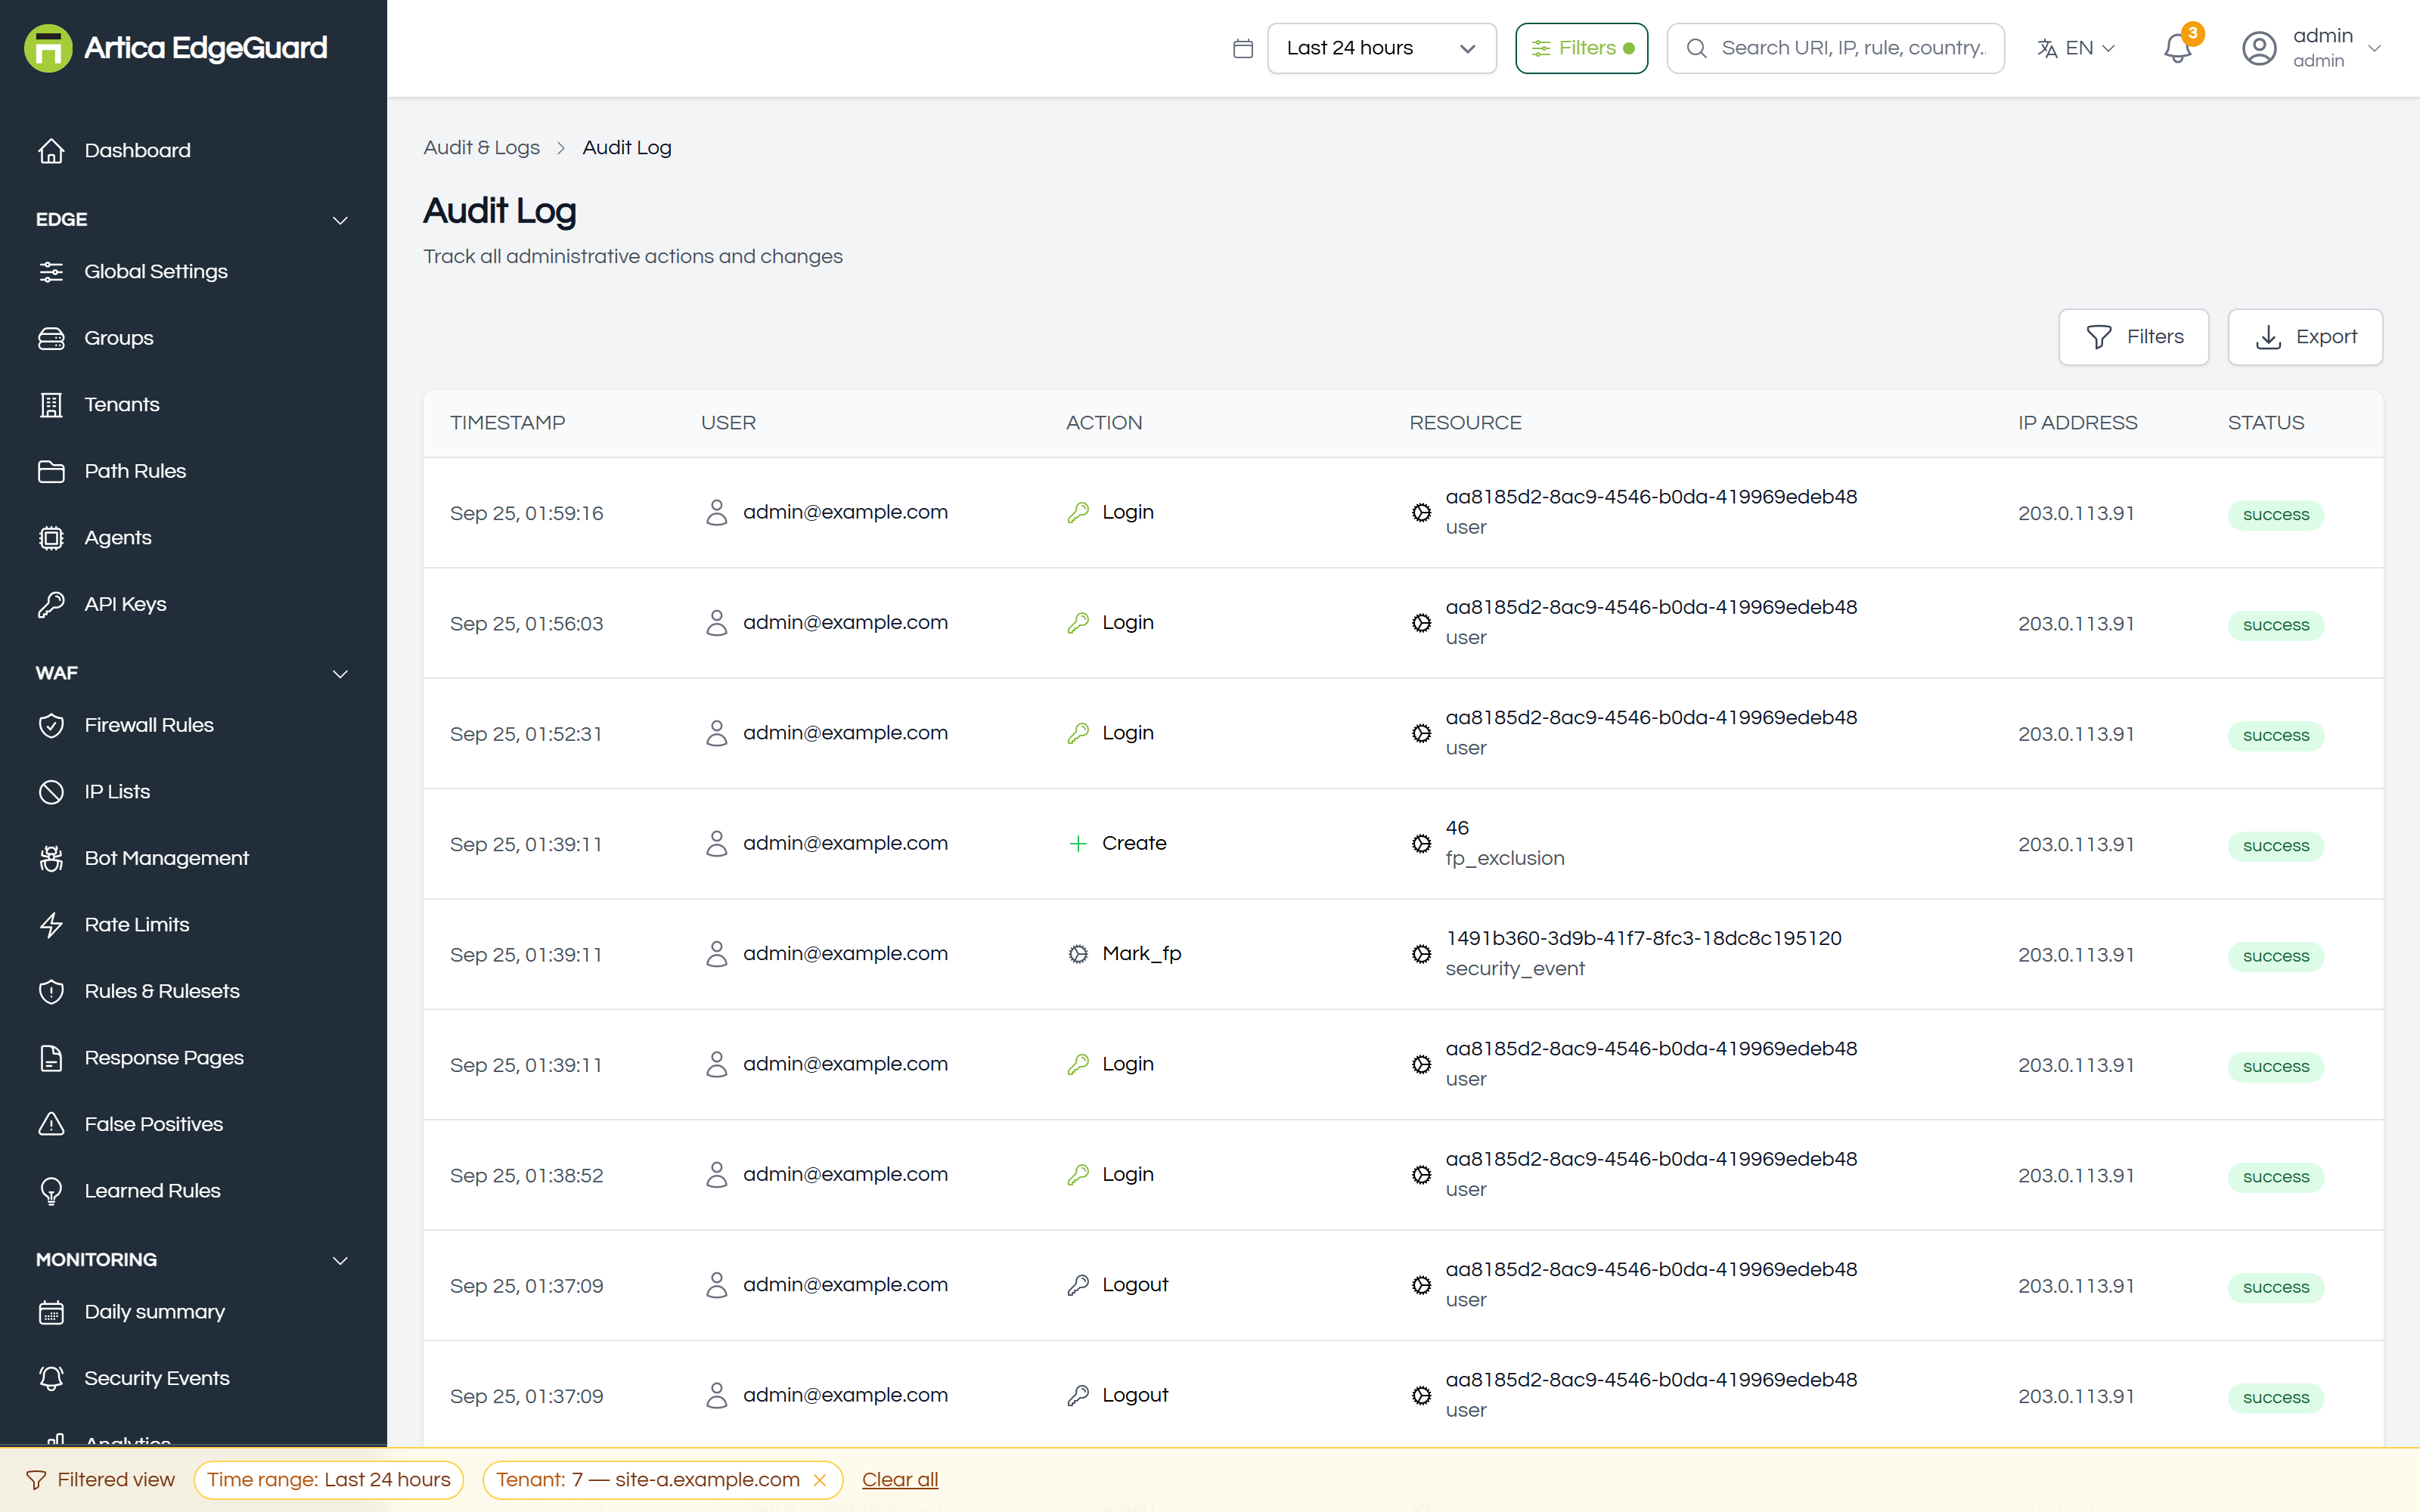
Every administrative action, with who did it and from where. The counterpart to Security Events: that page records traffic, this one records people.
Full documentation: EdgeGuard — Audit Log
¶ Log Connectors
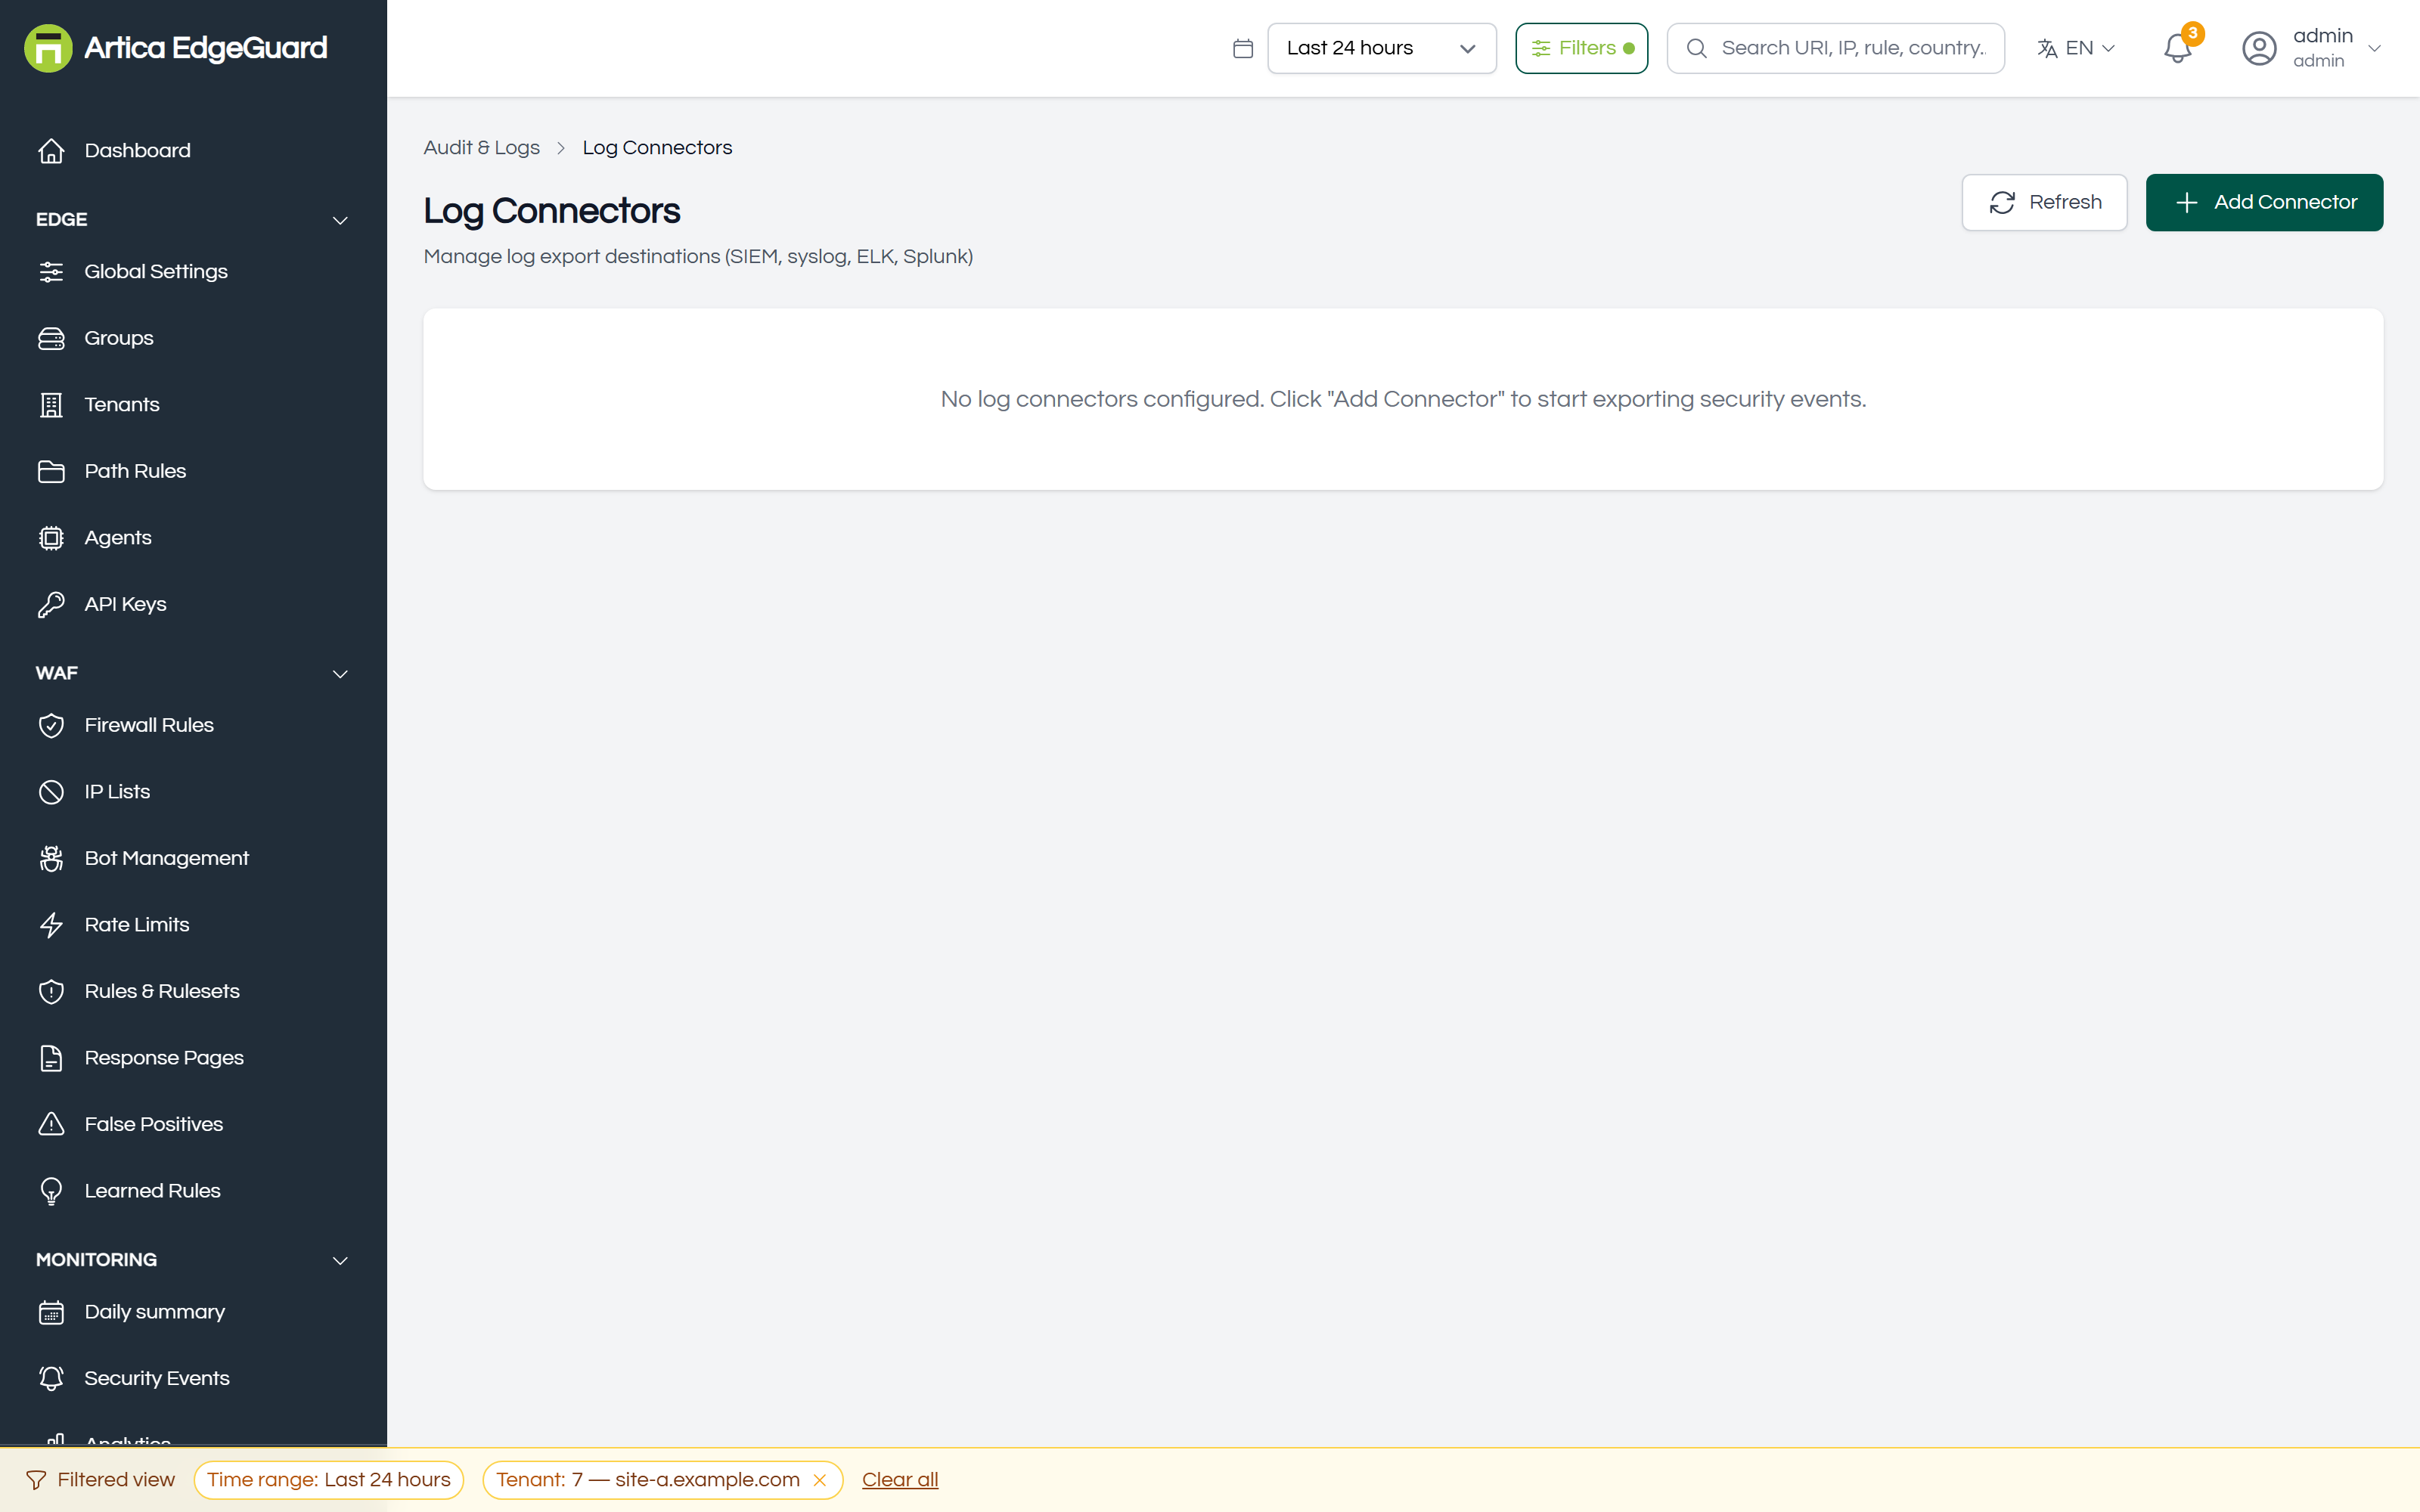
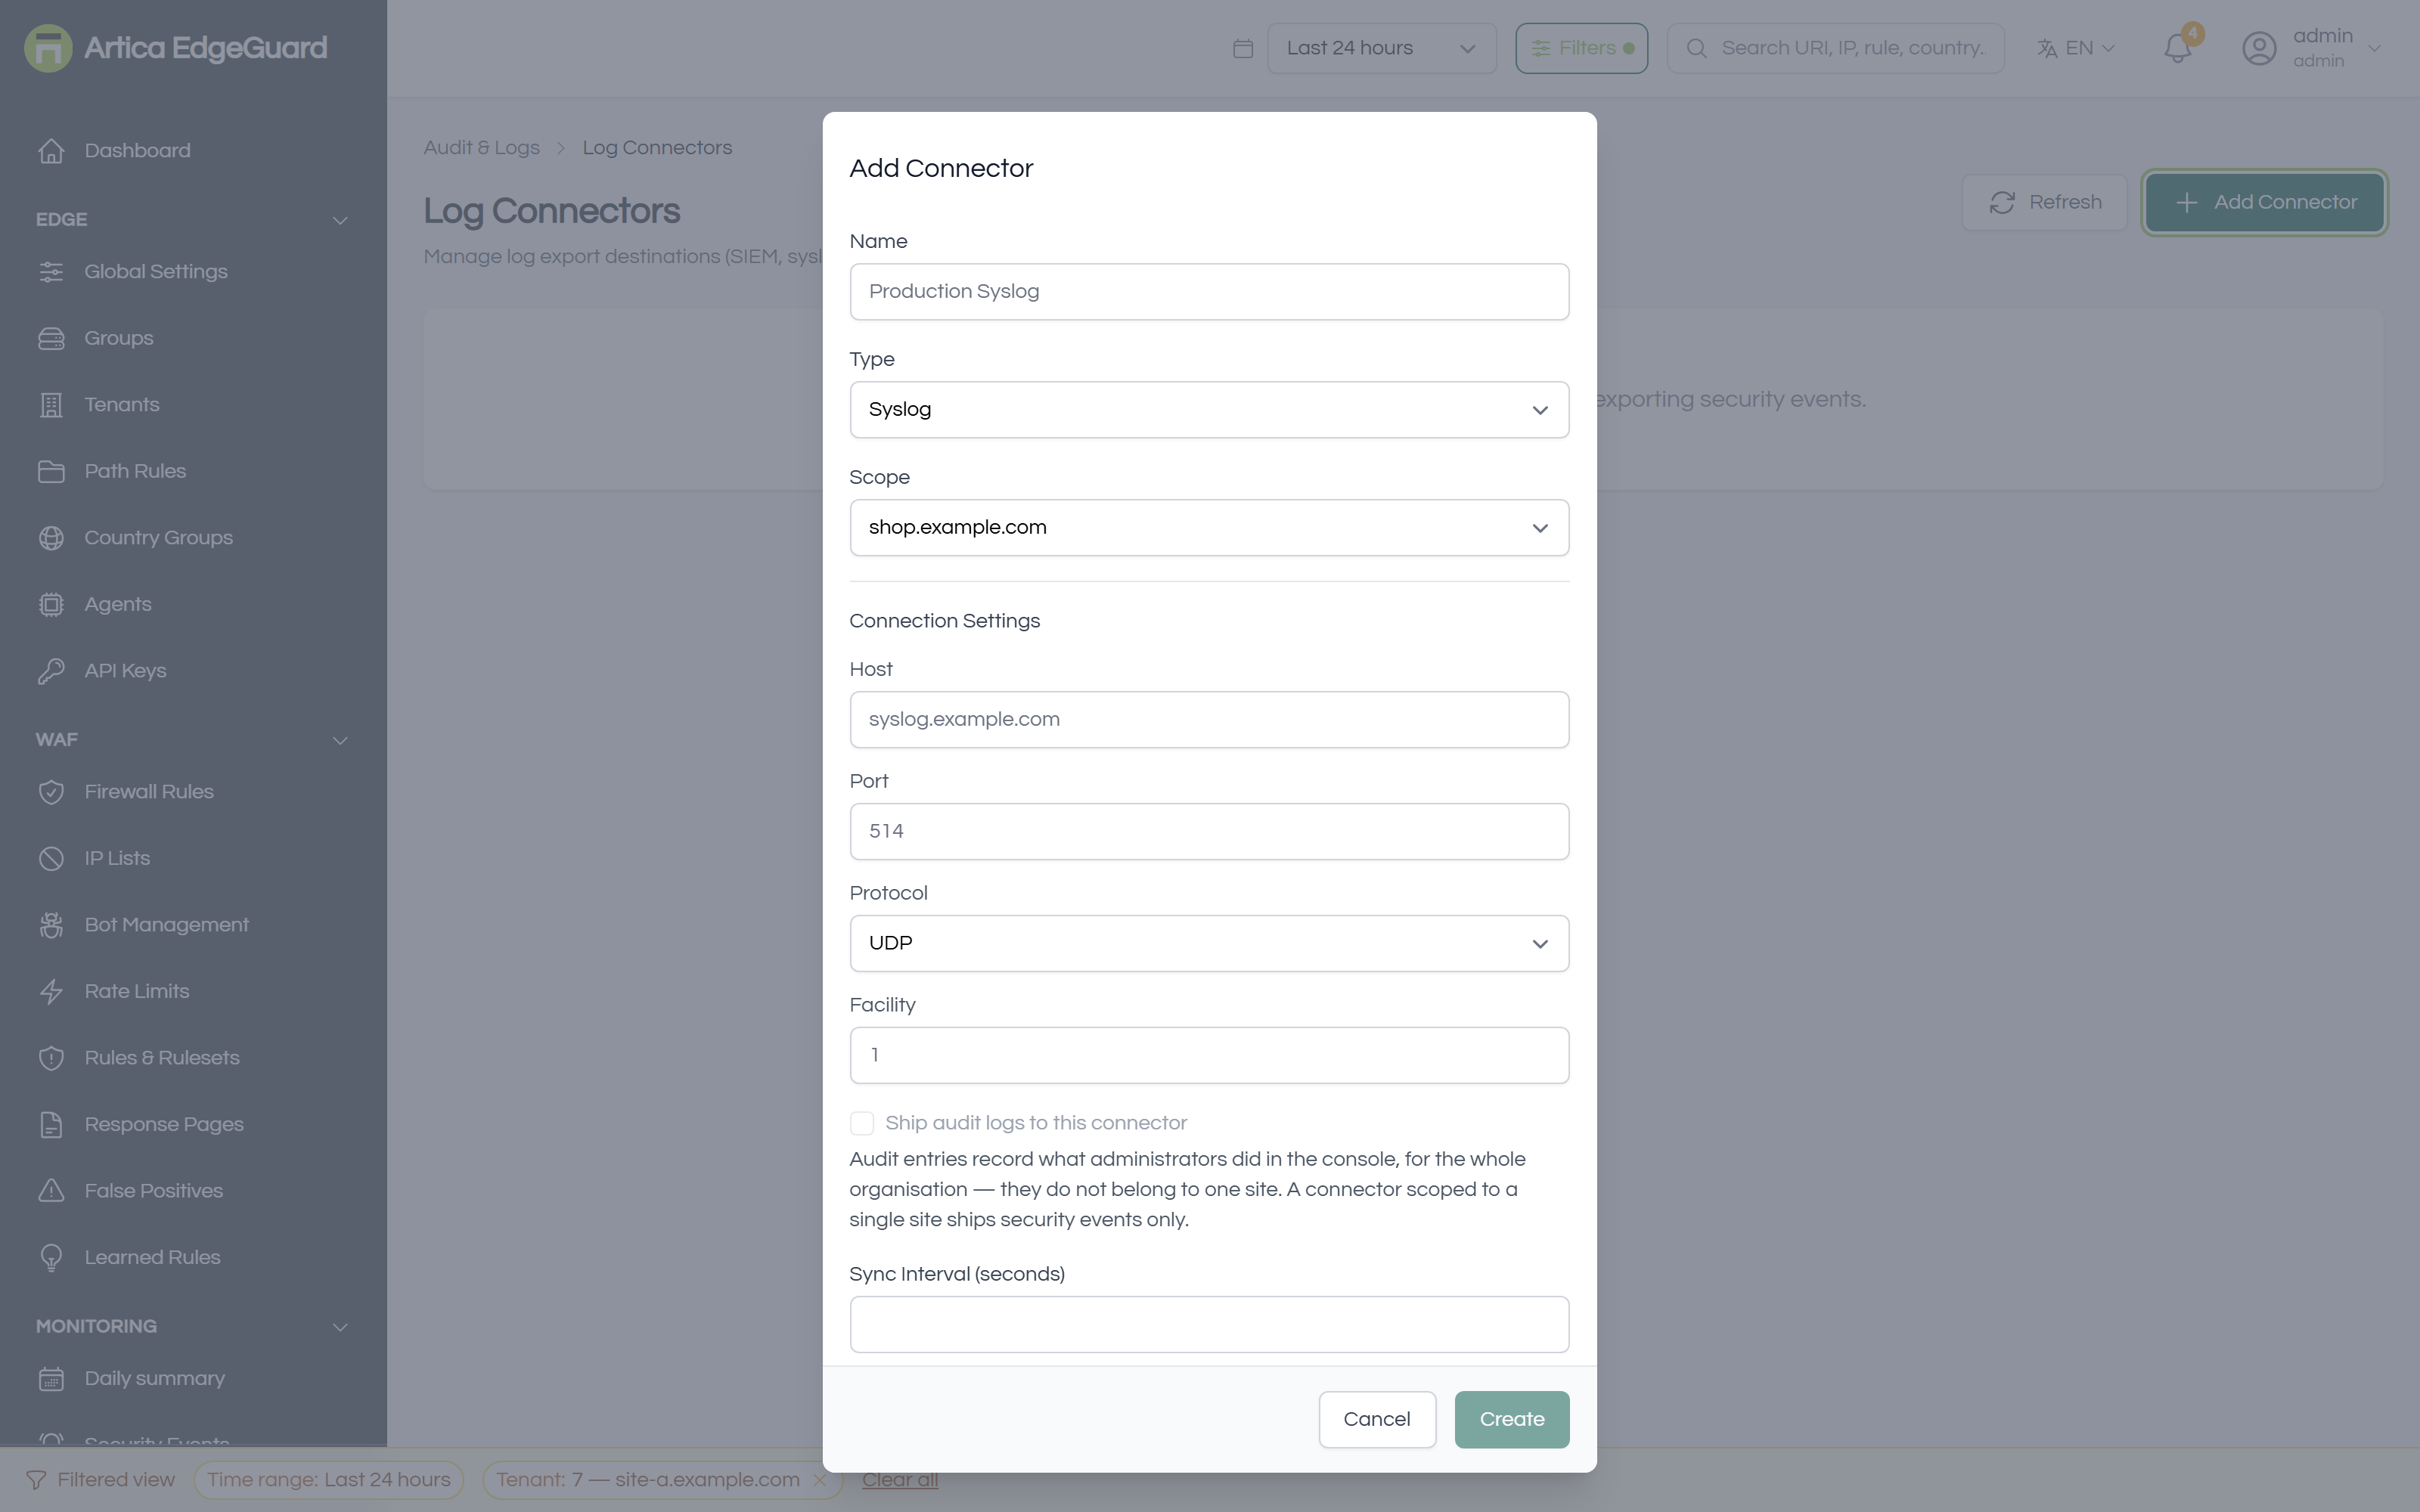
Where events and audit entries are shipped: a SIEM, Elasticsearch, Splunk, syslog or a webhook of your own.
Full documentation: EdgeGuard — Log Connectors
¶ Platform
Only for a platform administrator.
¶ Organizations
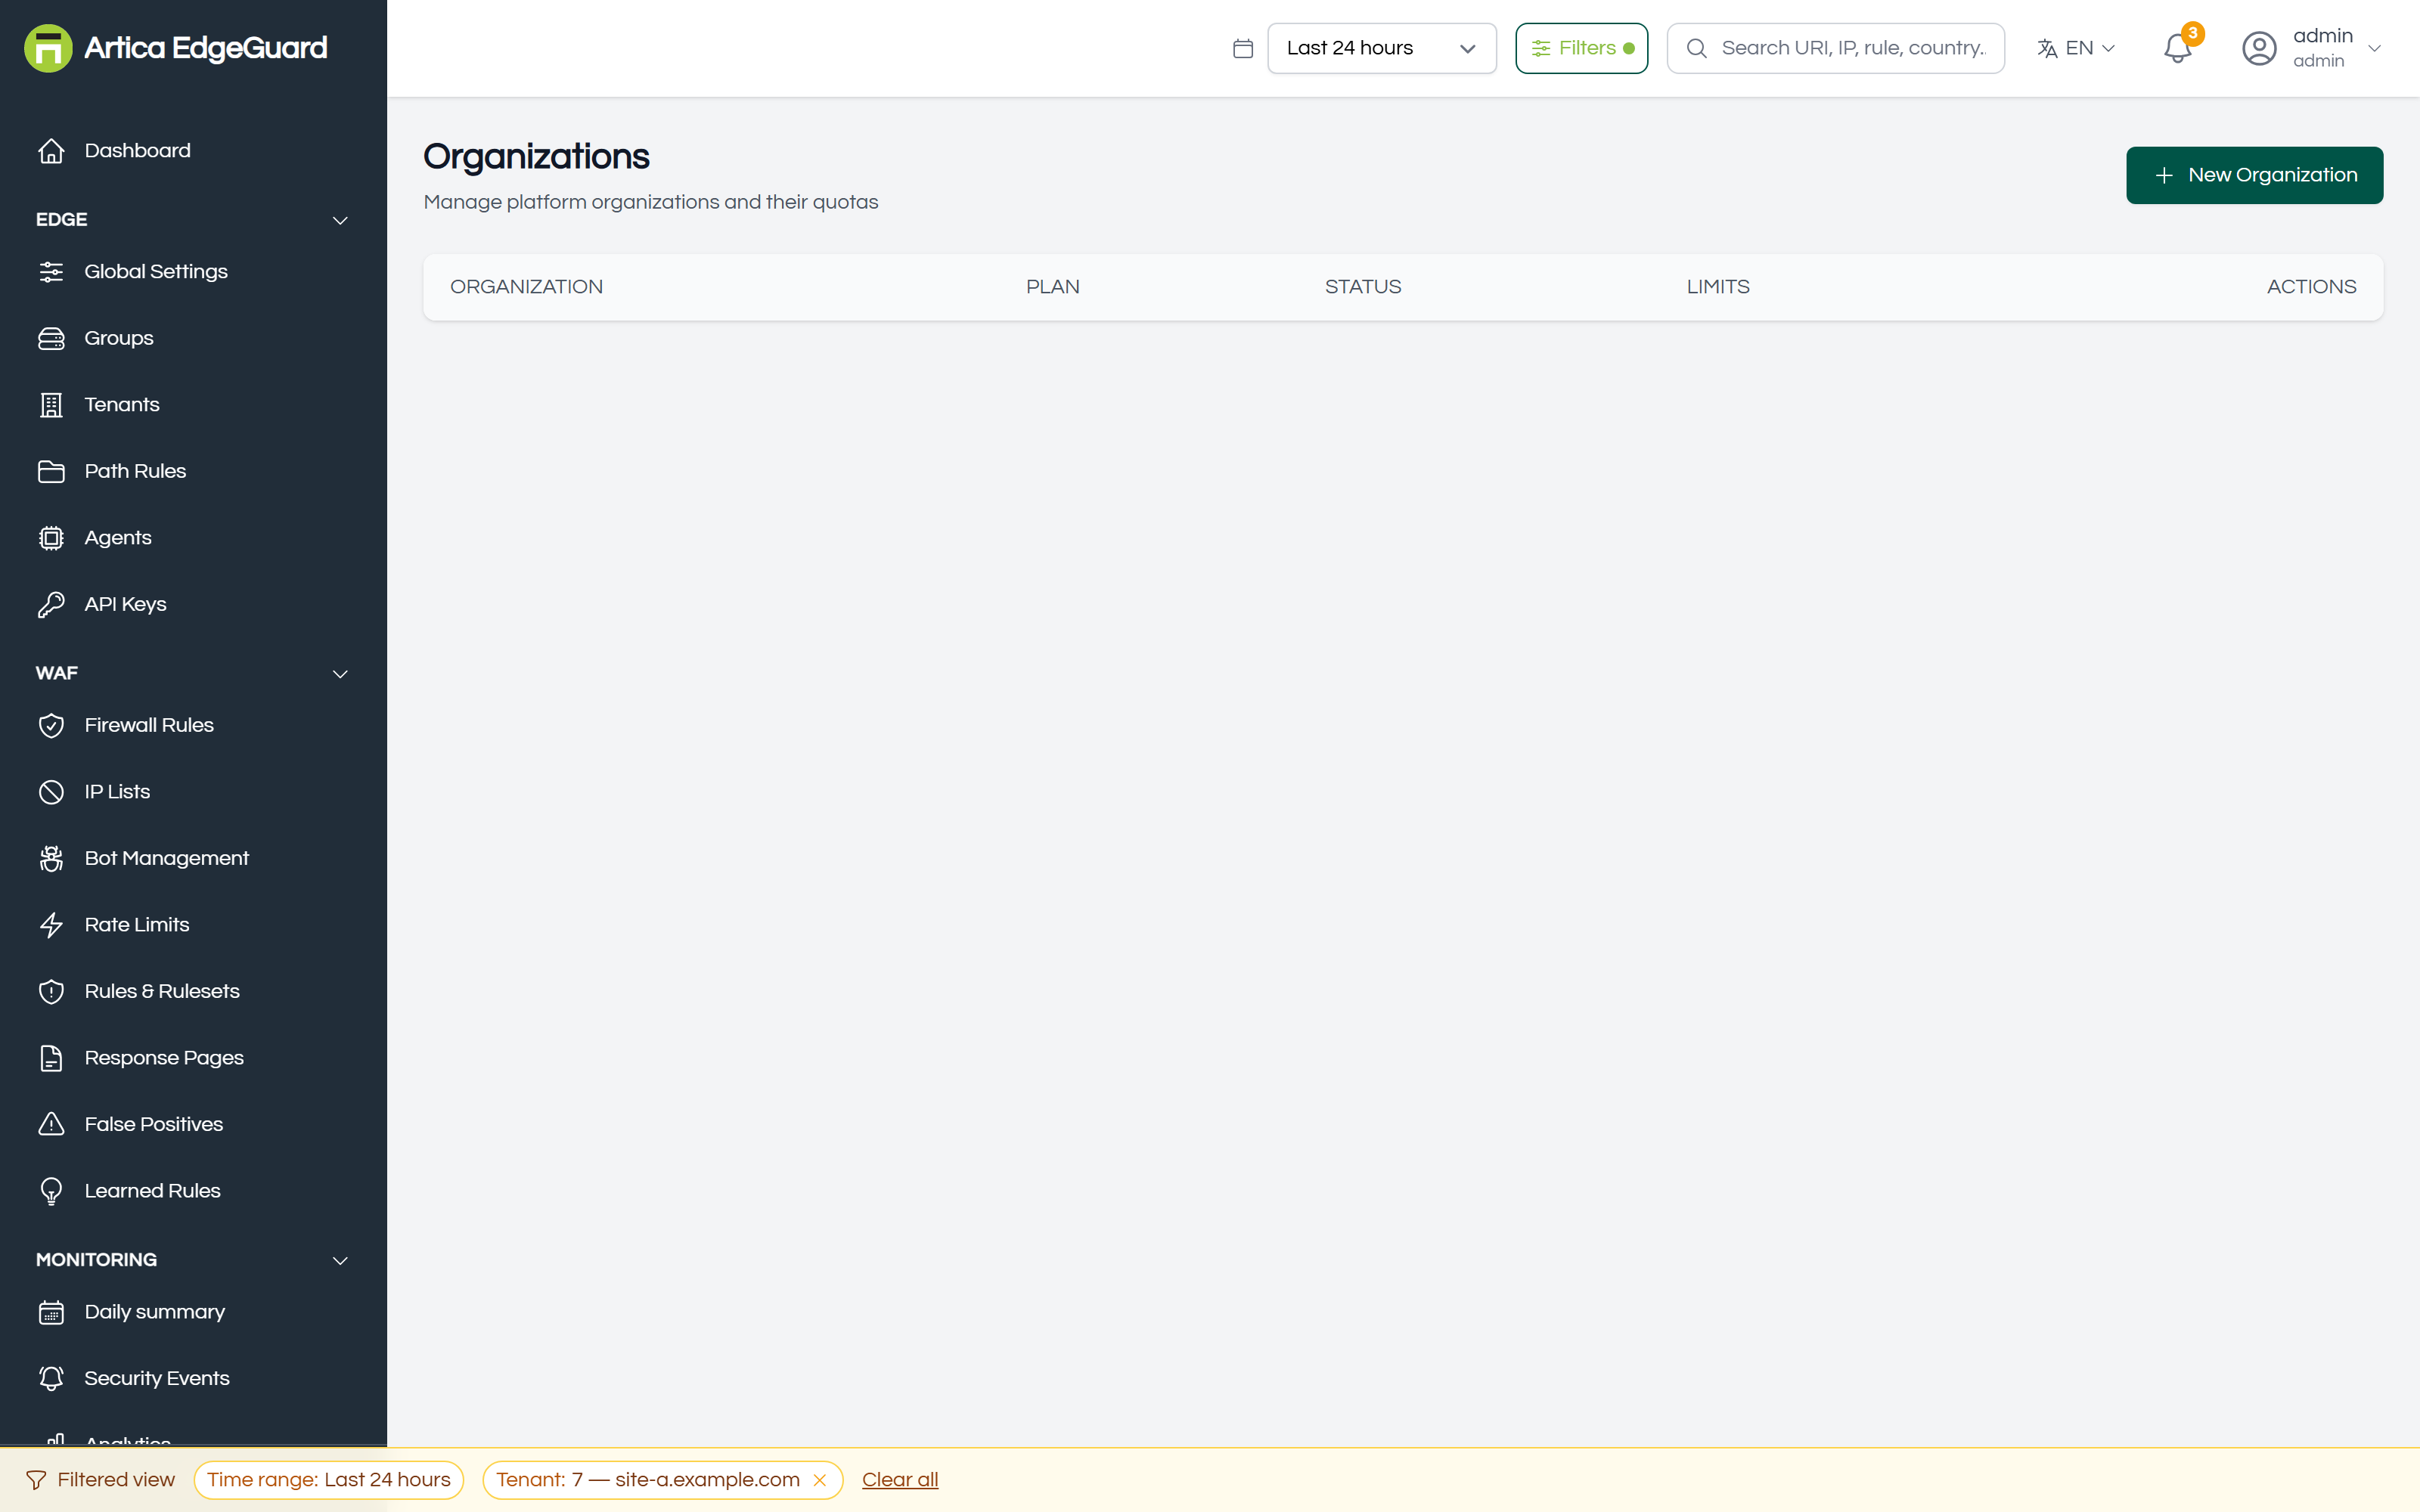
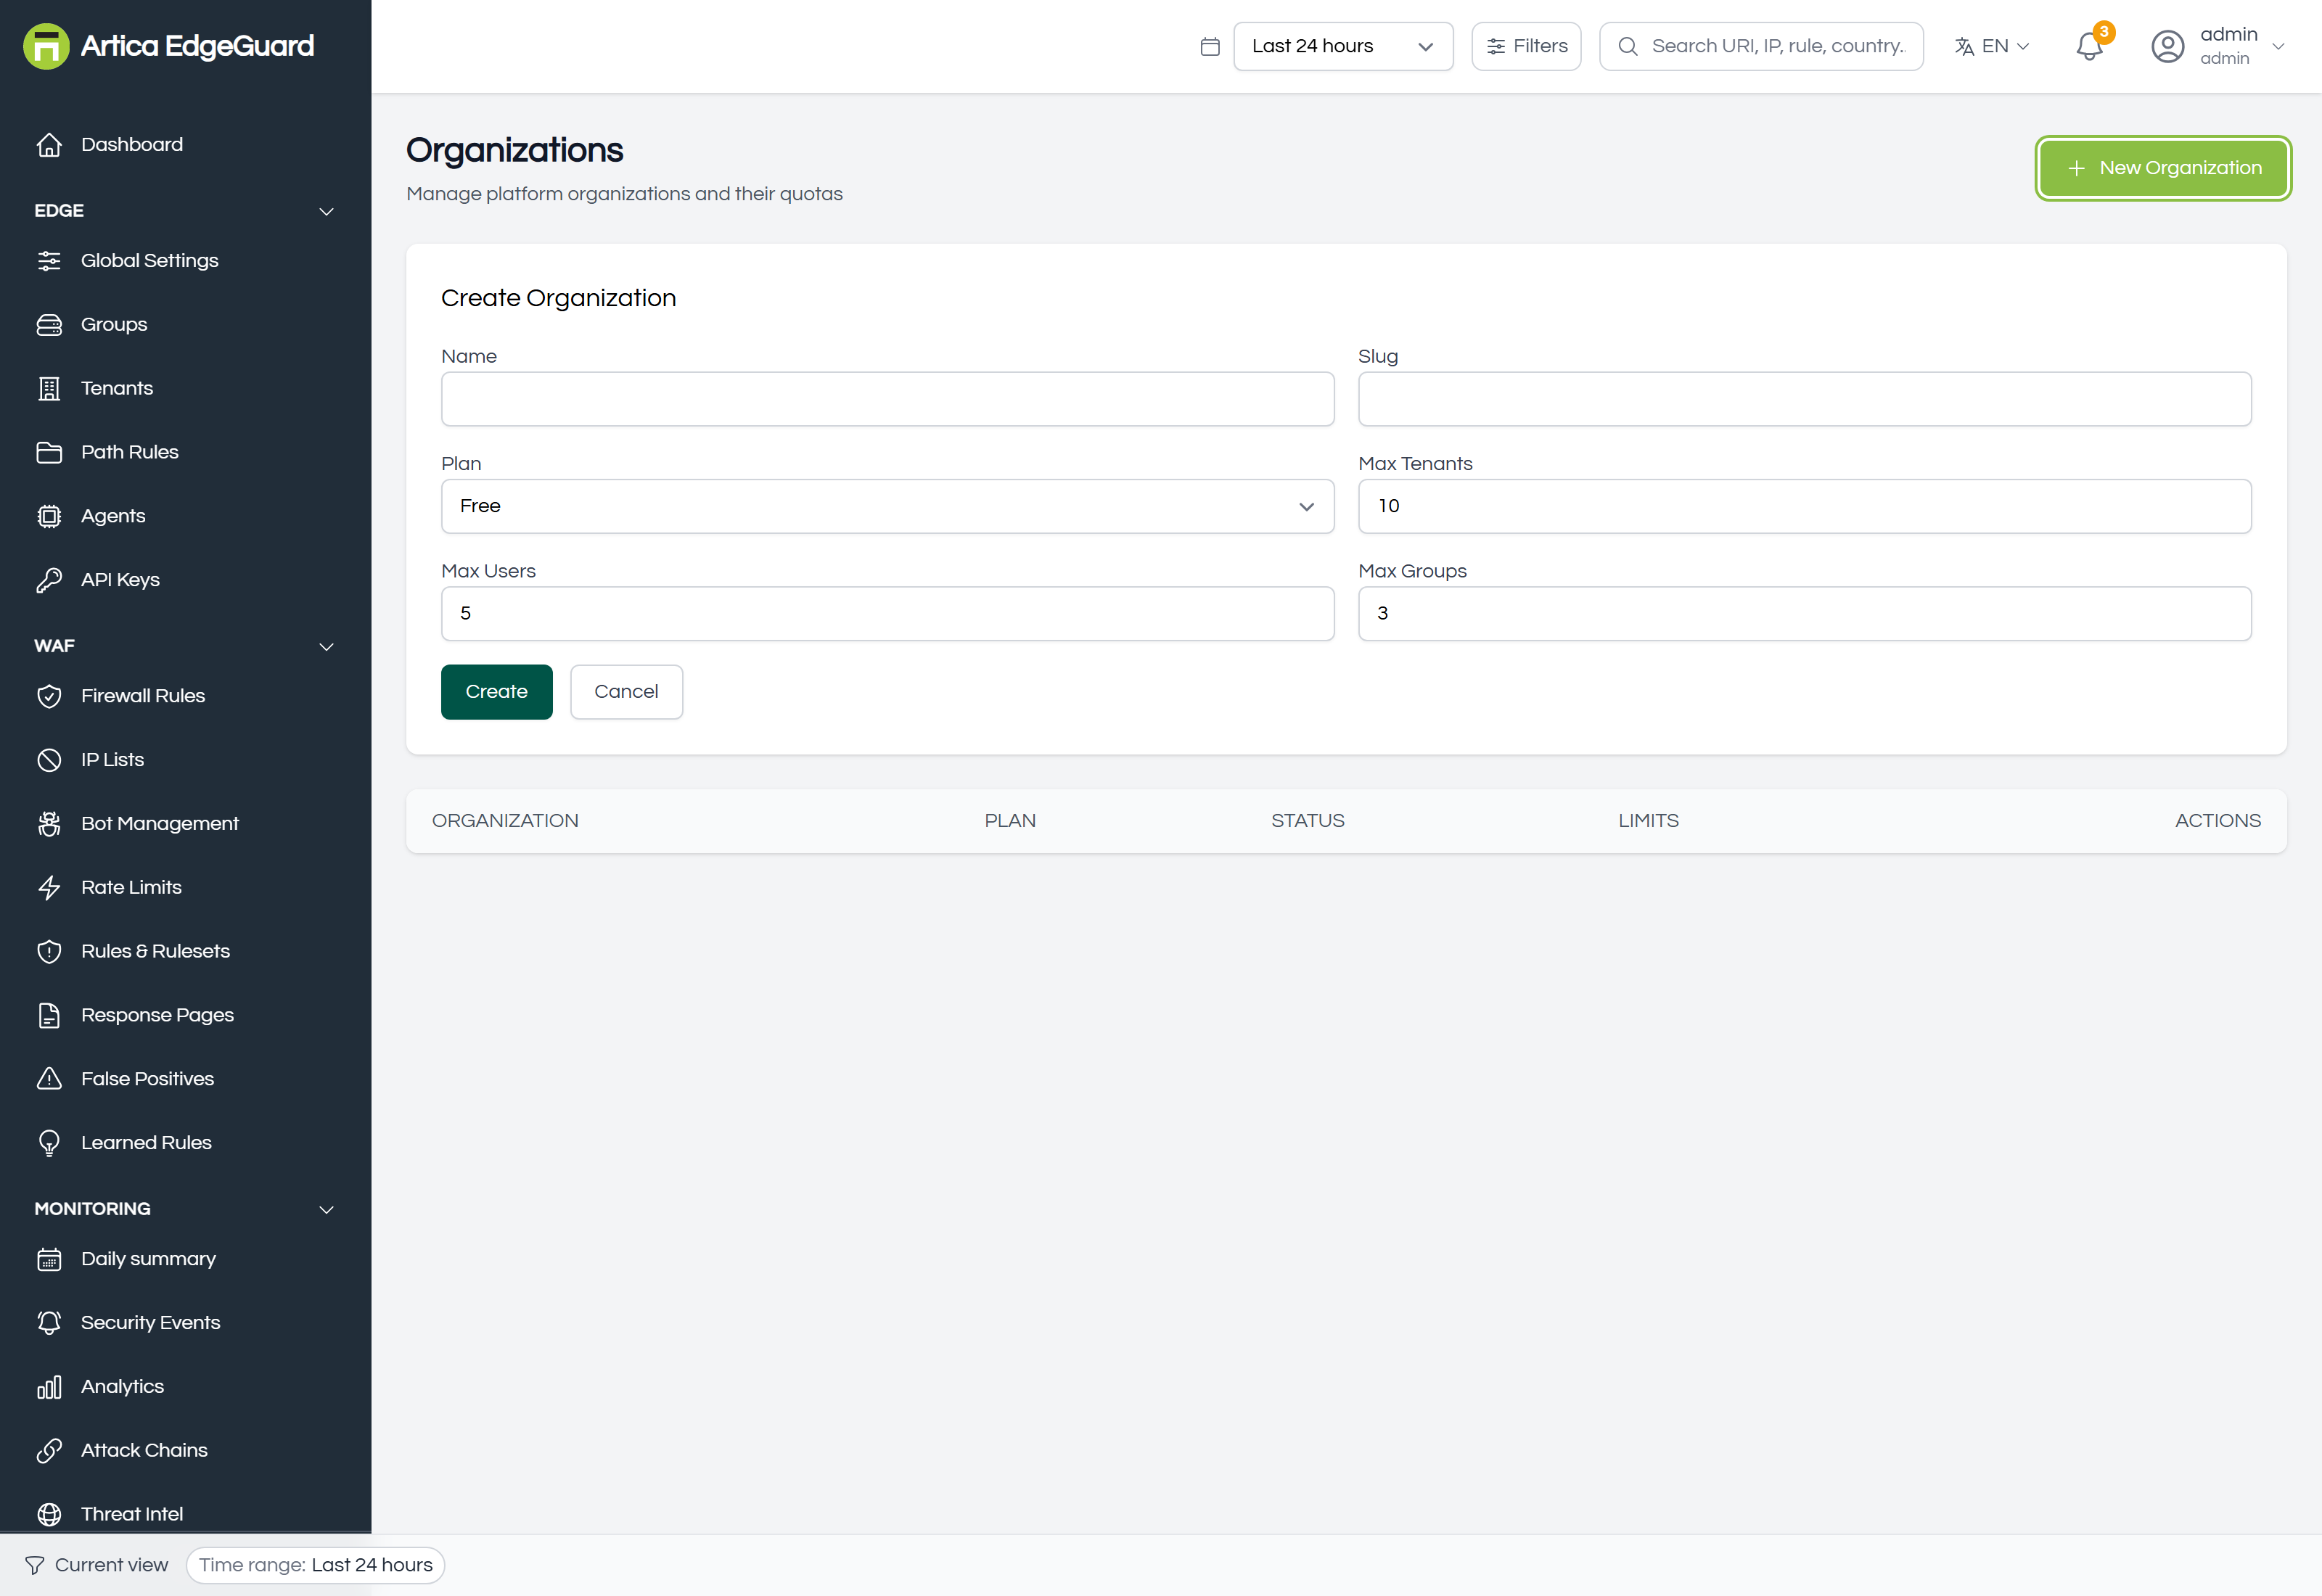
The wall between customers: what an organisation owns, what it may create, and whether its people may use the console at all.
Full documentation: EdgeGuard — Organizations
¶ Top Bar
The bar across the top of every page. Almost every "this page shows nothing" is one of these controls.
Full documentation: EdgeGuard — Top Bar and Filters
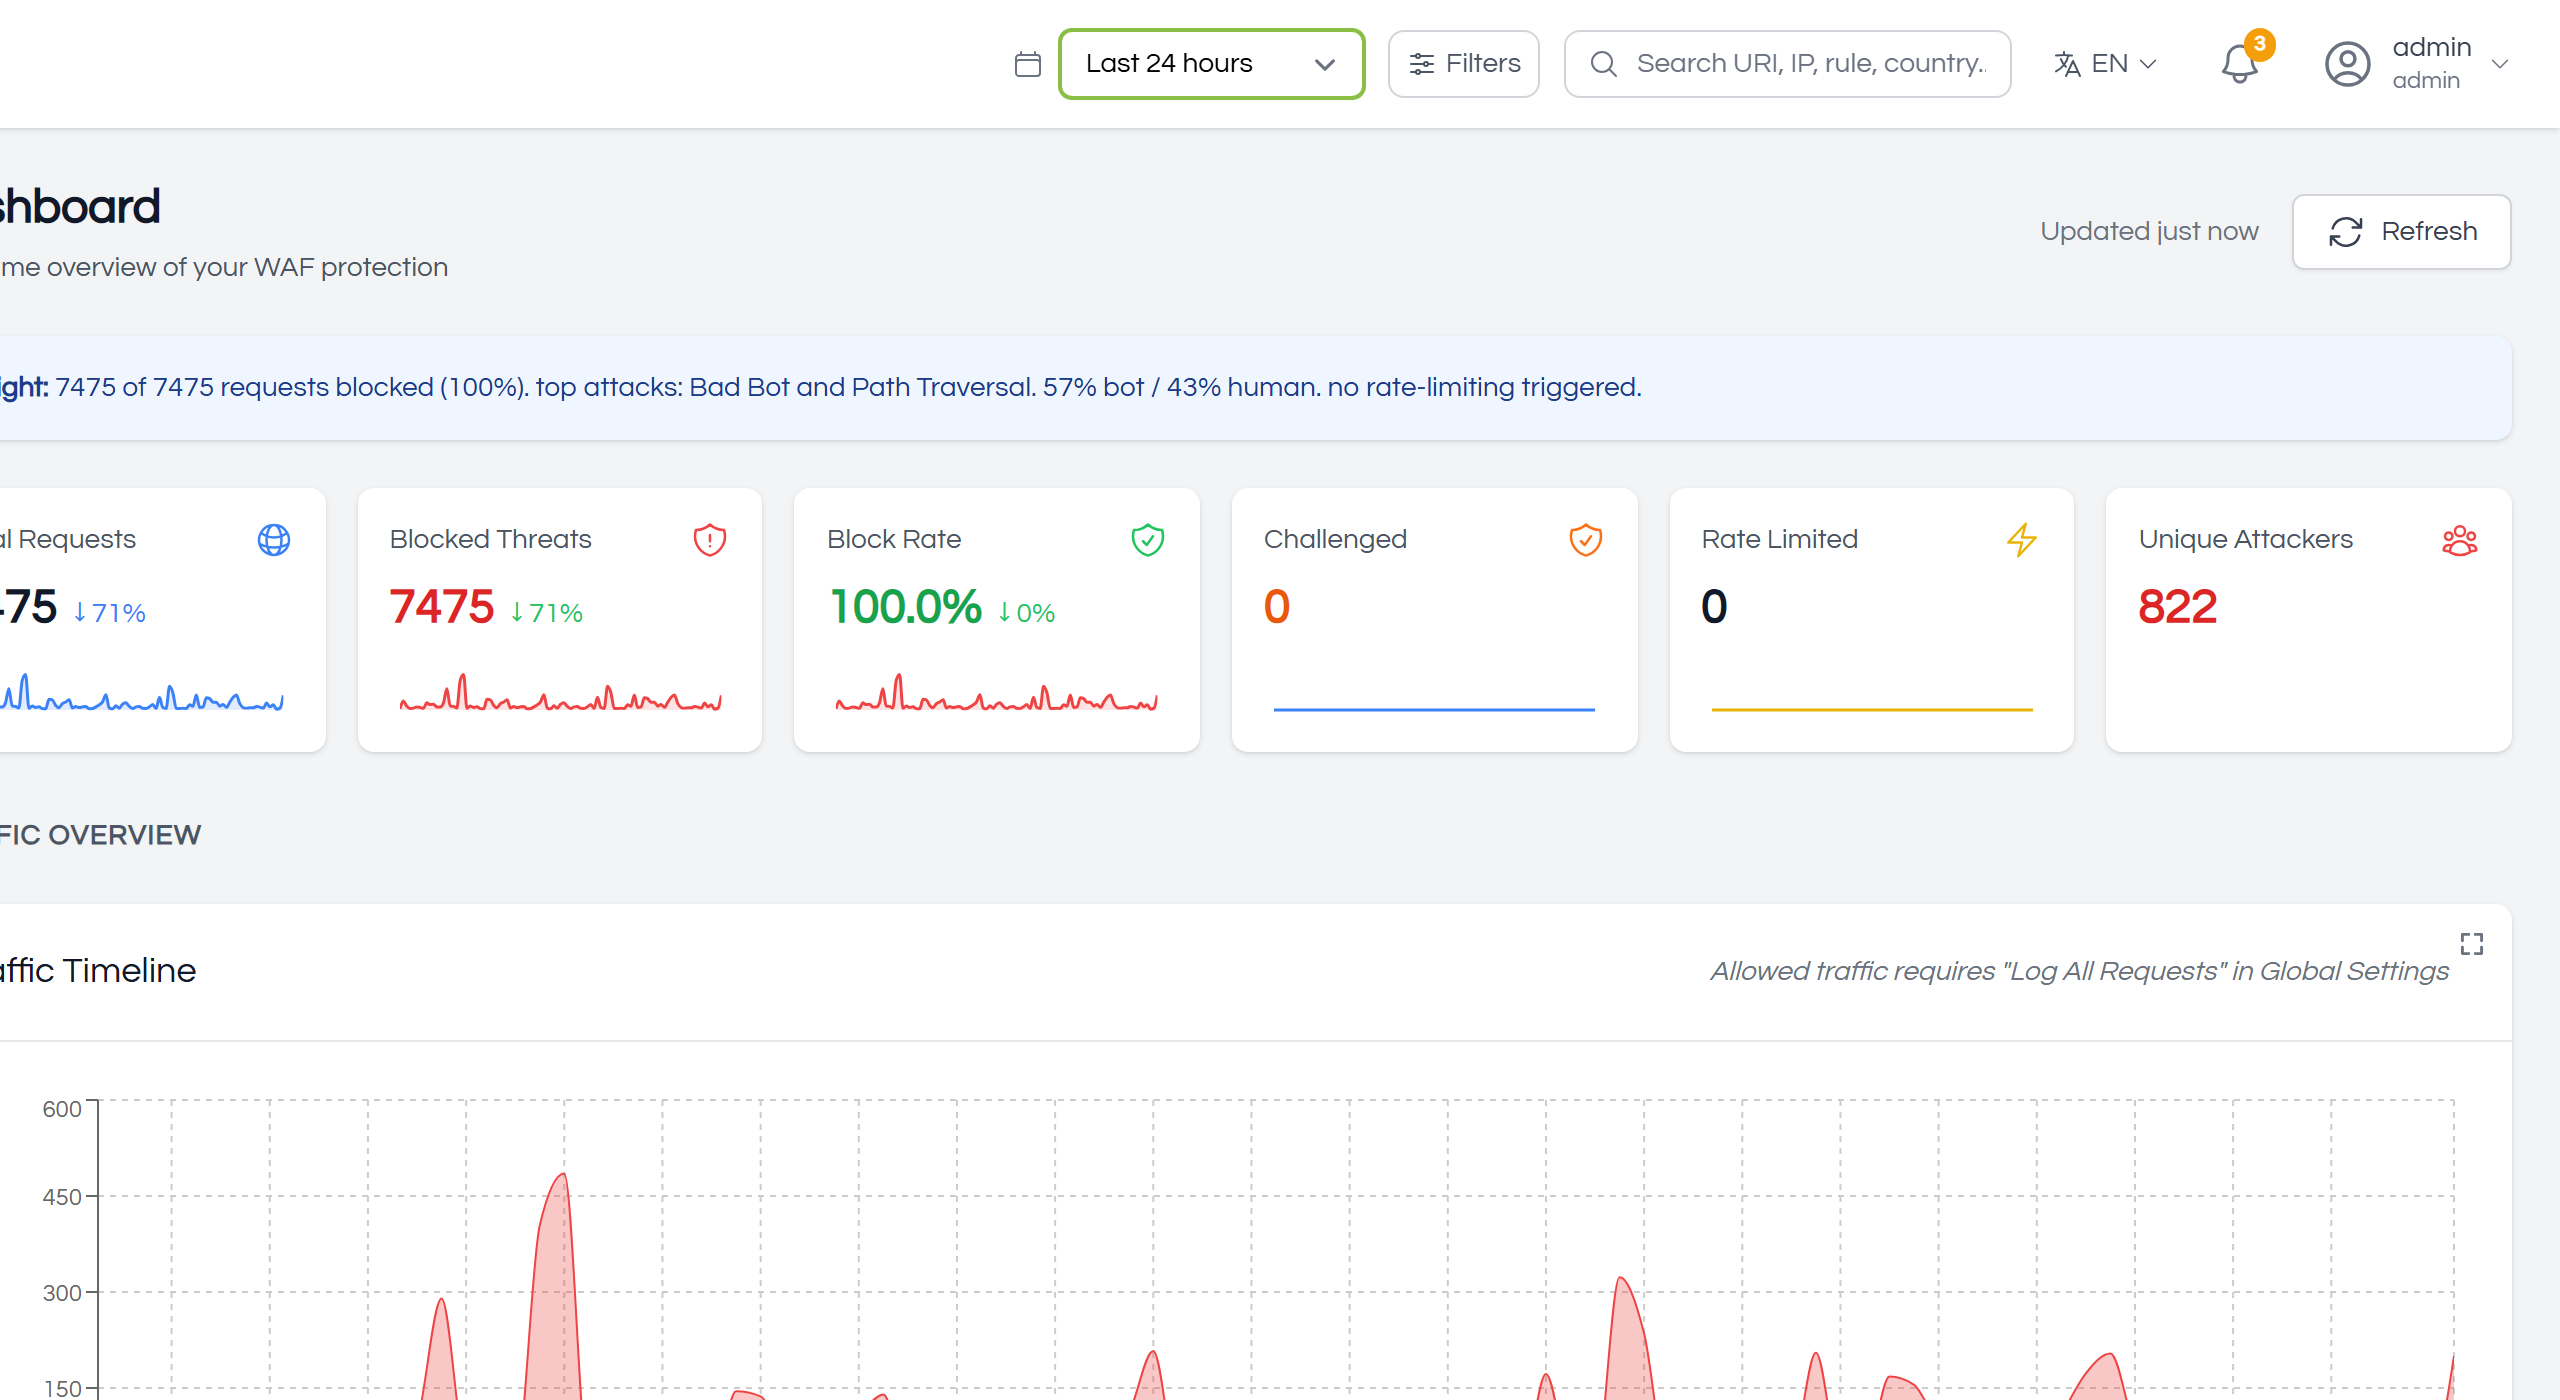
¶ Time Range
The period every page of events reads: the last hour through the last thirty days, or a range you choose. It is remembered between visits, and deliberately ignored by the configuration pages — a firewall rule is not something that happened in the last day.
¶ Global Filters
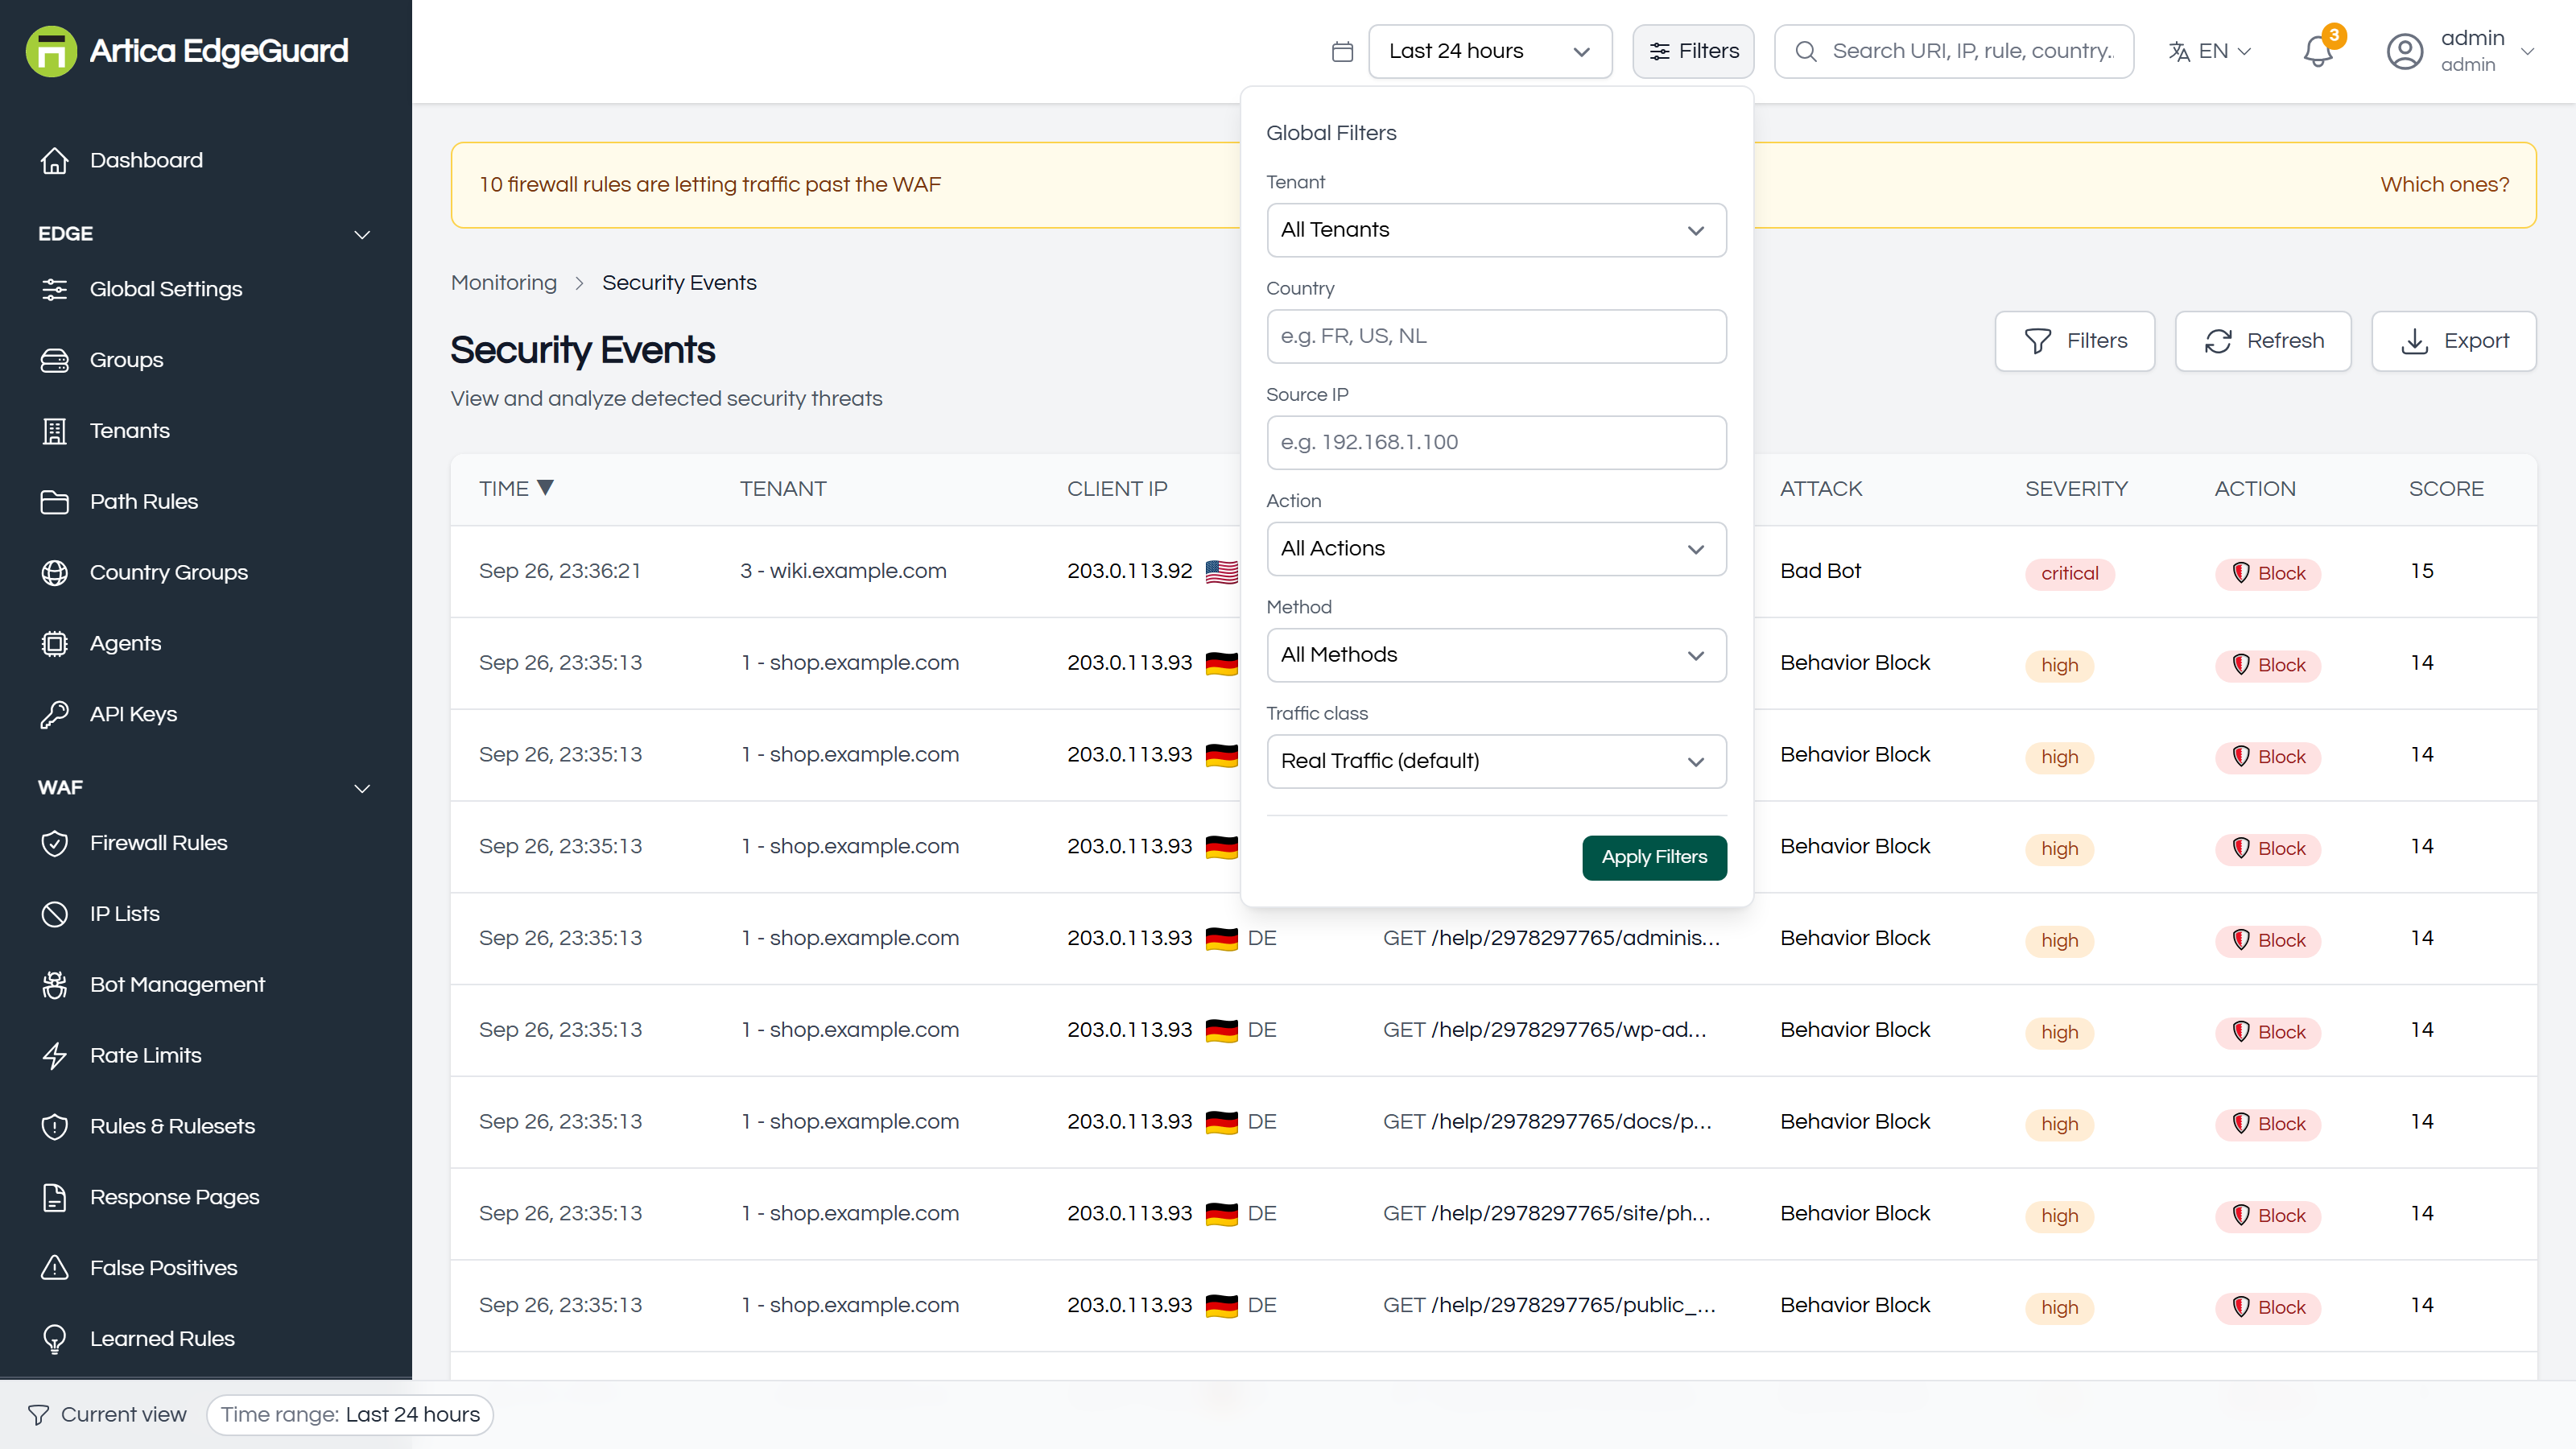
Six filters applied together: site, country, source address, action, method and traffic class. Nothing is applied until Apply Filters, and whatever is in force is stated as chips along the bottom of the window — which is the first place to look when a page is emptier than it should be.
¶ Global Search
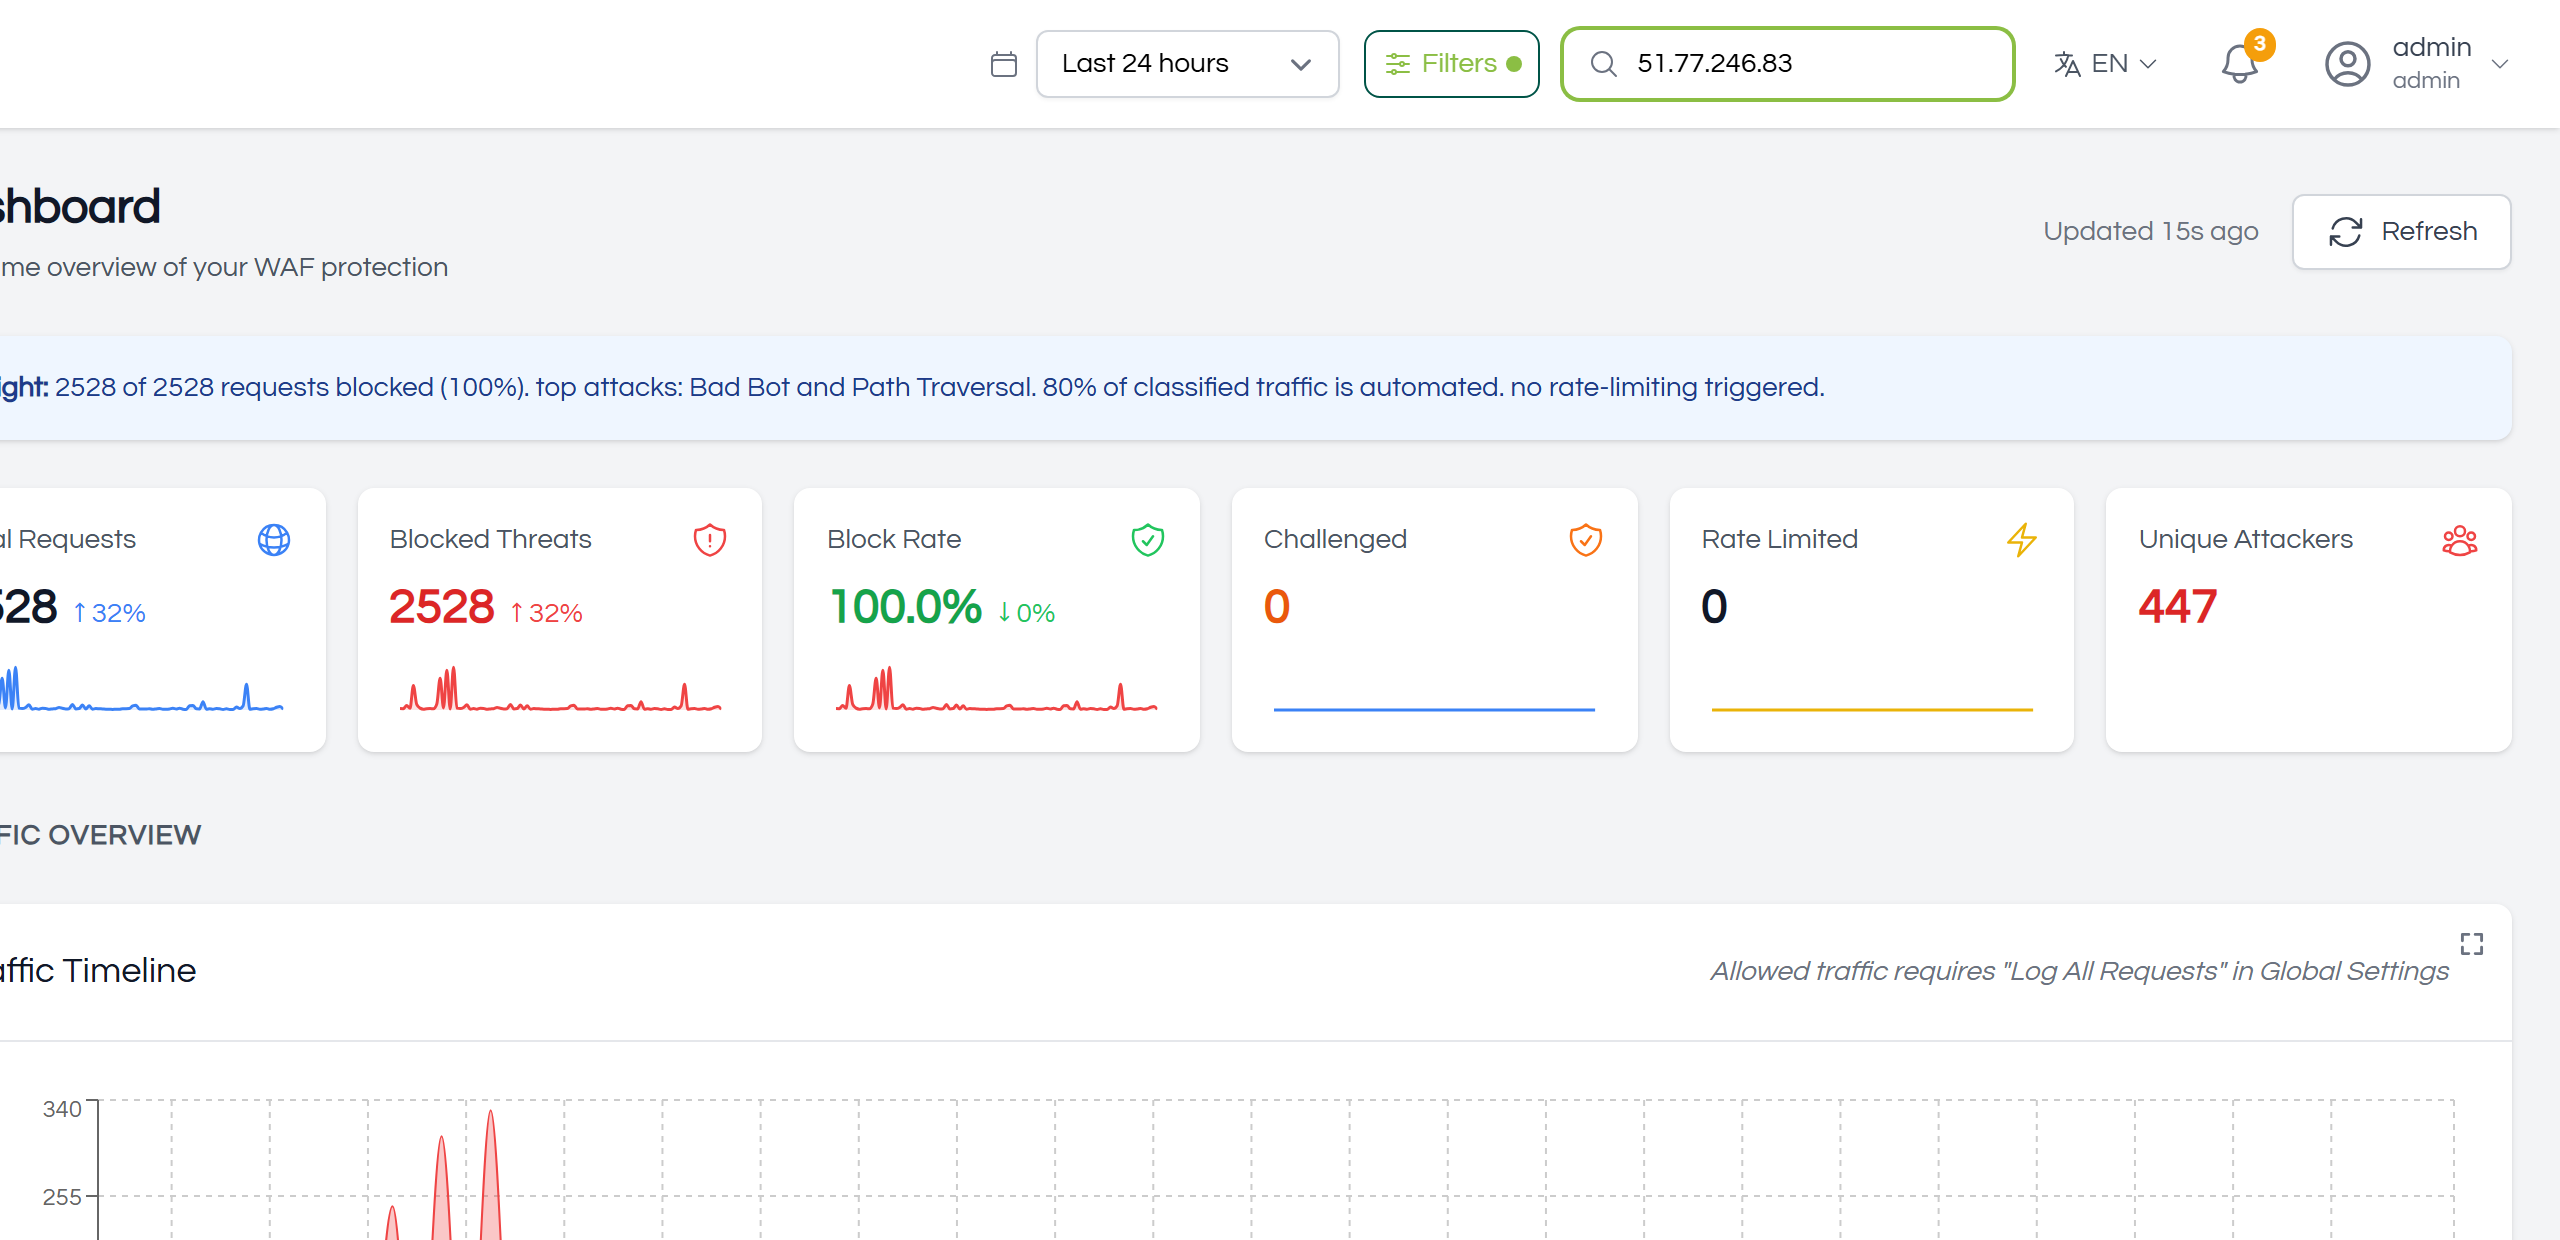
A jump rather than a filter: type an EdgeGuard ID, an address, a URI, a country or a rule name and land on the matching events. The ID is the useful one — every block page carries one, so a visitor can read you eight characters and you have their request.
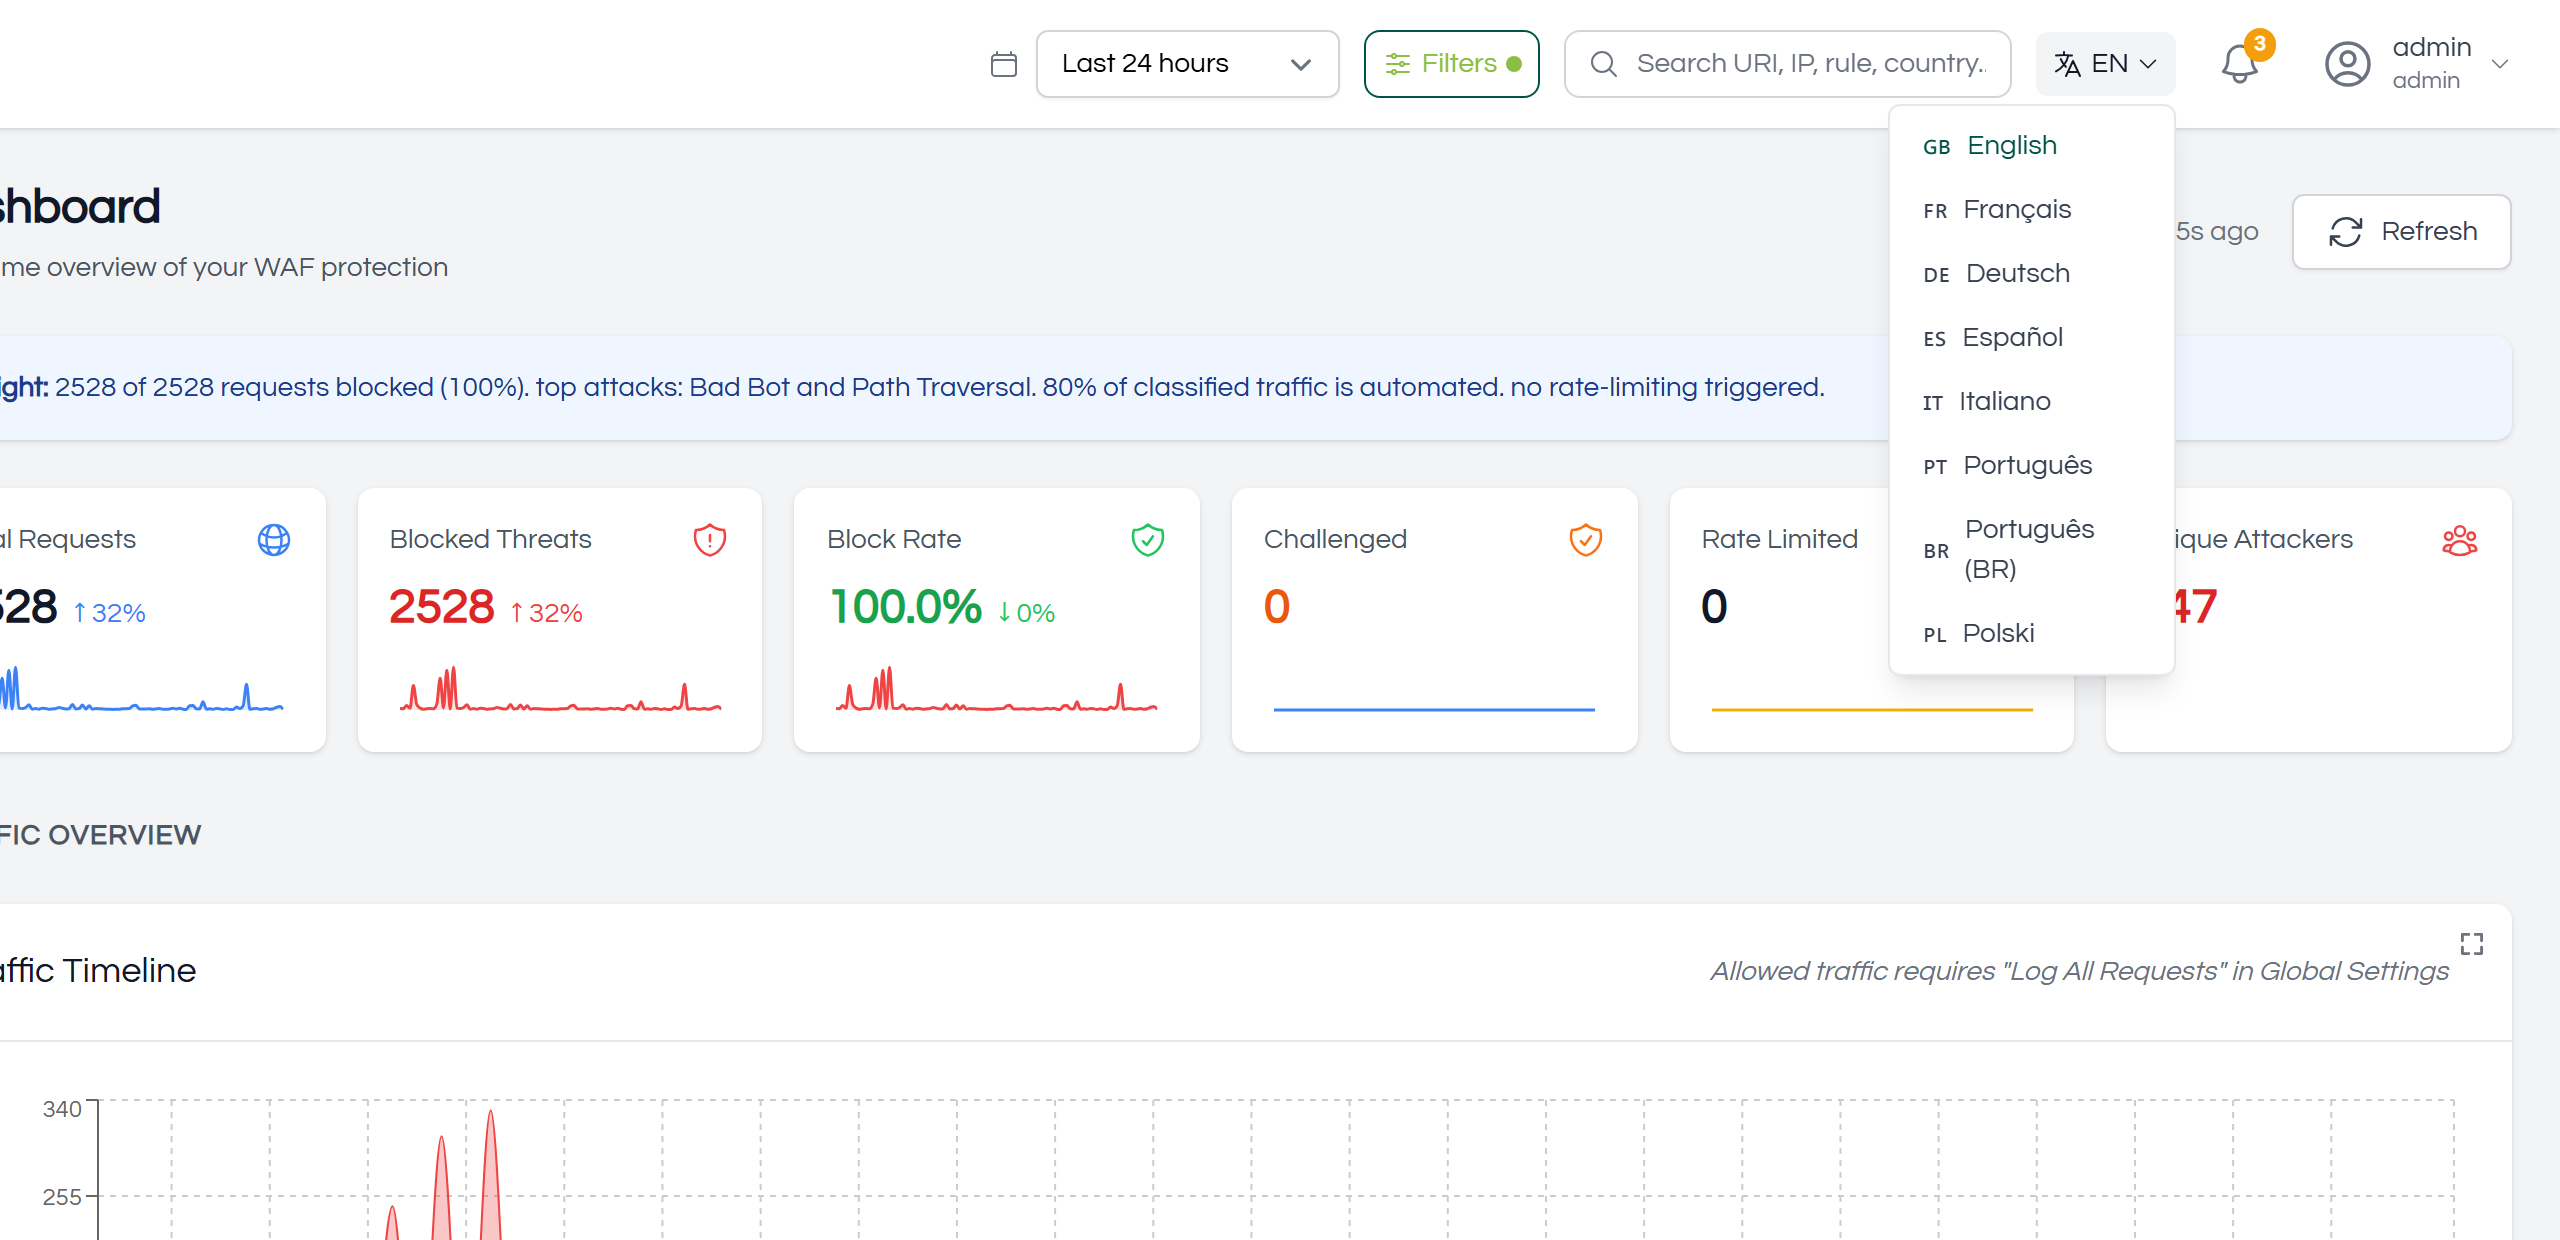
¶ Language
The console speaks eight languages — English, Portuguese, Brazilian Portuguese, French, Spanish, German, Italian and Polish. The choice is per account, so two administrators of the same organisation can read it in different ones.
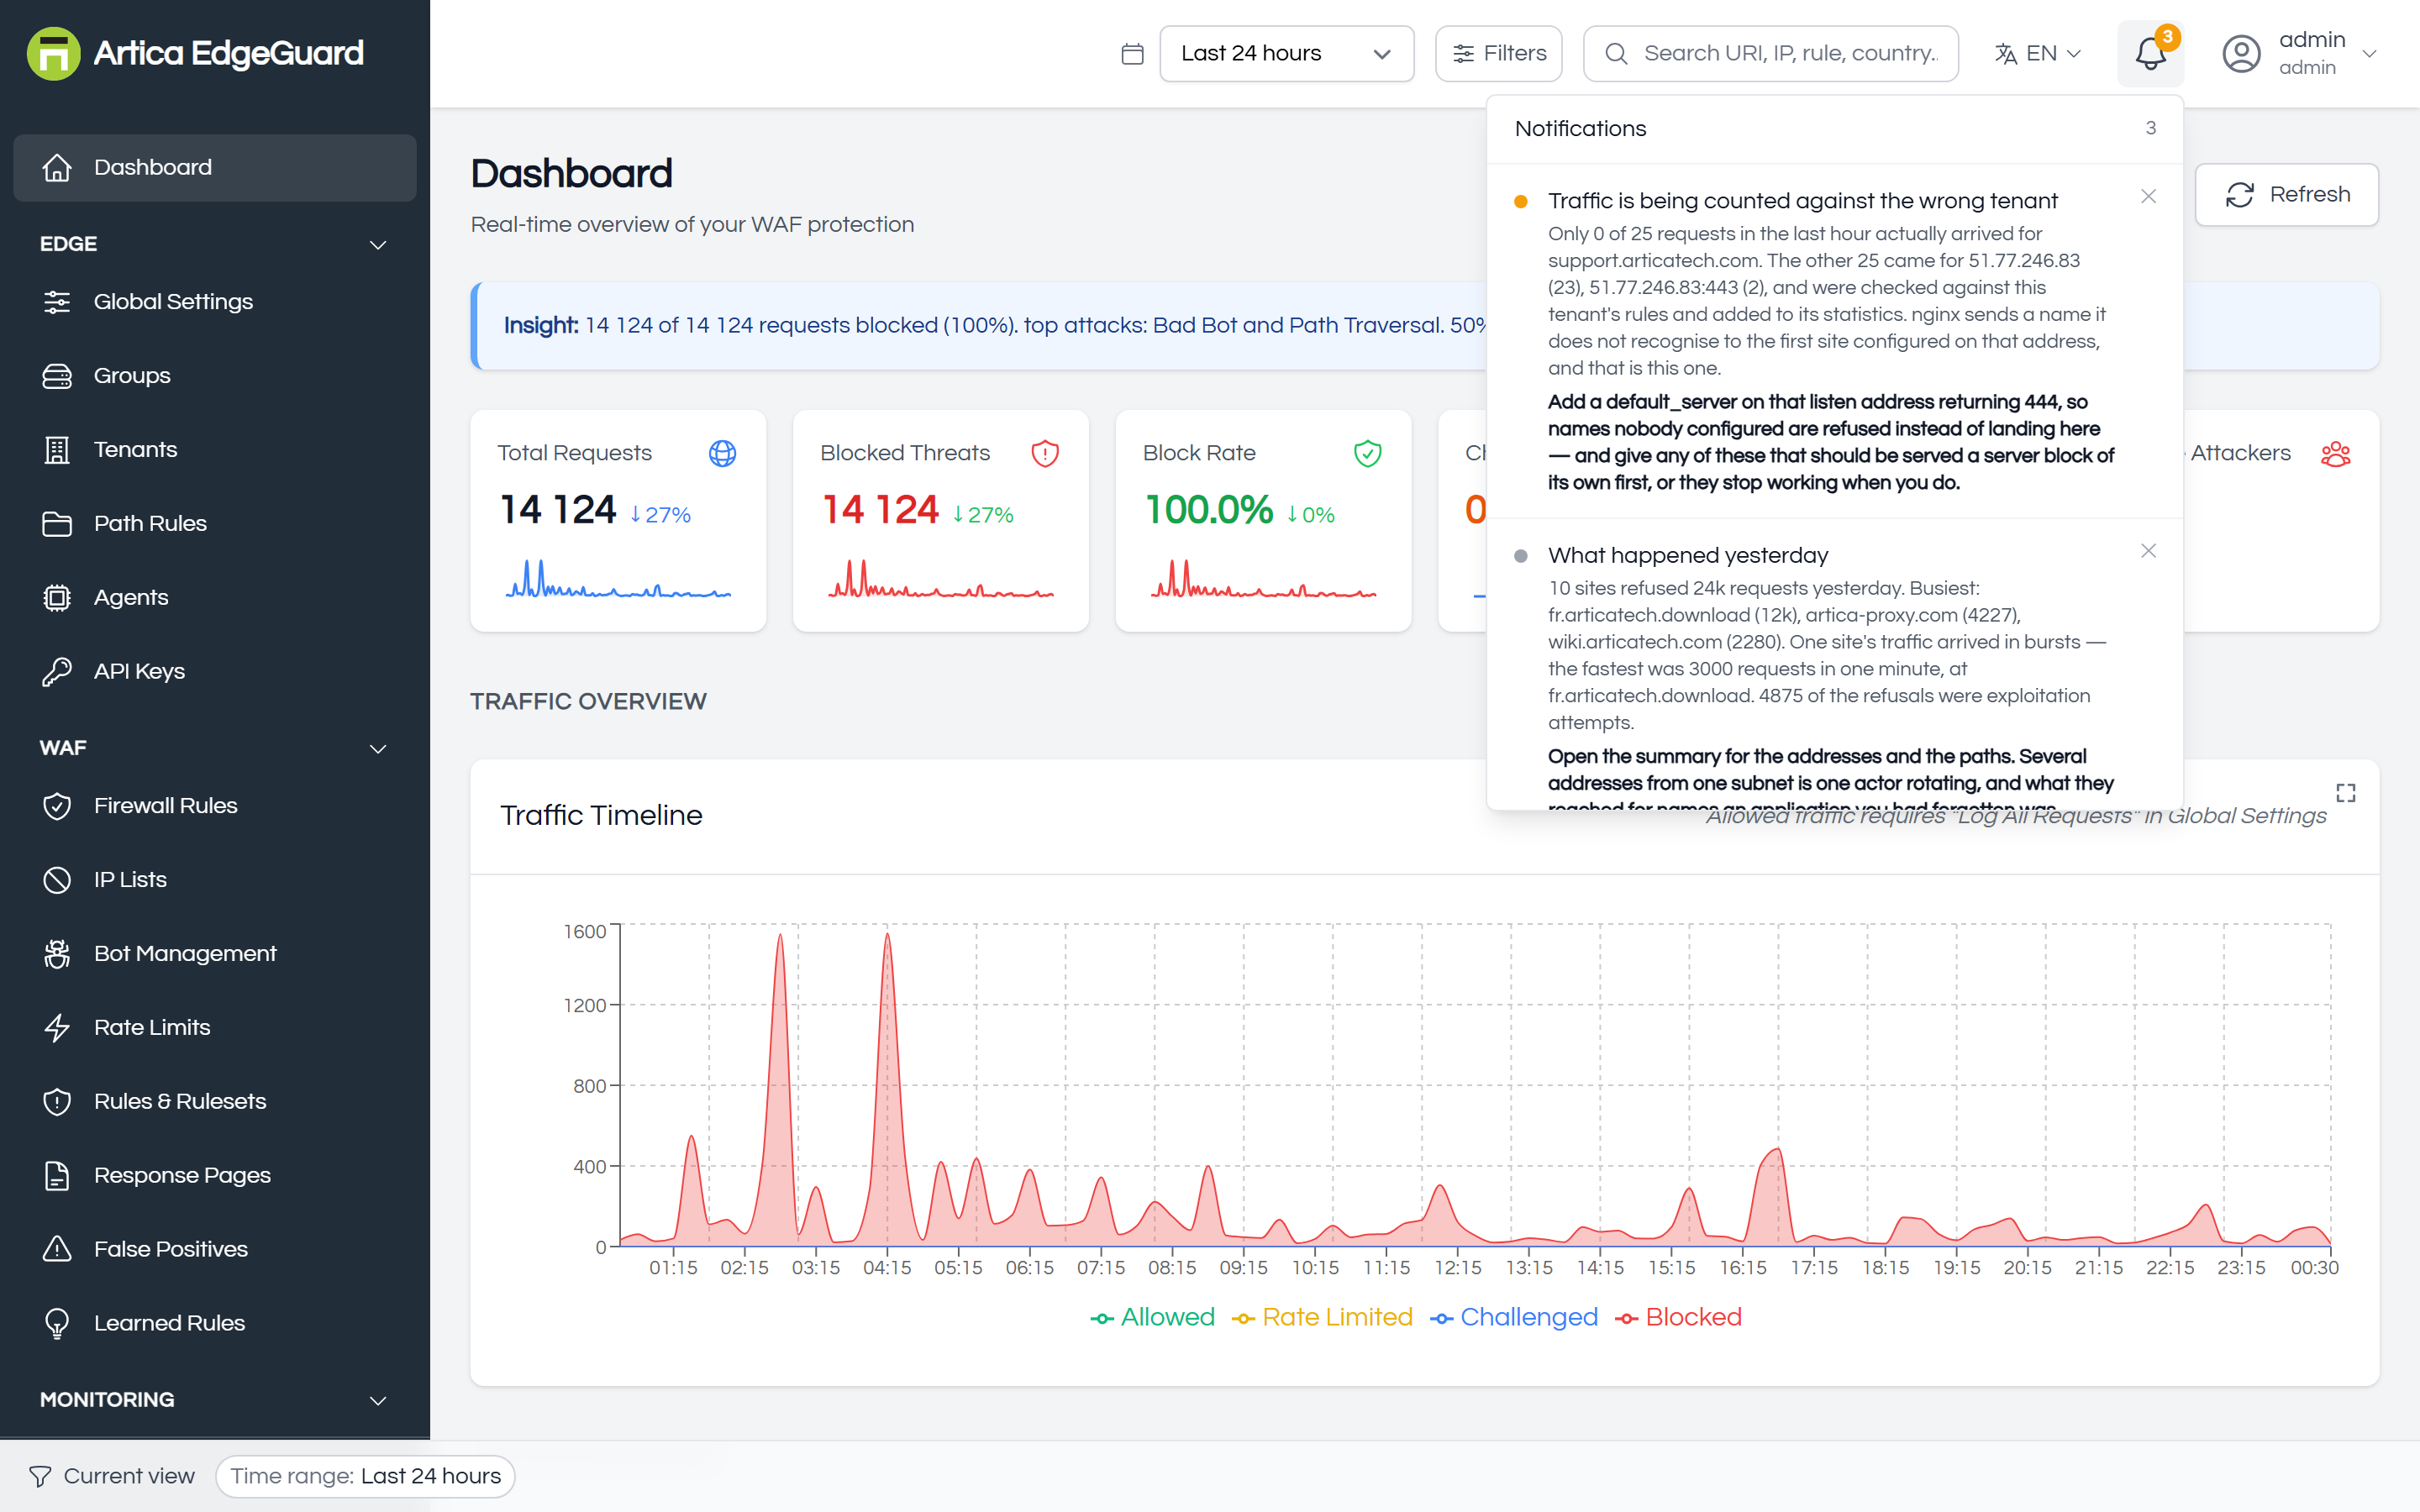
¶ Notifications
Conditions that need attention — an agent that stopped reporting, a learned rule waiting for review — and one summary of yesterday each morning. Everything else clears when its condition clears, which is why a day of refused traffic leaves no trace here and lives in the Daily summary instead.
¶ Organization Selector
For a platform administrator only: read the whole console as one organisation, or as all of them at once. Check it before writing anything global — a firewall rule written while the selector points at the wrong customer is a real outage for somebody.
¶ User Menu
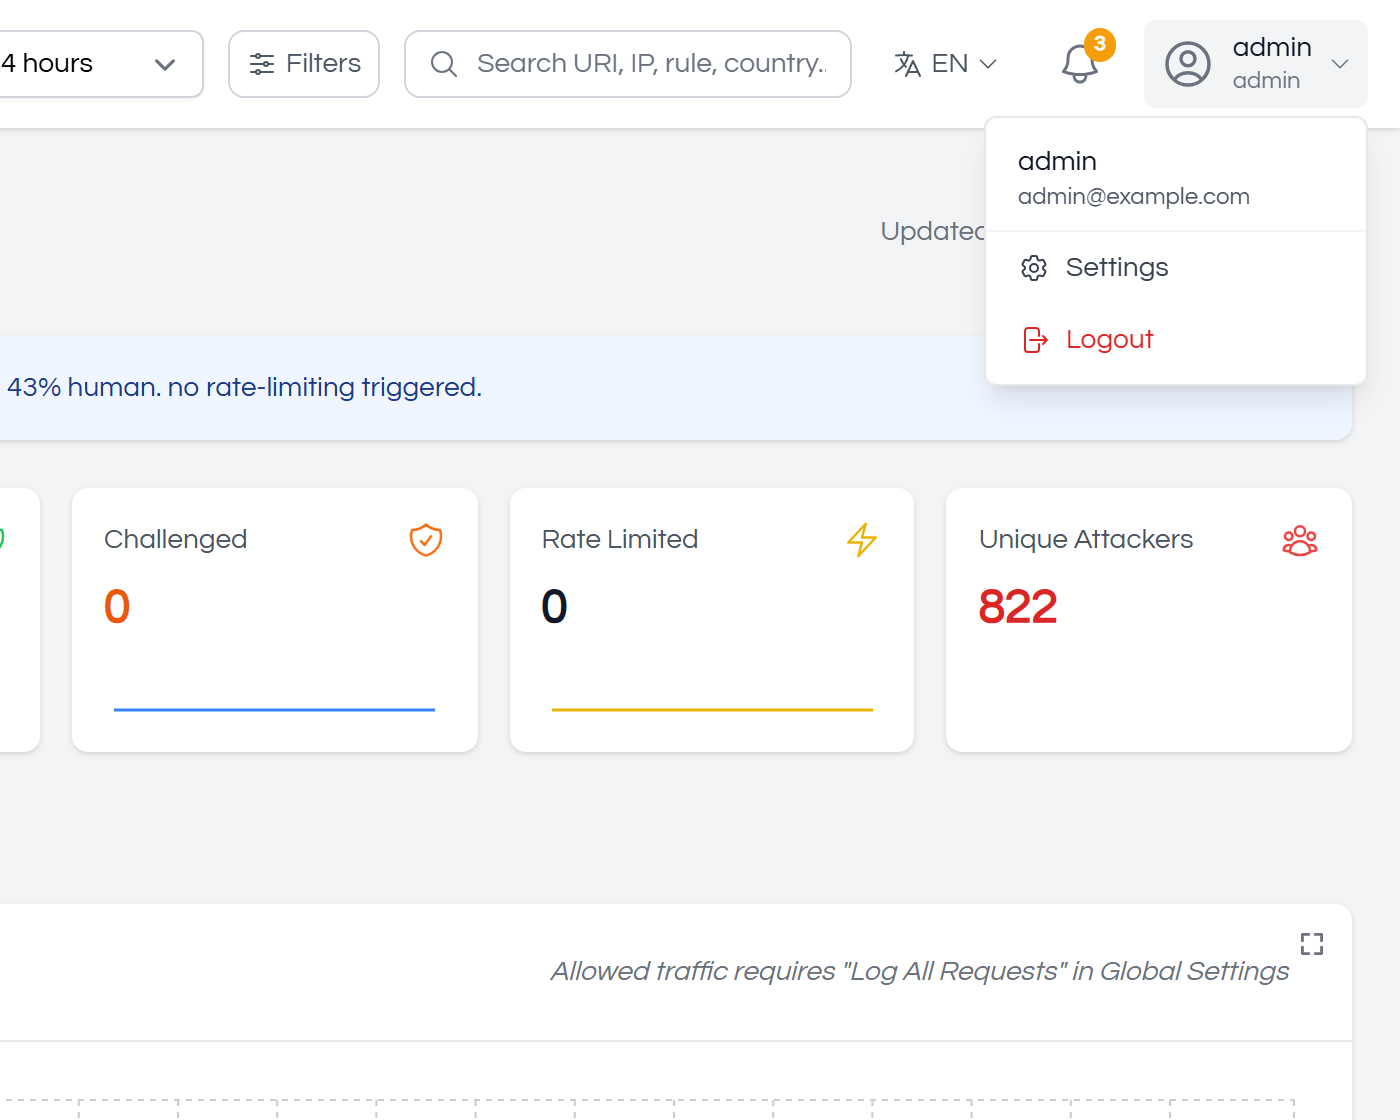
Your own account: name and email, password, multi-factor authentication, the session timeout, and sign out. Changing your own password does not end other sessions, so sign out everywhere if that is what you meant.