Capturing a NetLog gives you a surgical, millisecond-by-millisecond replay of everything Chrome’s network stack did—making it the go-to tool when a plain HAR or DevTools waterfall can’t explain that stubborn TLS error, proxy hiccup, or protocol downgrade.
¶ What “Capture a NetLog” really does
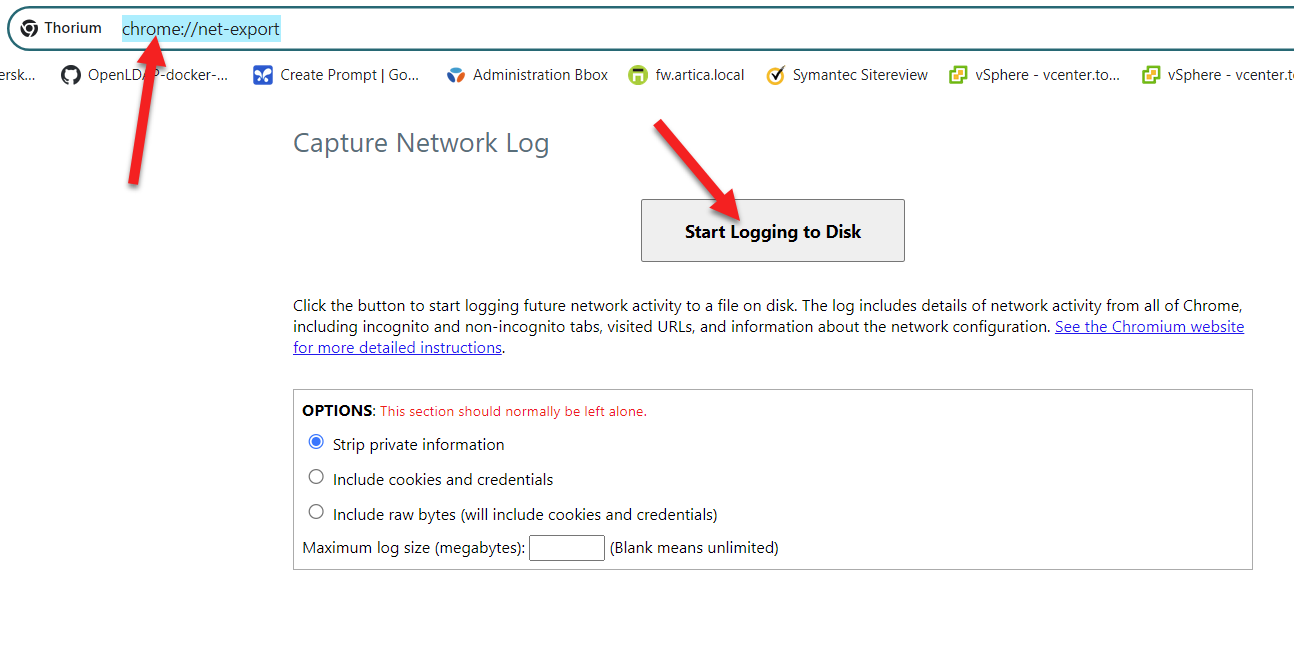
When you click Start logging to disk on chrome://net-export/ (or run Chrome with --log-net-log=file.json), you turn on NetLog, Chrome’s built-in event tracer for the entire network stack.
- Name resolution:
DNS_LOOKUP_START, DNS_LOOKUP_END - Connection setup:
TCP_CONNECT, SSL_HANDSHAKE, PROXY_CONNECT - Protocol negotiation:
HTTP2_SESSION, QUIC_SESSION - Request/response:
URL_REQUEST_START, HTTP_STREAM_JOB, URL_REQUEST_END - Socket reuse & pooling:
SOCKET_POOL_CREATED_SOCKET, SOCKET_POOL_BOUND_TO_CONNECT_JOB - Errors / policy decisions timeouts, policy blocks, certificate errors, HSTS or Expect-CT enforcements
- Every entry is timestamped to the millisecond and tagged with a source-ID so you can follow an individual request all the way from
DNS_LOOKUP_STARTtoURL_REQUEST_END.
The whole sequence is serialized to a single JSON file:
Often hundreds of thousands of lines—that you later open in the NetLog Viewer (https://netlog-viewer.appspot.com) for filtering, timeline graphs, and per-event inspection