¶ About
This feature allows you to get information of all monitored services
It is available in 4.30x Service Pack 72 or above.
If you upgrade to a Service Pack 72, you need:
- To restart the Artica WebConsole using /etc/init.d/artica-webconsole restart
- If you using an Active Directory NTLM connection, add the monitoring using “php /usr/share/artica-postfix/exec.nltm.connect.php --monit” command line.
¶ Security
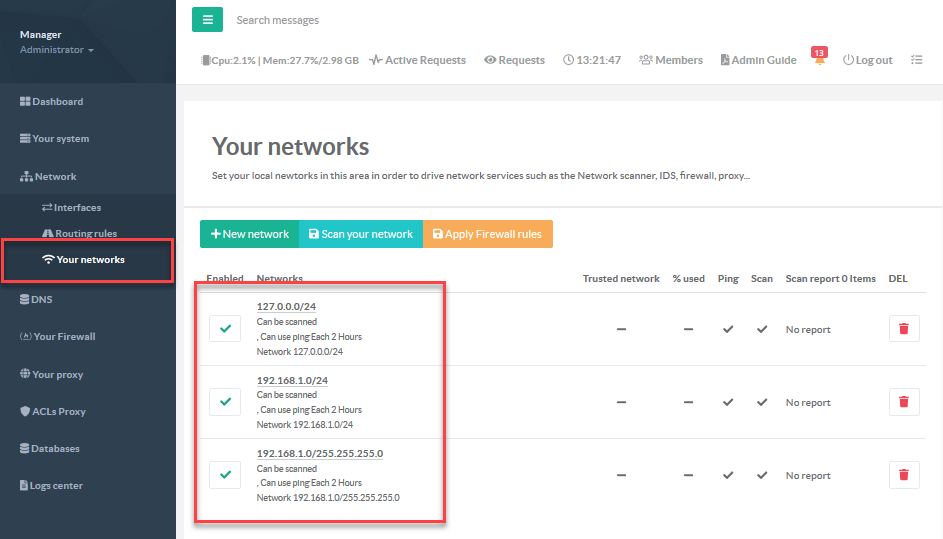
This API can only be displayed for “Trusted Network”, if you want to monitor this web page from a Zabbix server or any monitoring console, you have to add the IP address of your console inside the Internal networks.

To get all services status, use the https://192.168.1.190:9000/api/rest/status/[PROTO]
Where PROTO can be one of html xml json
for example:
https://192.168.1.190:9000/api/rest/status/json
Return a json of monitored services.
You will see a service section that lists all monitored services
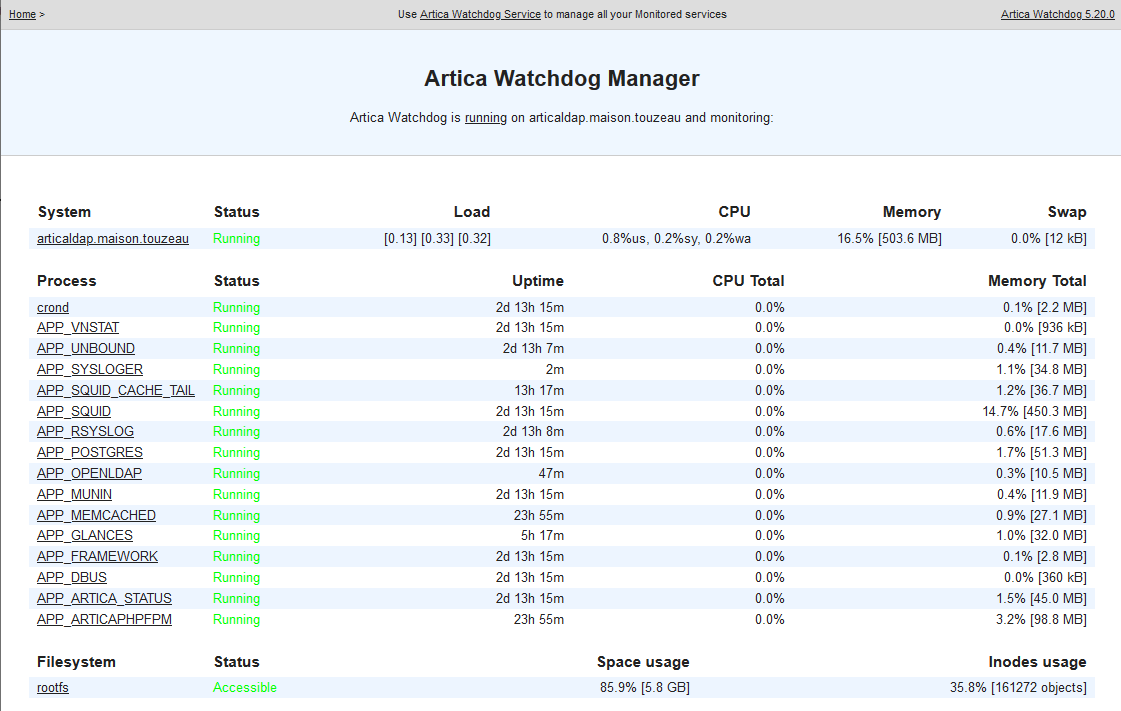
https://192.168.1.190:9000/api/rest/status/html
return a dynamic web page of monitored services
